Categories B2B

A Brief History of Online Advertising

Remember when “surfing the net” meant traversing a minefield of unwelcome pop-up ads? When “digital advertising” referred almost exclusively to obnoxious flashing banners and random sidebar ads?

Online ads have matured a lot since those days, but it’s still important to look back at the flashy, gaudy, sometimes messy origins of internet advertising to better understand where we’re headed — and where there’s still room for improvement.  

Check out a condensed history of online advertising below.

Sign up for HubSpot Academy's Ads Training Course [Free Online Course]

The History of Online Advertising

1994: The first banner ads appear

Image credit: Wired

On October 27, 1994, the world of advertising was forever transformed by a small graphic bearing the presumptive words, “Have you ever clicked your mouse right here? You will,” in a kitschy rainbow font. The age of banner ads had officially begun.

You can thank (or blame?) Wired magazine’s former online off-shoot HotWired for introducing the world to the enduringly ubiquitous banner ad. HotWired was a digital publication, and it needed a way to generate revenue to pay its writers.

The publication devised a plan to set aside portions of its website to sell space to advertisers, similar to how ad space is sold in a print magazine. They called the ad spaces “banner ads,” and charged advertisers an upfront cost to occupy the real estate for a set time period — very different from today’s pay-per-click model. 

AT&T paid HotWired $30,000 to place the banner ad above on their site for three months. The ad enjoyed a click-through-rate of 44%a number that would make most marketers balk in disbelief today. To put that in perspective, the average clickthrough rate on display ads today — 22 years later — is closer to 0.06%

Users enticed to click the mysterious banner were transported to a very early landing page for AT&T. Visitors could click links to view information about landmarks and museums around the world to highlight the internet’s ability to transport you to different locations virtually.

Craig Kanarick, one of the digital consultants hired to work on the campaign, remembers the team’s goal was to make an ad that didn’t feel like an ad, and actually offered valuable content to users. “Let’s not sell somebody something,” he recalled thinking, “Let’s reward them for clicking on this thing brought to you by AT&T.” 

The banner ad concept blew up as a way for websites to keep their content ungated and free for users, and it wasn’t long before other companies — such as Time Inc. and CMP’s Tech web — were seeking out advertisers to lease banner space as a sustainable way to scale their sites. 

1995: Display ads become increasingly targeted 

As banner ads continued to gain popularity, advertisers became increasingly interested in targeting specific consumer demographics, rather than just placing their ads wherever space was offered and hoping the right people would see it. This led to the beginning of targeted ad placement.

WebConnect, an ad agency that specialized in online ads, began helping their clients identify websites their ideal consumers visited. Now, companies could place ads where their target demographics were more likely to see them.

This was nothing short of revolutionary in the digital advertising space. Not only were companies reaching more relevant audiences, but websites hosting the ads were also able to display banners that were more applicable to their visitors.

WebConnect also introduced the CustomView tool, which capped the number of times a particular user was shown a single banner ad. If a user had already seen an ad a certain number of times, they would be shown another ad instead.

Users tend to stop noticing a banner ad after they’ve seen it before, so capping the number of times a user sees an ad helped early online advertisers prevent “banner fatigue.” Ad frequency capping is still a common display ad tactic advertisers use today. 

1996: ROI tracking tools begin to improve 

In 1996, banner ads plastered the internet, but advertisers still didn’t have a good process to determine if these ads were actually driving tangible results for their businesses. Marketers needed a way to more efficiently manage their display ad campaigns across multiple websites and report on how users were interacting with their ads.

Doubleclick emerged on the scene as one of the first ROI tools for banner ad campaigns. They offered advertisers a new service called D.A.R.T. (Dynamic Advertising Reporting & Targeting), which enabled companies to track how many times an ad was viewed and clicked across multiple websites.

The most impressive feature of D.A.R.T. was the fact that advertisers now had the ability to track how their ads were performing and make changes to a live campaign. Previously, advertisers needed to wait until a campaign was completed before they could analyze the results and optimize their next banner for better performance. If an ad was performing poorly, they were forced to wait it out.

With Doubleclick, advertisers could see if an ad’s performance was suffering midway through a campaign, and they had the option to make changes. For example, if a marketer noticed their ad was underperforming on one website, they could remove the ad and devote those resources to another website where the ad was performing better.

Doubleclick’s success also gave rise to a new pricing model for online advertising: Cost per impression (CPM). Previously, websites were paid a flat fee to host banner ads for a predetermined time period. With improved ad tracking, banner pricing transitioned towards an ROI-based model.

1997: Pop-up ads quickly rise and fall 

It would be an understatement to say that pop-up ads suffer from a poor image problem. They’ve been called internet’s original sin and the most hated advertising technique, and one of the original developers has even apologized for creating the underlying code that unleashed them upon unsuspecting web surfers. Even so, these much-maligned ads hold an undeniable place in the history of online advertising.

So who created the very first pop-up? Before you get your pitchforks and torches out, you should know their intentions were good. Ethan Zuckerman, then a developer for Tripod.com, is widely credited with creating the code that enables pop-up ads to open up a new browser window.

“It was a way to associate an ad with a user’s page without putting it directly on the page, which advertisers worried would imply an association between their brand and the page’s content,” Zuckerman wrote in the Atlantic.

Amidst dwindling banner ad clickthrough rates in the late 1990s, pop-up ads first seemed like a way to save online advertising and capture the attention of increasingly ad-blind users. And while pop-ups did force users to pay attention, they didn’t actually translate to real ROI. By the early 2000s, it was standard for web browsers to come with pop-up blocking features.

1999 – 2002: Advertisers turn to paid search and pay-per-click

By this time, the web was expanding rapidly and users needed a better way to navigate the terrain. With search engines steadily gaining popularity, advertisers looking to create ads that were more targeted and less loathsome turned to sponsored search as the next digital advertising frontier.

In 1999, GoTo.com — an emerging search engine company that would later be acquired by Yahoo — introduced the first pay-for-placement search engine service. Advertisers were given the opportunity to bid for top search engine results on particular keywords. Despite some initial outcries that paid search would lead to corrupt results, GoTo.com was able to monetize their search engine through the model.

Pay-for-placement eventually evolved into pay-per-click. Companies bid on search result placement on a per-click basis: e.g., I’ll pay GoTo.com $1 per click if you put my company as the top search result. This led to search results that were largely determined by how much a company was willing to pay. The highest bidders were usually listed first, even above more relevant content, and it was unclear to users which results were paid and which were organic content.

The user experience of paid search was suffering, and one up-and-coming search engine thought they could fix it. Google introduced AdWords in 2000, originally under a pay-for-placement ad model. Google wanted to create a sponsored search experience that generated revenue without compromising the quality and relevancy of search results.

While previous paid search models like GoTo.com relied on bids from advertisers to determine search rankings, AdWords introduced a Quality Score model, which took into account an ad’s clickthrough rate when determining its placement on the search results page. Even if an ad had a lower bid, it would still appear above other, less relevant paid ads in search results thanks to its high clickthrough rate. The Quality Score model is still used today.

2006: Digital ads become hyper-targeted

As social media platforms picked up steam in the mid 2000s, advertisers sought a way to integrate ad content in a way that was both effective and non-intrusive. Marketers wanted a plan of action to reach younger internet users who were increasingly unswayed by banner ads and spending most of their internet time on social networks.

After previously resisting ads on its site, Facebook started working with advertisers in 2006 as a way to increase the young company’s profitability. They started with small display ads and sponsored links, and eventually moved onto ads targeted to a user’s demographics and interests. Despite some controversies along the way, Facebook has proven itself to be a targeted ad pioneer, changing the way that companies reach their desired audiences online.

“Our strategy is much less [about] increasing the volume of ads and much more about increasing the quality of the content and the quality of the targeting to get the right content to the right people,” Facebook founder Mark Zuckerberg said in 2014.

Targeting consumers with relevant ads — rather than bombarding them with a large volume of ad content — has become a standard practice for online advertisers, particularly on social media. Beyond Facebook’s targeting efforts, other social networks such as Twitter, YouTube, and Google+ focus on providing an advertising experience for users that doesn’t feel aggressive or impersonal.

2010 – present: Marketers find value in native ads

Around this time, a new group of media companies began to emerge. Websites like BuzzFeed and Mashable presented advertisers with new opportunities to connect with their audiences through sponsored content and native advertising

Advertisers pay to produce articles, videos, and other types of content for news, media sites, and Google.

While the goal of the content is to promote the business, the format looks and feels less like an ad and more like a regular piece of content on the host’s website.  

Instead of relying on ads that disrupt their target audience’s online experience, native advertising allows marketers to create promotional content that supplements a user’s online experience. “Marketers interested in targeting ads to specific consumers in an unobtrusive fashion should seriously consider spending some time on native,” Mimi An concluded in a HubSpot Research study on native advertising.

Websites that traditionally generated revenue from display ads began to realize that they could create a better user experience by relying primarily on native ads — rather than traditional display ads — without compromising on ad revenue. 

The Future of Advertising

That’s a look back at the history of online advertising — but what about the future?

According to recent data from HubSpot Research, 91% of respondents say ads are more intrusive today compared to just two to three years ago. It’s clear that the future of digital advertising pivots on developing a targeted ad experience that offers consumers relevant content without feeling nosy or invasive.

To get the full scoop on the current state of digital advertising and how your company can keep its ad strategy relevant, download HubSpot’s State of Inbound report here.

ads online course

Categories B2B

The Ultimate Guide to Database Marketing

No matter what your service or product is, you need to get in front of potential customers in order to make the sale. Many businesses put their faith in social media.

While social media platforms are an amazing way to get in front of people, they have two major drawbacks. First, you may have tens of thousands of followers on your platform of choice. However, thanks to algorithms that few (if any) humans understand, you only reach a small percentage of those followers with any given post.

Second, what happens if that platform ever goes away? Don’t think for a minute that you’ll receive a neat list of contacts. If a platform ever shuts down, your audience will evaporate in seconds.

→ Download Now: Free Marketing Plan Template

Fortunately, knowing this is half the battle. Now that you understand that you don’t “own” your contacts through social media, it’s time to look at how to safeguard your audience and take ownership of and responsibility for their contact information and data.

This is called Database Marketing and you’re about to learn why it’s essential to your business as well as how to utilize it properly.

What is database marketing?

Before our digital landscape became as vast as it is, businesses would collect names and addresses and send out direct mail pieces like postcards, brochures, flyers, etc. to potential and existing customers.

While traditional direct marketing still exists and can be an asset to your business, digital options give business owners a world of choice when it comes to reaching their audience. It allows you to figure out how customers want to be marketed to and then give them what they want.

Database Marketing is where businesses collect customer data such as:

  • Names
  • Addresses
  • Phone numbers
  • Purchase history
  • Customer support history

Once collected, this information is used to create personalized experiences for each customer and house personal and buying information about them.

The Benefits of Database Marketing

Now that you understand what database marketing is, you can determine if it’s right for you.

Hint: It’s probably right for you.

No matter the size of your business, keeping your database fresh, constantly adding to it, and nurturing it is absolutely essential to your business success. You’ll see a variety of benefits, such as:

1. “Own” your contacts.

Information is power, and when you put all of the power in the hands of social media platforms, you put your future in jeopardy. Social media is wonderful and should be a part of your marketing plan, but it shouldn’t be the whole plan.

2. Speak directly to your audience members.

It’s so loud out there! It’s impossible to turn on the television or the radio, or surf the web without being bombarded with marketing and sales messages touting the next best thing that you absolutely must have.

These messages are meant to cast a wide net and reel in any customers they can. You, however, are savvy. You know that in order to be “heard” above the noise, you’ll need to adjust your messaging to your specific audience. Database marketing allows you to do this.

3. Identify avatars or buyer personas.

Who is your best customer? How do they live? What keeps them awake at night? What problem of theirs have you been able to solve? Where can you find more people just like them?

Database marketing allows you to understand your ideal customer and then target individuals who “look” just like them on paper.

4. Segment your buyers.

Create different “audiences” based on their demographics, behaviors, and buying history. This helps you understand them better and offer them more of what they want and less of what will lose their attention.

5. Create loyalty programs that inspire repeat purchases.

Figure out what is the best channel and time to contact your customers so you receive maximum engagement.

6. Kick your customer service into high gear.

Give your staff the opportunity to view all of the interactions a customer has had with your brand.

Database Marketing could be the answer to your business prayers. Of course, like anything, you have to do it properly to see a good return on investment. For that, we need to look at building a database marketing strategy.

Avoid These Pitfalls of Database Marketing

Before we dive into strategy, let’s look at a few challenges you may encounter with database marketing.

1. Data Decay

People move, change jobs, change names, abandon email addresses, and start new ones. Life changes like these could render their information relatively useless.

2. Data Accuracy

Typos happen. Sometimes accidentally, but sometimes purposefully. Some customers know that you’ll be sending them marketing emails once they provide an email address, and they don’t want to hear from you.

That’s okay. If they don’t want to hear from you, you don’t actually want to reach them because they aren’t your ideal audience.

While there’s no easy way to avoid purposeful typos, avoiding accidental errors is possible with drop-down choices instead of blank comment boxes. You can also confirm people’s information when you speak with them.

It’s important to clean up your database frequently, purging contacts with out-of-date or inaccurate information, and merging contacts with multiple profiles. This allows you to focus on reaching the people who could be your next customer or client and take care of those who already are.

3. Using Customer Data Quickly and Appropriately

If you’ve ever received an email two years after doing business with someone, it’s probably come as a shock. Chances are, they don’t update their database in a timely fashion so they completely missed the window to build rapport with you after that first interaction.

Don’t make this mistake. Once you receive information, greet them in some manner and then touch base with them on a regular schedule to nurture the contact. You’ll also want to keep their information to yourself.

Tips for Building a Database Marketing Strategy

Without a strategy, you’ve just got a whole lot of pointless data. Put your database to work for you by creating a sound strategy from the very beginning. Here’s how:

1. Identify who you want to reach.

Who is it that you’d like to do business with and what do they look like on paper? This can include demographics like age and gender, marital status, income level, and location. It might also include psychographics such as their interests, activities, and opinions.

Create an ideal customer profile or persona and then use this to determine what information you need to capture for your database.

2. Make it a team effort.

While it may have “marketing” in the title, database marketing can be influenced by multiple departments in your organization. The marketing, sales, and customer service or support departments all have contact with potential and existing customers. Look for feedback from them to build the most effective database.

3. Use the right tools.

There are countless database marketing software options out there to meet your needs. Do some research, ask for recommendations, and find one that suits your business best. Once you’ve chosen a solution, provide your employees with the training they need to utilize it fully.

4. Gather customer data.

Now that you know how you’re collecting data, it’s time to decide what you need and get started. The options are endless, however here are a few things to consider:

  • Demographic Data – This includes gender, age, marital status, parental status, health, and financial status.
  • Psychographic Data – This includes interests, actions, and opinions. What do they value? What type of lifestyle do they lead?
  • Acquisition Data – Through what channel did they enter?
  • Technographic and Activity Data – How do they connect with your brand? Is it through a desktop or mobile device? Android or iOS? Do they use your website, social media pages, or a mobile app to interact with your brand?
  • Transaction and Correspondence Data – How often do they purchase from you and what do they buy? Have they reached out outside of a sales situation for assistance of any kind?

5. Keep your data clean and safe.

As we mentioned before, it’s very easy for data to become outdated and useless. Review it frequently and back it up so if something happens to your database, your entire customer history is not lost.

6. Don’t be creepy.

You can find out a lot about people on the internet. Just because you can doesn’t mean you should. Respect your customer’s privacy and don’t collect or brandish information on them that won’t help serve the end goal of earning the customer and serving them better.

Examples of Database Marketing

Database marketing can be used in a number of ways and really depends on your needs and goals. Here are just a few of the ways you can incorporate database marketing into your business.

Provide amazing customer support.

Acquiring customers is important, but if you can’t keep them, you’re just spinning your wheels. Your customer service team should have access to your customer database. This allows them to review a customer’s buying history when they call in with an issue.

Imagine knowing exactly what product they are calling about and expressing your ability to help with that product before they even launch into the problem. Your approach will be personalized and will save them time explaining.

For example: “Thanks for calling. I see that you just purchased our new state-of-the-art alarm system. I can help you get that set up today.

Know what products and services your customer needs.

Having a chat about the weather is a great way to build rapport with a customer or potential customer. Do you know what’s an even better way? Not trying to sell them things they don’t need.

For example: Looking at a customer profile, you can see that they live in a high-rise apartment, have no pets, and have small children. You can skip trying to sell them the latest doggie door.

Identify your best customers and potential upsells.

When you understand who buys frequently and in large amounts, it becomes easier to identify options for upsells.

For example: Perhaps your customer has received a wine-of-the-month for two years now. You’ve just started a cheese-of-the-month add-on. You can target them with emails designed to introduce this new product opportunity.

There are a variety of ways to reach your existing and potential customers. A well-rounded marketing plan will include many of these. However, if you’d really like to get the most bang for your marketing buck, make sure that you include database marketing.

You’ll reach the customers you want to reach, and learn how to speak to them in a way that helps them hear what you’re saying. Your database will be the gift that keeps on giving.Marketing Plan Template

Categories B2B

A Simple Explanation of Exempt vs. Non-Exempt Employees

There are two types of employees – “exempt” and “non-exempt.” You might’ve seen these terms on job postings, or heard them in conversation.

If you aren’t sure what they mean, don’t worry. Trying to understand labor laws can be confusing, especially if you’re new to the workforce. — We’ve broken these terms down to help you navigate the exempt vs. non-exempt employee classification.

→ Click here to access 5 free cover letter templates [Free Download]

How the Fair Labor Standards Act (FLSA) Affects Exemption Status

Signed into law in 1938 by President Franklin Roosevelt, the Fair Labor Standards Act establishes minimum wage, overtime pay eligibility, and recordkeeping standards in addition to youth employment guidelines for both the private and public sector. During the time the act was signed, child labor was the norm and adults often worked 10 or more hours per day, six to seven days per week.

While the conditions that brought about the FLSA may seem like the dark ages, the law is still relevant today and plays a major role in how the modern workforce is regulated. It establishes the guidelines for how work hours are documented and how exempt and non-exempt employees should be paid. Generally the FLSA provides an exemption from minimum wage and overtime regulations for employees in the following fields:

  • Executive
  • Administrative
  • Professional
  • Outside sales
  • Computer-related occupations

That said, job titles alone do not determine exempt status. Instead the employee’s specific job duties and salary have to meet requirements set by the Department of Labor. Certain states, like California, impose additional requirements to qualify for exempt status.

Exempt Employees

One of the biggest differences between exempt and non-exempt employees is overtime pay. An exempt employee is not entitled to overtime pay according to the FLSA.

Instead, exempt employees are given a salary, and they are expected to finish the tasks required of them, whether it takes 30 hours or 50. Exempt employees are also excluded from other FLSA protections afforded non-exempt employees.

To be exempt, an employee must earn a salary basis no less than $684 per week, or $35,568 annually.

Non-Exempt Employees

On the flip side, non-exempt employees must be paid overtime — one-and-a-half times their hourly rate, for any hours worked beyond 40 each week. As the name implies, they are not exempt from FLSA regulations.

Most non-exempt employees must be paid the federal minimum wage of $7.25, but some states with a higher cost of living have set minimum wages above the federal base. Non-exempt employees can be paid a salary, an hourly wage, or commission.

Exempt vs. Non-Exempt Employee Examples in the Workplace

Let’s consider this example to demonstrate the difference between exempt and non-exempt employees:

Sarah, who is an exempt employee, is stressed because she hasn’t finished her proposal due Monday. She spends most of Friday night tweaking it and finishing it up, staying at the office until late. On Monday, she gets her paycheck — the same amount of money she would’ve gotten if she hadn’t stayed late.

Meanwhile, John, who is a non-exempt employee, chooses to take extra shifts and work overtime on Fridays. He doesn’t have to — he could leave at 5 p.m. if he wanted to, but on Monday when he receives his paycheck, he knows he’ll receive extra money from the overtime hours worked.

Which classification is right for you?

Working as an exempt or non-exempt employee will each have their own set of pros and cons. Which classification works best for you will depend on your personal needs and preferences. 

This article was originally published Oct 19, 2018 but has been updated for comprehensiveness.

Professional Cover Letter Templates

Categories B2B

The 8 Best Free Flowchart Templates [+ Examples]

A great business needs a great many things in order to succeed – strong leadership, a competitive advantage, and a unique vision among them. However, one element that could make or break a business is its process (or lack thereof).

A clear, repeatable process has two major hurdles to a successful implementation in a business. Number one is the development of that process, and number two is getting buy-in from stakeholders on that process. That said, the best way to overcome both of these potential roadblocks is to transparently and logically outline a process.

Many businesses use flowcharts to accomplish this task, as flowcharts:

  • Visually outline a process roadmap for a full-scope understanding, and…
  • Can be easily digested by employees who need to know and follow the process.

To help you create actionable flowcharts for your organization, we’ve listed the eight best flowchart templates for you to download and start using today to create a better process in any area of your business.

Let’s dive in.

→ Access Now: 8 Business Flowchart Templates [Free Tool]

What is a flowchart?

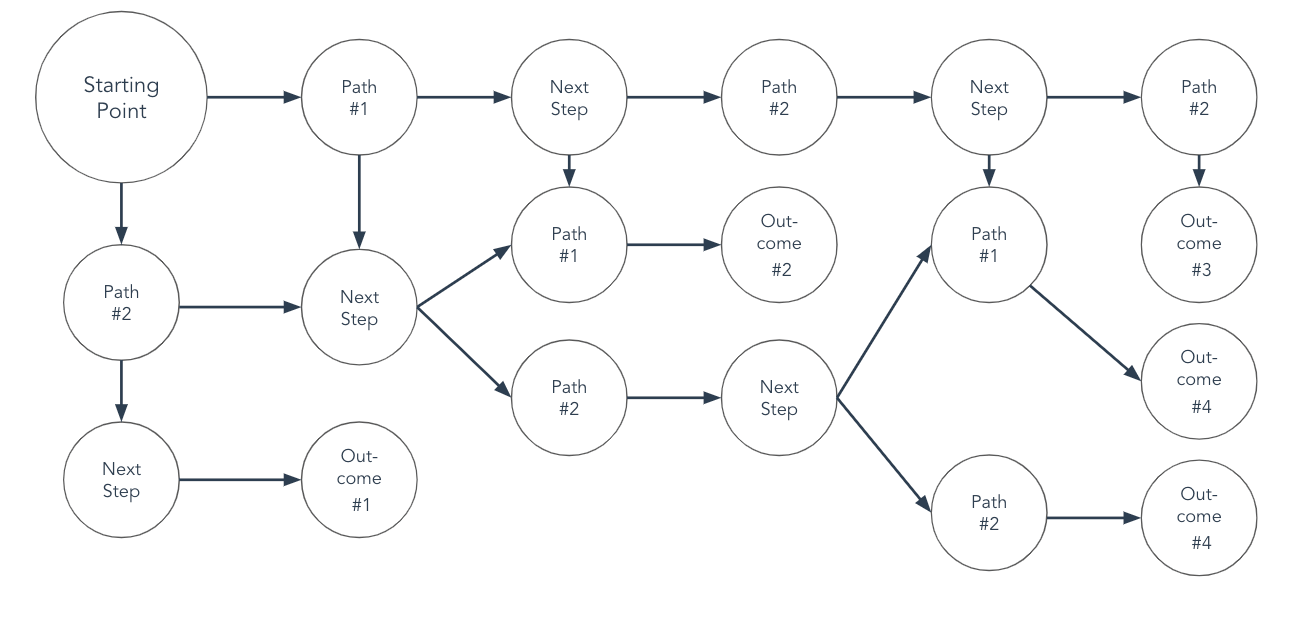
A flowchart is a visual map to help explain a process for decision making, achieving results, or projecting an outcome. Flowcharts begin at a starting point on the graphic, and as users follow through it, they will choose one of several outcomes or options until reaching the end of the process.

In business, flowcharts might be used for any of the following purposes:

  • Team alignment and process
  • Email nurturing
  • Customer journey mapping
  • Customer or employee onboarding
  • A/B testing
  • QA-ing work
  • Career progression
  • Customer support

Here are eight templates and examples of flowcharts for business – each one comes with a download link for you to start using that template right on Google Slides.

8 Flowchart Examples for Business

1. Basic Process Flowchart Template

basic flowchart template

Download this Template

The basic flowchart template is the ideal solution for those just getting started with flowcharts. The template allows its designers to specify a starting point, two potential outcomes, and then the resulting aftermath of those decisions. Due to its limitations, this flowchart template might be best suited for basic processes, like a simple A/B test.

Flowchart Example: Basic Process Flowchart

A/B test flowchart example

This template visualizes how a user visiting a company’s landing page could convert and become a lead.

Who should use this flowchart?

This flowchart is helpful for those looking to design an A/B test to determine the most way to get the results they’re looking for.

What We Like About This Flowchart Template

The basic process flowchart is easy to use and follow and is ideal for documenting straightforward or simple processes.

2. Swim Lane Flowchart Template

swim lane flowchart template

Download this Template

The swim lane flowchart template is for dividing up the steps of a process into different sectors. For your business, these different sectors could be time periods, teams, employees, or work requirements.

Flowchart Example: Swim Lane Flowchart

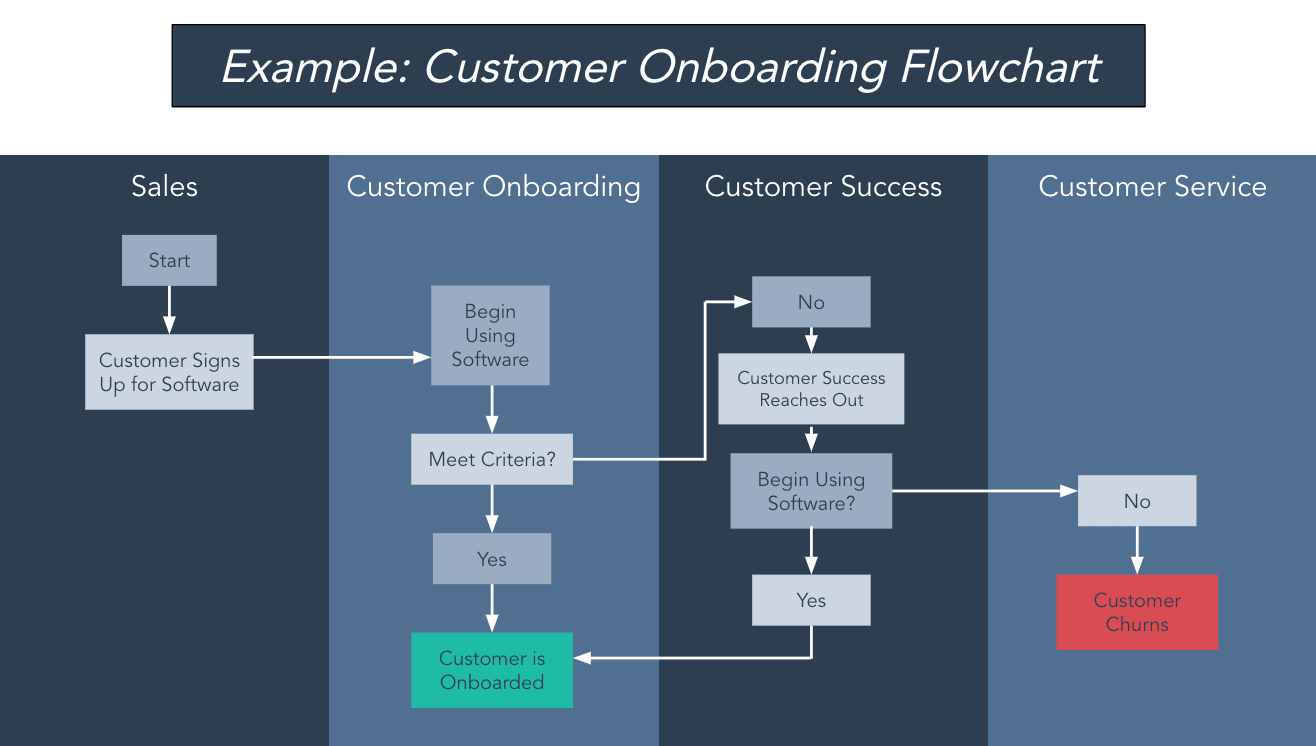
customer onboarding flowchart example

In the example above, the swimlanes are divided by department to illustrate the process of the customer journey.

Who should use this flowchart?

Swim lane flowcharts are particularly helpful for those who oversee cross-functional processes.

What We Like About This Flowchart Template

This template visualizes the different process steps that take place across multiple organizations.

3. Task Flowchart Template

task flowchart template

Download this Template

A task flowchart template is differentiated by what each shape on the flowchart represents. This format is beneficial when multiple teams’ work is intertwined throughout the process, as individuals can easily discern the tasks for which they are responsible. These responsibilities are noted in a key on the flowchart for a quick reference.

The shapes can also represent different types of action.

Flowchart Example: Landing Page Flowchart

landing page flowchart example

In the example above, the different shapes represent the start of, end of, and actions taken during the process of viewing a landing page. This task flowchart example follows an “if this then that” format, showing the various outcomes that could occur when a potential customer visits a landing page.

Who should use this flowchart?

Project managers looking to keep track of various tasks and their outcomes.

What We Like About This Flowchart Template

The task flowchart visually depicts how various contributions to a product support the end result. Each stakeholder can see how their tasks impact the flow of the project.

4. Complex Flowchart Template

complex flowchart template

Download this Template

For a flowchart that doesn’t need gridlines or different shapes, this template is the best solution. It provides the option for multiple endpoints depending on which steps are taken through the process.

Flowchart Example: Hiring Flowchart

hiring flowchart example

The above hiring visual is an example of a complex flowchart that has various events and potential outcomes.

Who should use this flowchart?

Teams looking to manage processes that could have various endpoints or projects that have multiple steps and stakeholders involved.

What We Like About This Flowchart Template

Complex processes can be difficult to keep track of. This flowchart template creates an intuitive visual for multi-step processes.

5. Circular Flowchart Template

circular flowchart template

Download this Template

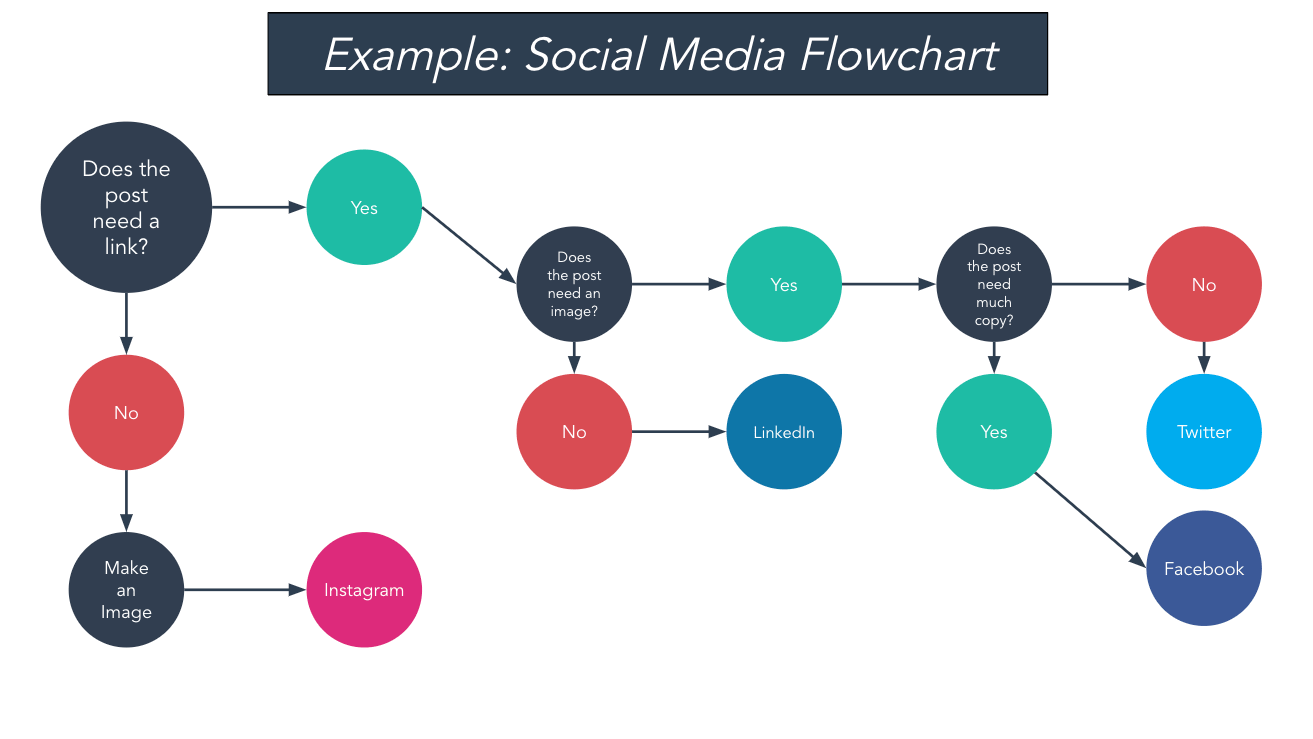
The circular flowchart template changes things up with a different shape, but it also provides a different path structure.

Flowchart Example: Social Media Flowchart

social media flowchart example

For example, in the image above, the template can be used as a decision-making framework. Here, it’s used to help a social media manager determine which site should be used to post content on.

Who should use this flowchart?

Social media managers, product marketers, and content strategists may find this template suits their needs.

What We Like About This Flowchart Template

This template has a cleaner appearance than some of the more complex templates and may be better for visual learners.

6. Linear Flowchart Template

linear flowchart template

Download this Template

A linear flowchart template is a solution for when there’s really only one optimal result, and every step of the process will either lead someone to that outcome or result in the process simply ending.

Flowchart Example: Email Nurturing Flowchart

example of an email nurturing flowchart

One example – highlighted above – might be for a nurture stream. In the image, the process ends whether someone signs up for an event or not.

Who should use this flowchart?

Email marketing specialists, sales teams.

What We Like About This Flowchart Template

With one singular goal, this flowchart format has a clear beginning and end.

7. Tree Flowchart Template

tree flowchart template

Download this Template

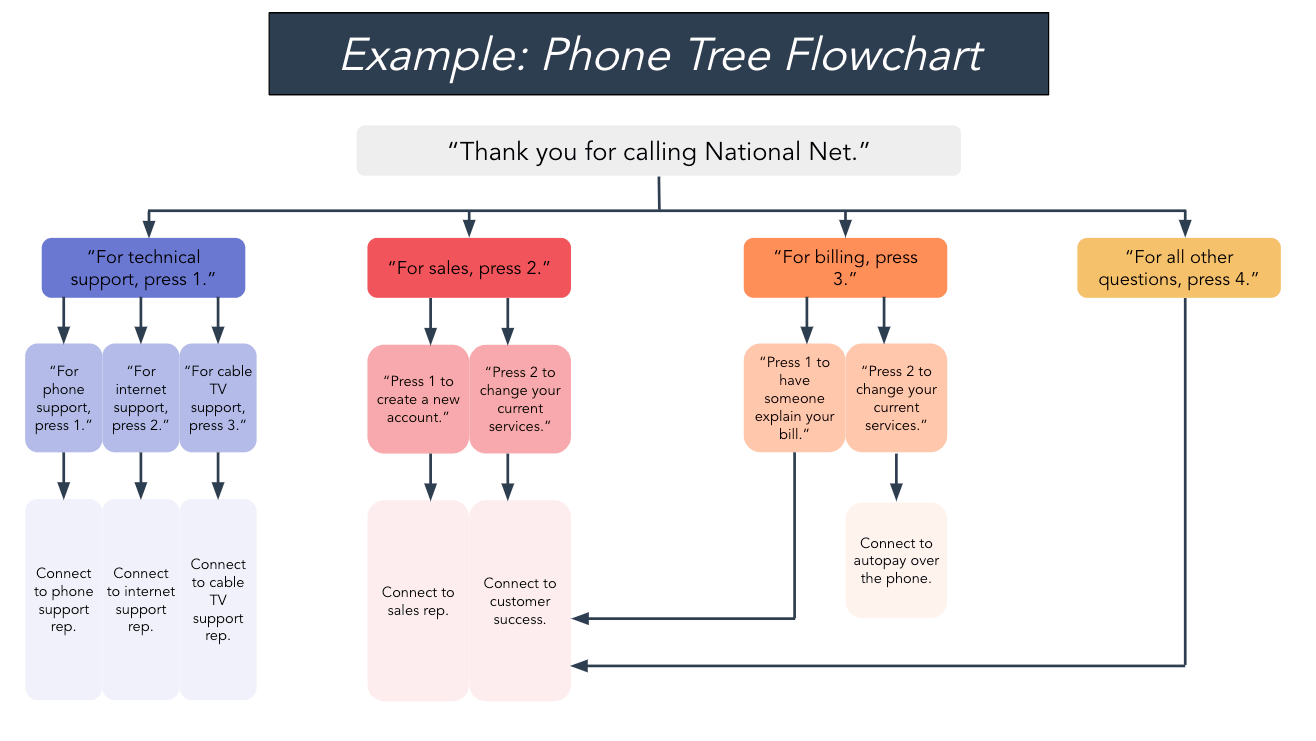
A tree-style flowchart template makes the most sense for situations where there are multiple options and when each option has a clear and distinct next step.

Flowchart Example: Phone Tree Flowchart

phone tree flowchart example

This example depicts the various options and next steps a caller can take when contacting a business via telephone.

Who should use this flowchart?

For businesses, this flowchart would be perfect for the support department – which can use this template to map out responses from automated chat support or (as outlined above) a phone tree.

What We Like About This Flowchart Template

Each action has a clear next step and a predetermined outcome.

8. Organizational Flowchart Template

organizational flowchart template

Download this Template

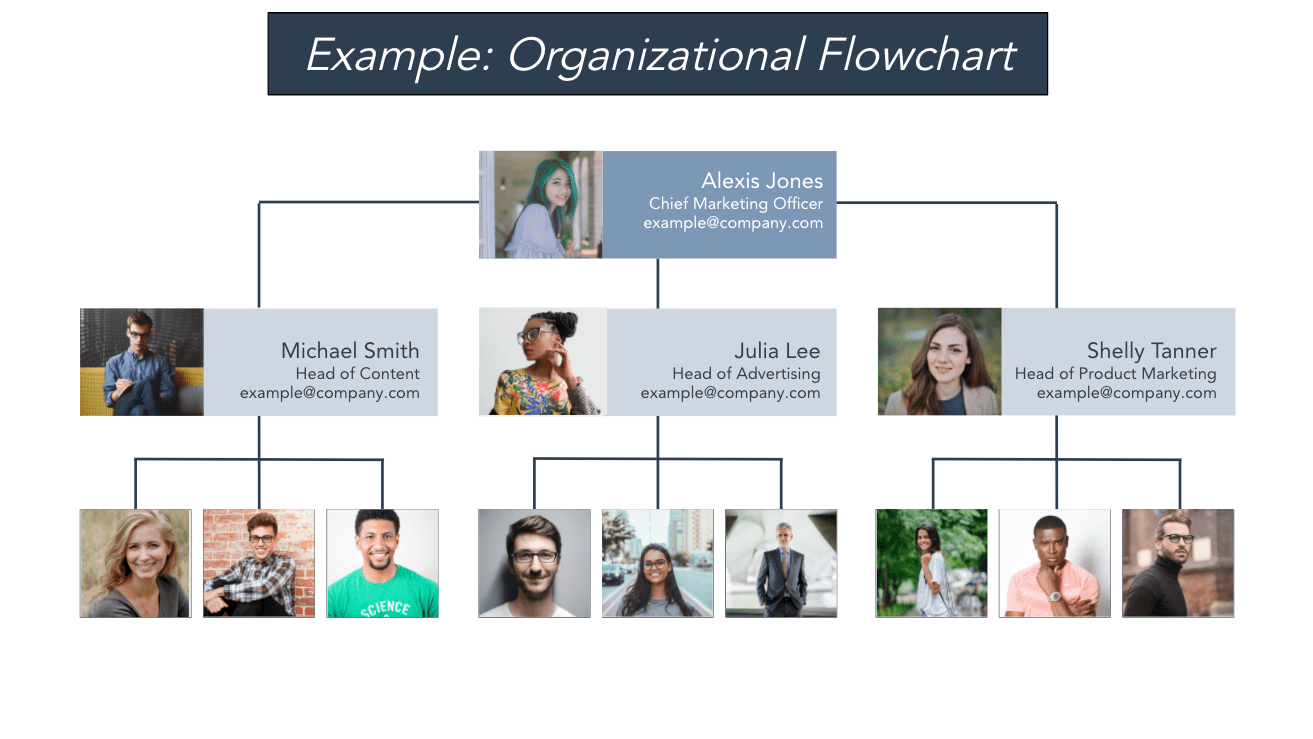
The final flowchart businesses might want to utilize is an organizational flowchart (or org chart) template.

Flowchart Example: Organizational Flowchart

organizational flowchart example

While not exactly procedural, this visualization helps those within the company quickly understand who reports to whom and who is responsible for what.

Who should use this flowchart?

This template is utilized by the heads of a company and/or a department to outline the chain of command in an area of the business. It can also be used by Human Resources teams to inform team structure and organizational decisions.

What We Like About This Flowchart Template

Users can see how a team is structured at-a-glance, and can quickly determine who they need to go to for their project or to have their questions answered.

Business Flowchart Templates

Business flowchart templates are the fastest and easiest way to build flowcharts. All of the above templates are downloadable by clicking here and are completely customizable when it comes to shape, format, color, and imagery.

Download the templates for free to better illustrate and communicate processes in your company.

New Call-to-action

Categories B2B

Cumulative Layout Shift: What It Is and How to Measure It

We’ve all had it happen to us: we try to choose an option on a website, and right before we click, the page jumps away and we end up clicking something we didn’t mean to. Doh!

Like a game of “down low, too slow”, this website behavior makes us feel slow and frustrated. Fortunately, website developers are now incentivized to improve their site experience with the release of Google’s Core Web Vitals; a set of metrics that help site owners measure and improve the user experience of their web pages.

→ Download Now: SEO Starter Pack [Free Kit]

Cumulative Layout Shift is one of these key metrics that measures the “jumpiness” of a website and how it unexpectedly moves as elements load. Let’s take a closer look at how this metric works, and how you can make sure your own website is following best practices so you rank higher on search engines and provide your users with a better experience.

What is Cumulative Layout Shift?

Cumulative Layout Shift (or CLS) is a measure of how much a webpage unexpectedly shifts during its life. For example, if a website visitor loaded a page and, while they were reading it, a banner loads and the page jumps down, that would constitute a large CLS score.

Along with Largest Contentful Paint (the amount of time it takes to load the largest piece of content) and First Input Delay (how long it takes for a page to be interactive or “clickable”), CLS is part of Google’s Core Web Vitals. Google’s web crawlers measure CLS on each page they index.

What causes Cumulative Layout Shift?

Page shifts happen when content loads at different speeds and causes the layout to change and alters what the viewer is looking at. Advertisements loading slowly, videos of unknown size suddenly appearing, or DOM elements being dynamically added are all potential causes of CLS.

The example below shows what happens when an ad banner is loaded after the rest of the webpage loads. The content is pushed down, and the user experience is negatively impacted.

Source

It can be difficult to know if your users are experiencing CLS, because not every device or environment operates in the same way. If you’re loading your website in a development environment you may have elements cached or they may be loading locally. Personalized web content based on cookies will behave differently for every visitor, especially depending on their location. Plus, mobile users can have a very different experience – a small shift on a web browser may be monumental to someone viewing the site on a small screen. Really the only way to understand your users’ experience is to measure CLS, which we’ll go over below.

Why is CLS important?

Understanding CLS is critical for two reasons: your visitors’ experience and your search engine ranking.

Your visitors have high expectations when it comes to your site’s performance. In 2020, 93% of people reported leaving a website because it didn’t load properly.

Jumpy websites that load in pieces or with unexpected behavior will cause your visitors to find another website to browse. And if they do stick around, a high CLS score is likely to cause usability problems like choosing the wrong option, checking out too early, or missing parts of your website altogether.

This problem is only exacerbated by the large number of internet users who are browsing on their smartphones. When viewing your site on a small screen, any jumps and layout shifts on the website are certain to have a big impact on mobile user experience.

Optimizing your site and reducing your cumulative layout shift is essential to providing customers with a good experience.

Secondly, Google ranks sites based on their page performance. A better user experience results in a higher search ranking. If your page doesn’t meet the standards that Google lays out in their Core Web Vitals guidelines, your site will be penalized.

Google doesn’t want to direct people to sites that don’t perform well. Aligning with CLS best practices can help your website move up the rankings. And since 68% of online experiences start with a search, making sure your site shows up on the search results page is important to generating inbound traffic.

How do you measure Cumulative Layout Shift?

The good news is that you don’t have to measure CLS yourself because Google makes it really easy to analyze your page performance with their PageSpeed Insights tool, or in the Chrome browser using Lighthouse Tools.

To analyze performance in PageSpeed Insights:

  1. Enter a website URL into Google’s PageSpeed Insights tool.
  2. Click ‘Analyze.’
  3. Check your performance. You can review both mobile and desktop performance, which you can switch between using the top left corner navigation.

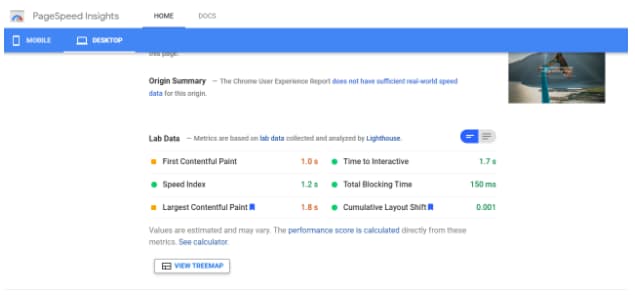
The page analyzed below shows a good cumulative layout shift score of 0.001.

pagespeed insights exampleTo analyze performance using Lighthouse tools:
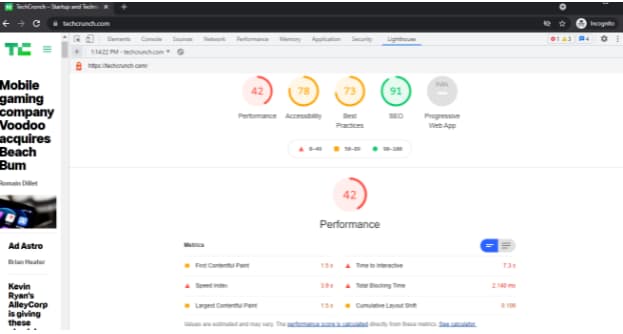
  1. Open up the website you want to analyze in Chrome.
  2. Navigate to Developer Tools by clicking the three dots in the top right corner of the browser window, choosing “More Tools” and then “Developer Tools.”
  3. When the console opens, choose “Lighthouse” from the options along the top.
  4. Click “Generate Report.”

The page below shows a CLS of 0.109, or “needs improvement.”

CLS score example Lighthouse provides a detailed audit of what contributed to that score. To review the audit, scroll down and choose “Show audits relevant to CLS.”
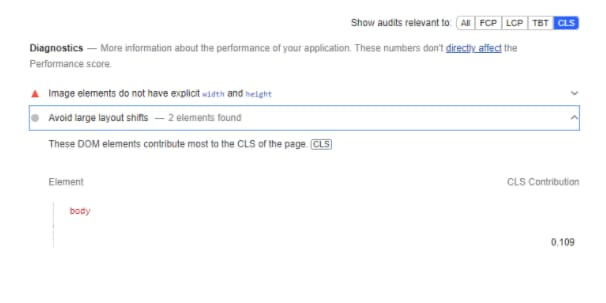
lighthouse audit example

More About Impact Fraction and Distance Fraction

Two terms you might see when researching CLS are “impact fraction” and “distance fraction.” These are the two variables that Google uses to calculate CLS.

layout shift score = impact fraction x distance fraction

Impact fraction relates to the size of the unstable element in comparison to the viewport. Distance fraction is the amount the unstable element moves as a ratio of the viewport.

So a high CLS would consist of a large element moving a long distance. A small CLS would be the result of a small element moving only a small distance.

CLS is the largest “burst” or group of layout shift scores that occur during a session window. Essentially, if a bunch of shifts happen within a five-second window, this would be considered disruptive and result in a large CLS score.

What is a good CLS score?

A good cumulative layout score is anything less than 0.1. The reports from PageInsights or Lighthouse tools will automatically flag any poor scores, as well as provide advice on how to optimize the page for better performance.

cumulative-layout-shift-1Source

How To Improve Cumulative Layout Shift

There are a few best practices that website owners can follow to improve their CLS score:

1. Use a CMS (content management system).

Especially one that integrates with Google Lighthouse or other diagnostic tools. This will make sure that you’re designing with best practices in mind, and flag any issues before you launch your site.

2. Specify size attributes for images and videos.

Rather than letting them set their own height and width, dictate size attributes for your media. By setting these attributes, you’re telling the browser how much space to set aside, even if the image isn’t loaded yet.

3. Understand how ads can influence your layout.

Google Publisher Tag offers extensive guidance about how to reserve space for ads.

Load new content below the viewport. Loading content above what the user is viewing will often cause a page to shift.

4. Use transitions and animation to provide context around page changes.

For example, a “Read more” link that scrolls the user down the page would not impact CLS because it’s an expected layout shift.

A Note On Expected Vs Unexpected Layout Shift

CLS only takes into account unexpected changes. If the layout changes because of a user-initiated action, there is no impact on CLS. This is a helpful tool to use when you don’t need to load everything all at once. Instead, offer users the opportunity to choose which elements they want to view through “read more” links or “expand topic” accordions within your page.

Offer A Better User Experience With CLS Optimization

Paying attention to CLS not only provides a better user experience, but it also boosts your search result rankings. It’s a win-win.

To meet Google’s standards for CLS, start by using a diagnostic tool to measure your website’s current performance. Take into account the basic guidelines outlined above, and keep layout shifts top of mind when designing your website, especially around transitions and content additions. With these few simple considerations, you’ll see better results across the board.SEO Starter Pack

Categories B2B

A Simple Guide to Lean Process Improvement

There are many businesses out there that operate with a mindset of “Well, that’s how we’ve always done it.” Unfortunately, this type of close-minded thinking can lead to a great deal of waste.

Tasks may be unnecessary to achieve the final goal, processes may be repeated multiple times when one would be sufficient, employees may be wasting time on superfluous responsibilities, and materials may be wasted during manufacturing.

When this occurs within an organization, employee satisfaction decreases so turnover increases, quality suffers so customer satisfaction and retention is decreased, and one look at the books will likely indicate the company is hemorrhaging money.

Download Now: 2021 State of RevOps [Free Report]

You might think that this type of operational inefficiency only occurs in large corporations and organizations, however, it’s just as prevalent in small-to-medium-sized businesses and can be seen throughout every department.

Efficiency is the name of the game for successful businesses, and you’re about to learn one of the best ways to turn your business into a lean, mean, money-making machine.

Lean Process Improvement

What is lean process improvement?

Lean process improvement is a concept originally developed by Toyota to decrease the amount of time it took from receiving an order to delivering it. While lean process improvement is often discussed in a production environment, the concept can be applied to service, healthcare, technology, and even government.

Consider a marketing department that has multiple people working on the same project but not communicating. Rather than each handling a specific aspect of the campaign, several people tackle the same task while other activities go unhandled.

It’s not a traditional production environment, however, the team could benefit from creating an easy-to-follow process that looks at the desired end product and finds the simplest route to get there.

The whole idea behind this way of thinking is that when you look at the big picture, you can find ways to eliminate waste, whether that’s financial, physical, time, or employee energy that could be spent elsewhere. This concept may take a while to implement, and that’s okay. It’s not meant to be a short-term solution, but rather a change to the entire mindset and culture of a business.

What are the benefits of lean process improvement?

Businesses that incorporate lean process improvement see a variety of benefits from this shift. These include:

  • Less waste
  • Less inventory
  • Increased productivity
  • Better quality
  • Happier customers
  • Fewer costs
  • More profits

It makes perfect sense that when you remove the redundancy, streamline processes, and create less waste, your bottom line will increase. When your customers receive their product faster and with less hassle, you’ll have happier customers who return and recommend you to others. With more customers, your bottom line increases once again.

If you’d like to see this type of improvement in your organization, read on to learn lean process improvement steps.

How do I incorporate lean process improvement into my business?

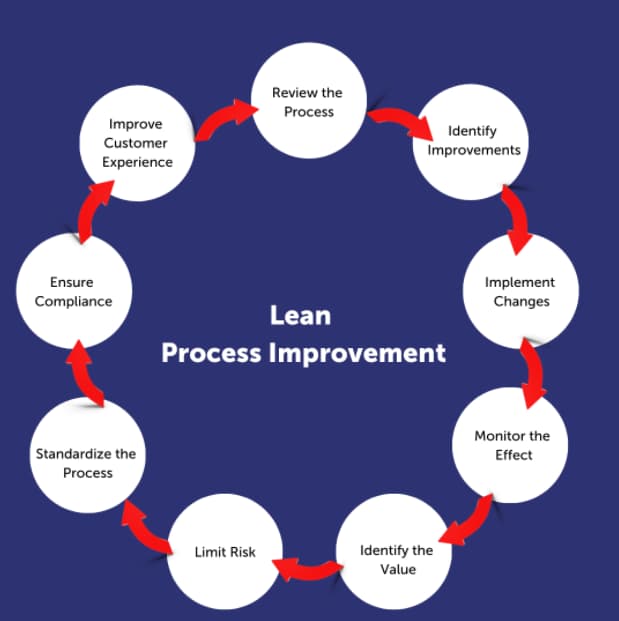
You guessed it … there’s a process to lean process improvement. There’s actually a series of nine steps you’ll need to implement to create this level of efficiency in your organization. Let’s take a closer look at lean process improvement steps.

steps of lean process improvement

1. Review the process you want to improve.

This step is essential because if you don’t know what you need to work on, you won’t know where to focus your efforts. In order to do that, you need to talk to employees on the front line.

The biggest mistake companies make during this process is implementing changes without ever speaking to the people who do the job day in and day out. Interview your frontline workers, and ask them what’s not working well in their daily routine.

2. Identify what improvements need to be made.

Once you’ve identified what needs to be fixed, it’s time to involve your team once again. There’s a very good chance that they already know how to fix the problem and just haven’t been able to implement it because of a “That’s-how-we’ve-always-done-it” mindset.

3. Implement the suggested changes.

How will you put the changes into action? Create a plan so everyone involved understands and buys into the process. This is the best way to ensure organization-wide success.

4. Monitor how the changes are impacting your efficiency.

While it would be great if your first attempt at execution was a success, the reality is that once the process is tested in the field, it will need to be further refined. The only way to do this is through constant monitoring and reevaluating. As new issues appear, you can address them and make the necessary changes.

5. Identify what activities add value.

Throughout these steps, you’ll be assessing every single action and every aspect of your process. During this time, you must evaluate every single activity to determine whether it adds value to your process, or detracts. If an activity is deemed unnecessary, it should be removed and the process tested without it.

6. Limit risk.

Production and often business, in general, is inherently risky. This time should be used to identify any risky activities or aspects that are part of the current process and eliminate or simplify these tasks. This may involve automating an activity or simply changing the way in which it’s executed.

7. Standardize the process.

As you create and refine the process, document your progress thoroughly. This allows the process to be repeated, properly, by other employees or depending on the specific process, by other teams or departments in your organization.

8. Ensure compliance.

While lean process improvement should be a company-wide shift in culture, your industry or governing body may have specific metrics, procedures, and standardized measurements that you must adhere to. Compliance may not be sacrificed in the name of efficiency.

9. Improve the customer experience.

In determining the success of a lean process improvement plan, Marketers consider the customer experience to be “the moment of truth.” Ultimately, whatever improvements you make during production or service must trickle down to positively impact the customer.

Lean Process Improvement Tools

As you embark on this journey, there are a number of tools available to you. These tools can help you organize your thoughts, identify issues, and implement your plan. The following are just some of the tools you can look to for support.

Just like any other tool, the one you choose must be the right one for the current job. If you start out with one and don’t find that it meets your needs, consider trying another.

  • Why Analysis: By asking “Why?” repeatedly, you can identify the root cause of the challenges you’re experiencing.
  • Ishikawa Diagram: Also known as a “Fishbone diagram” or “cause-and-effect diagram”, it allows you to examine a problem from multiple angles, including measurements, materials, people, methods, machines, and environment.
  • Affinity Diagram: This works great in the early stages of lean implementation as it can help sort and organize large amounts of data. Identify the value you bring to the customer and then uncover problems with your existing processes.
  • FMEA Analysis (failure mode and effects): Catching issues before they get out of hand can help you eliminate waste and save money. This tool allows you to examine your flow and identify problems early on.
  • 5S Dashboard: This approach can help you organize your workspace for maximum efficiency. While the original tool has five S’ based on Japanese terms, many businesses have added a 6th practice. These stand for:
    • Sort
    • Set in order
    • Shine
    • Standardize
    • Sustain
    • Safety
  • Plan Do Check Act (PDCA) Cycle: Create continuous improvement by repeatedly analyzing a problem, testing a hypothesis, reviewing, and then analyzing the results, and finally, putting the plan into action once it’s successful.

Lean Process Improvement Techniques

There are a number of approaches that have been created to assist in lean process improvement. Just like the tools, it’s important to find the right technique for your project and your organization. For example:

Six Sigma (DMAIC Model)

With a goal of reducing the variation in processes, Six Sigma works to increase both external and internal customer satisfaction by standardizing workflow. The DMAIC Roadmap stands for:

  1. Define
  2. Measure
  3. Analyze
  4. Improve
  5. Control

Kanban

These boards allow you to visualize your workflow and use value stream mapping to break down your workflows into stages. Having a visual representation of your workflow, and all the activities that make it up, can assist you in identifying inefficiencies.

Sharing this board with your entire team allows anyone to stop the process when a problem occurs. Now, it becomes everyone’s job to find a solution.

WIP Limits

Within Kanban boards exist a concept known as WIP Limits or “Work in Progress Limits”. Every stage in a Kanban board workflow is represented by a column. WIP limits force you to stay under a maximum number of work items for each stage. This can be per person, per work stage, or for the entire project.

Having these limits in place ensures that current tasks are finished before new ones are started, and helps to complete activities faster.

Final Thoughts on Lean Process Improvement

Now that you understand how important lean process improvement is to a successful, efficient organization, it’s a good time to reiterate that this is an ongoing process. If you attempt to overhaul your entire organization overnight, you will undoubtedly fail and most likely make things worse than when you started.

Identify the biggest sources of inefficiency in your organization and target these first, one at a time, until you’ve created a well-functioning business.

Finally, remember that your most valuable assets are the employees getting their hands dirty every day. Attempting to identify problems and create solutions without getting their input is akin to driving blind when you could simply open your eyes.New call-to-action

Categories B2B

How Do Conversion Paths Work? A Step-by-Step Guide

As a marketer, a big part of your job is to convert qualified website visitors into leads. Simple enough.

More specifically, inbound marketing requires you to create remarkable content they’ll want to trade their contact information for. From there, those leads turn into opportunities, who turn into customers and even promoters.

Clearly, conversions are a big deal. So how can you optimize yours? By creating conversion paths optimized to most effectively convert your ideal visitors into leads.

Download Now: Free 8-Week Conversion Rate Optimization Planner

While not all conversion paths are identical and depend on the type of business they’re for, they have a few common attributes: a landing page, a call-to-action, a content offer or end point, and a thank you page.

  • Landing page: A landing page is a specific page on your website designed to collect a visitor’s contact information in exchange for a resource, like a course, ebook, or other product.
  • Call-to-action: A call-to-action is a section on a webpage or advertisement that persuades the visitor to act or do something. These can take the form of buttons prompting website visitors to sign up, subscribe, or buy a product.
  • Thank you page: The thank you page shows your visitors that you appreciate them for taking a desired action. For example, a thank you page might appear after a visitor has signed up for a newsletter or filled out a form.
  • End point: This may be in the form of a content offer, which is any material or resource given to a visitor in exchange for their contact information, completing the conversion path. These materials could be guides, ebooks, courses or other products. For e-commerce, instead of a content offer, a conversion path may end in a purchase.

Conversion Path

In order to convert into a lead, a visitor sees a content offer of interest to them (or product in the case of e-commerce), clicks on the call-to-action button to access that content, and is then taken to a landing page. On that landing page, the visitor can provide their information on a form in exchange for access to the offer itself. Upon submitting that form, the now-lead is taken to a thank you page where they receive the offer.

Voila! Conversion path complete.

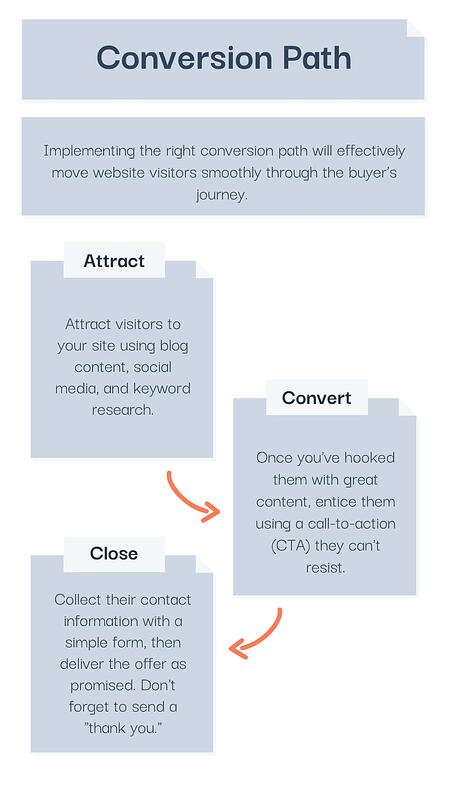
By designing and implementing the right conversion paths, you can most effectively move website visitors through the buyer’s journey and help them become customers and promoters.

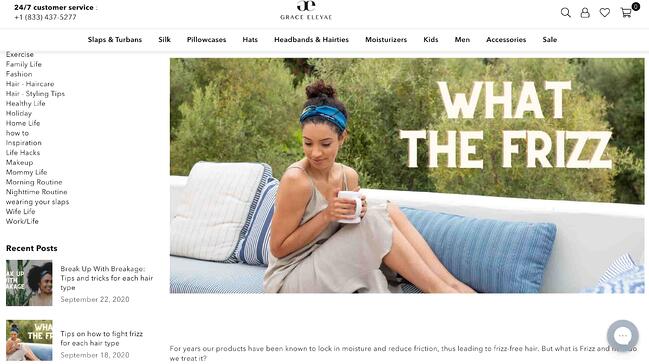
Conversion Path ExampleConversion path example landing page

Let’s say you’ve been lured to the landing page above after searching online for tips for preventing frizzy hair.

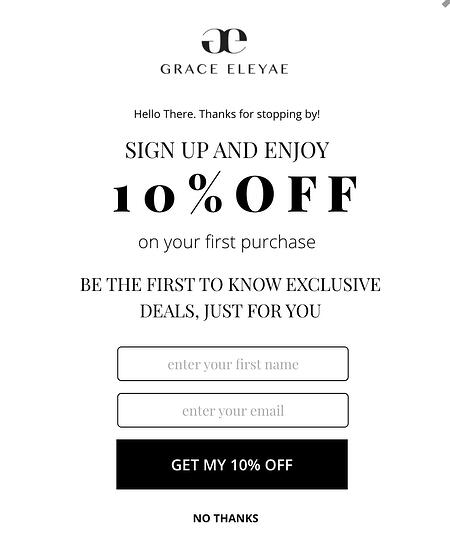
You’re then prompted by a CTA (pictured below) that invites sign up for their email list in exchange for 10% of their products.

Conversion path example CTA You decide you’d like to try one of their satin-lined caps to fight frizz and take them up on the offer.
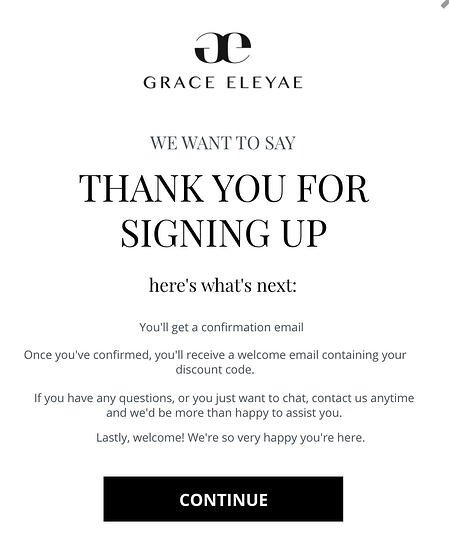
conversion path example thank you page A thank you page pops up once you’ve filled out the form giving instructions on how to access your discount code. Once you get the code from your email, you use it to purchase one of their caps. Ta-da! The conversion path is complete.
What makes a good conversion path?

Well as you might have guessed, you need content, a call-to-action, a landing page, and a thank you page. But with so many conversion paths out there on the internet for your potential customers to explore, it’s more important than ever to create the RIGHT paths — paths that your ideal customers are drawn to and most effectively convert the right visitors into leads.

What are the steps to creating a conversion path?

Let’s explore the key items you need in your inbound toolkit to create effective conversion paths that turn casual visitors into customers.

1. Attract your target audience with context-appropriate content.

Content is the fuel that powers effective inbound strategies—and it’s what you’ll use to convert those website visitors into leads. The good news is that content is everywhere! Content is what your website pages are filled with, what goes into your emails, and what’s hosted on your blog — your website pages, emails, and blog are just vehicles to deliver that content.

Although content is in no short supply, in order for it to act as your inbound rocket fuel, you need to create the right content. As you can probably guess, the right content is optimized to appeal specifically to your buyer personas. It should focus on the challenges they’re trying to overcome and the goals they’re looking to hit. Most of all, it should be relevant and interesting to them.

But here’s the kicker — it’s not enough to just create persona-specific content. That content needs to be relevant to your persona based on where they are in the buyer’s journey.

The buyer’s journey is the active research process your personas go through leading up to making a purchase — and specific content is more relevant to your personas at different stages of that journey. This is where the “context” piece comes in: It’s not enough to just create content for your personas. You have to make sure that content is relevant to what they’re interested in and hoping to learn more about.

Most visitors to your site are still at the very beginning stages of that journey — they might not even know what your product does or how it can help them. All they may know is that they have a problem or there’s an opportunity at hand. So, the content that will most appeal to your personas when they’re first visiting your website and converting a lead will generally be high-level and educational in nature.

In order to be an effective tool in your conversion path toolkit, make sure you have remarkable content tailored to your buyer personas and where they are in the buyer’s journey.

2. Create landing pages that speak to your personas.

After you’ve developed a remarkable content offer that speaks to both who your personas are and where they are in the buyer’s journey, the next step is to leverage that piece of content to convert website visitors into leads. That’s where landing pages come in.

Landing pages are specialized website pages whose sole purpose is to collect visitors’ contact information in exchange for something of value to them. Landing pages contain forms that potential leads must fill out and submit before getting access to your remarkable content offer. And like that offer, great landing pages must also be tailored to both who your personas are and where they are in the buyer’s journey.

In order to most effectively convert website visitors into leads, your landing pages must present the benefits of your offer that are most relevant to the particular problem your persona is experiencing — and discuss the aspects of that problem that are most important to where your persona is in the buyer’s journey.

Imagine, for example, you work at a pet store and have created an ebook on raising a puppy. Someone who’s at the beginning of the buyer’s journey probably won’t be too interested in downloading your ebook if your landing page talks all about how your ebook contains the best techniques for housebreaking. Instead, an effective landing page for this persona might highlight how your ebook discusses how to choose the right dog breed for you.

Great landing pages focus on both who your personas are and where they are in the buyer’s journey.

3. Use attention-grabbing calls-to-action.

While having a remarkable content offer and great landing page are key to creating a successful conversion path, your website visitors need a way to actually access that landing page in the first place. That’s where calls-to-action come in.

Calls-to-action or CTAs, are buttons you can embed throughout your website that advertise your content offers. When a visitor clicks on one of these calls-to-action, they’ll be taken to your landing page. In effect, every call-to-action you have on your website is the beginning of a conversion path.

To create calls-to-action that get those clicks and act as key steps within your conversion paths, you must ensure that the message displayed on your call-to-action aligns with the message on your landing page — and the content itself.

Great calls-to-action should be just that: action-oriented. Since their main objective is to garner clicks and direct people to landing pages, ensure that they’re click-worthy by using actionable language and colors that help them stand out from the rest of your website.

4. Close the deal with optimized thank you pages.

If a call-to-action is the beginning of a conversion path, a thank you page marks its end. Thank you pages are the final item you need in your inbound toolkit to lead your website visitors down a conversion path to become, well, a lead.

Thank you pages are specialized website pages from which your now-leads can download the offer promised by your call-to-action and landing page. They’re also an opportunity to move people further along in the buyer’s journey, by including things like additional calls-to-action that complement the offer you’ve just provided your lead.

Improving the Mobile Conversion Path Experience

Designing for mobile is no longer optional, it’s a must. According to a 2020 report from Global System for Mobile Communications Association (GSMA, formerly Groupe Spécial Mobile), nearly half the world’s population uses a mobile device to access the internet. By the end of 2019, 3.8 billion people were mobile internet users, an increase of 250 million users from the previous year.

With those numbers in mind, there’s a good chance visitors will access your website from their phone or tablet versus a desktop. If you want to create an effective conversion path, It’s imperative to consider the mobile user experience. Follow these steps to create a mobile conversion path that sets visitors up for success.

  • Start with a responsive design: A responsive design adapts to both desktop and mobile devices by rendering the display differently based on screen size. Visitors won’t have to pinch or zoom in while browsing your website via mobile, which leads to a better user experience. Additionally, having a responsive design signals to Google that your site is mobile-friendly, which will help improve your rankings in search results for mobile users.
  • Nix cluttered landing pages: When it comes to smaller screens, minimalism is a virtue. Having long-form, relevant content, images and video may translate well on desktop, but can be too busy for mobile devices. Avoid unnecessary text, images, and features that may make it difficult for visitors to find the information they’re looking for. Visitors can’t become leads if they can’t navigate your website. Consider the information most relevant to your audience, and leave out the rest.
  • Keep CTAs to a minimum: As noted above, with smaller screens you’ll want to take extra care with how that real estate is allocated. Opt for one (or a few), clear call-to-action button as the main focus that your potential customers can easily find. Keep sign-up forms short, only asking for the information you absolutely need. Avoid burying the call-to-action at the bottom of the page after several paragraphs of text. In most cases, mobile users will not scroll down to the end of the page to see it.

As people become increasingly attached to their phones, taking the mobile user experience into account will improve your chances of converting more leads.

Conversion paths are invaluable in inbound marketing as they convert website visitors into leads. When done right, an effective conversion path can move leads beyond an initial conversion, ultimately turning them into customers.

Editor’s note: This post was originally published in May, 2014 and has been updated for comprehensiveness.

Get the 8-Week CRO Planner

Categories B2B

The HubSpot Blog’s 2022 Marketing Industry Trends Report: Data from 1,000+ Global Marketers

The only constant in the world of marketing is that things are always changing.

And, if you’re a marketer, business leader, or entrepreneur aiming to plan an effective 2022 strategy that puts you far ahead of your competitors, you probably want to know:

As the HubSpot Blog’s Research Analyst, I launched our Marketing Industry Survey to help fellow bloggers and readers answer the questions above — and gain further industry insights into 2022 planning.

→ Download Now: Free Marketing Plan Template

Our Survey Sample

We surveyed 1,067 global marketers from across B2B and B2C companies from small to large employee sizes. The sample included professionals at varying experience levels from seven countries: the U.S., Australia, Canada, Germany, UK, France, and Japan.

Read on to learn about some of the most interesting key findings, get strategic recommendations based on our data, and find even more blog content that dives even deeper into our research.

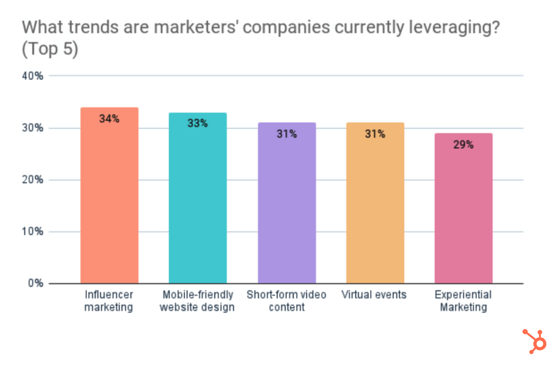
Which trends are marketers already leveraging today?

Influencer marketing, mobile-friendly website design, short-form video, virtual events, and experiential marketing are the top trends marketers currently leverage.

These trends will see continued growth in 2022 as most marketers will increase their investment in them or continue investing the same amount.

Let’s dive into each trend and how marketers are thinking about them moving into the next year.

1. Influencer Marketing

While influencer marketing was once less accessible to small brands that couldn’t budget a high-priced celebrity or a top-tier social media user, the growth of social media has led to an abundance of influencers with nano to macro followings.

Now, as more businesses invest in influencer marketing, they’re beginning to see solid benefits. In our survey, Influencer marketing was the most popular and most effective trend with the biggest ROI.

By working with an influencer that’s gained trust, expertise, or notability in a specific industry, brands can gain awareness, traffic, and potentially conversions from that influencer’s audience.

2. Short-Form Video

As TikTok’s virality grew in 2020 and 2021, other social media platforms like Instagram and YouTube rushed to get into the short-form video game. And, as more platforms continue to shift to prioritizing quick, fast-paced content, so have marketers.

Our Marketing Strategy Survey results show that short-form video is popular, effective, and still growing, especially among social media marketers.

In fact, 30% of social media marketers plan to invest more in short-form video than any other social media marketing strategy in 2022. Meanwhile, 33% plan to leverage short-form video for the first time in 2022.

3. Virtual Events

Virtual events are popular, effective, and will continue to be a top trend marketers leverage in 2022.

However, 17% of marketers who leverage virtual events will decrease their investment in 2022, the second-highest decrease of any trend marketers invested in during 2021. Additionally, while 31% of marketers currently leverage virtual events, just 9% of marketers plan to leverage them for the first time in 2022.

If you have virtual events planned, don’t let this research panic you. Virtual events are still the third most prominent trend marketers will invest in throughout the next year.

Additionally, the decreases noted above could signal a natural transition from virtual to hybrid or physical events as more public venues fully re-open in the next year. As an event marketer, it will be important to weigh all of your options and local mandates to determine which event type will be most effective and comfortable for your audience in the coming year.

Which trends do marketers plan to leverage for the first time in 2022?

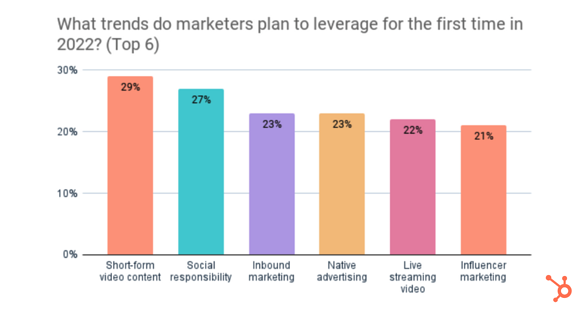
Short-form video, social responsibility, and inbound marketing are the top trends marketers plan to leverage for the first time in 2022.

While I explained some of the appeals to short-form videos above, here’s a quick snippet about the other two trends.  

trends marketers plan to leverage for the first time

Brands Will Take More Social Responsibility

In 2020 and 2021, consumers paid more attention than ever to how companies treated their customers, audiences, employees, and the world around them. And, many companies used this time to take a stance on their values. As these brands took on more social responsibility, they found that current or new audiences shared their values and gained trust, credibility, memorability, and awareness from those consumers.

Moving into 2022, more marketers are recognizing the importance of social responsibility. Investment in social responsibility will continue to grow from those already leveraging it and from marketers using it for the first time.

Digital Transformation Will Boost Inbound Marketing Use

As we move into 2022, consumers will be more connected to the web and digital platforms than ever. And, outbound strategies have gotten even more out of date.

To meet customers and audiences where they are, 23% of marketers will leverage inbound marketing for the first time.

To read more about short-form content, social responsibility, and other key trends analyzed in this survey, check out these posts:

Which marketing channels are businesses leveraging?

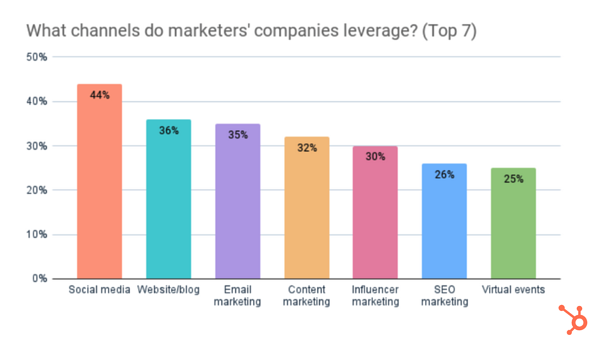
The top channels marketers currently use are social media, website/blog, and email marketing.

the top channels businesses are leveraging

1. Social Media

Social media is the most popular and most effective marketing channel, with the highest ROI.

The use of social media will continue to grow, with 39% of those who don’t use social media planning to leverage it for the first time in 2022.

Additionally, 26% of marketers plan to invest more in social media than any other channel in 2022

In 2022, 51% of marketers who leverage social media plan to increase their investment in social media marketing, and 37% will continue investing the same amount.

The Top Social Media Platforms

1. Instagram

Instagram is the most popular social platform, just ahead of YouTube and Facebook.

However, Facebook has the biggest ROI of any platform, and 25% of social media marketers say they will invest more in it than any other platform in 2022.

2. YouTube

YouTube is No. 2 in terms of usage, but ROI lags behind Facebook, Instagram, LinkedIn, and TikTok. Still, expect to see the platform continue to see marketing growth as brands continue to leverage it for its ginormous audience and growing brand opportunities.

3. TikTok

While TikTok is the No. 6 platform in terms of usage by social media marketers, 62% of those who leverage it plan to increase their investment in 2022, the highest of any social platform.

The Top Marketing Content Formats

Video content, blogs, images, and infographics are the top media formats.

1. Videos

Video leads across the board as the most popular and effective format with the highest ROI, and 30% of content marketers plan to invest in video more than any other format in 2022.

2. Blogs

Blogs are popular, effective, and have the 3rd highest ROI of any format.

The use of blogs will continue growing in 2022, with 29% of content marketers planning to leverage blogs for the first time and 10% planning to invest more in blogs than any other format.

3. Infographics.

Adoption of infographics will continue growing as 45% of content marketers currently leverage them and 38% plan to leverage them for the first time in 2022.

Additionally, 56% of content marketers who leverage infographics say it is the most effective content format they use.

4. Podcasts and Audio Content

Only one in three content marketers use podcasts or other audio content. While 51% of those who do plan to invest more in 2022, 43% plan to continue investing the same amount 

Despite low ROI reports, 53% of content marketers who leverage podcasts and other audio content say it is the most effective format they use.

5. Audio Chat Rooms

Just 14% of social media marketers leverage audio chat rooms like Clubhouse and Twitter Spaces, but 68% of those who do say it’s the most effective social media strategy they use, despite low ROI.

Additionally, 49% of those who already use audio chat rooms plan to increase their investment in 2022, while 47% plan to maintain their current investment next year.

More Insights From the HubSpot Blog

Has this data inspired you to build out or refine your marketing strategy in 2022? Be sure to keep following the HubSpot Blog’s data-driven content to dive deeper into current and emerging industry trends.

Next, check out this post where I give 11 recommendations for marketers based on the data above, plus survey findings that didn’t make it into this post. 

Below are a few blog posts that further break down the findings of our Marketing Industry Trends survey. We’ll continue to update this list as we publish more articles, so be sure to bookmark this page!

More Marketing Industry Trend Insights

The Marketing Trends of 2022: The Ultimate Guide

The Top 5 B2C Marketing Trends of 2022 [HubSpot Blog Data]

6 Short-Form Video Trends Marketers Need to Watch in 2022

11 Marketing Recommendations for 2022 [Based on HubSpot Blog Data]

Marketing Plan Template

Categories B2B

16 Content Marketing Analytics Tools That Finally Do What You Need

To have winning marketing campaigns and content, you need to understand the analytics behind your strategies.

Content marketing analytics look at the metrics your team cares about most to provide insight on the health of your current strategies, progress towards goals, campaign success, and more.

Get Started with HubSpot's Marketing Software for Free


Content Marketing Analytics

There are a number of marketing analytics tools available with customizable metrics, a variety of visualizations and dashboards, and integrations to help you measure the impact of your marketing strategy.

Let’s dive into your best options.

1. HubSpot Marketing Analytics and Dashboard Software

content marketing analytics software: HubSpot Marketing Analytics and Dashboard SoftwareSource

Best content marketing analytics tool for: Measuring the performance of all your marketing campaigns and combining resulting data with your marketing software and CRM platform.

HubSpot’s Marketing Analytics and Dashboard Software makes it easy to access all data and insights from a single location in seconds.

Trigger and/or schedule touchpoints, track custom interactions that are unique to your business, and indicate when a customer is ready for another stage of the buyer’s journey with behavioral events.

Use attribution reporting to connect every customer interaction to an associated record and revenue generated. Pre-built and customizable dashboards, templates — as well as Custom Objects — visualize your data in a format that works for your team so you can easily apply it to segments, campaigns, workflows, and more.

Price

There are four Marketing Hub plans with different analytics features and flexibility ranging price from free (forever) to $3,200 per month.

Pro Tip: Use HubSpot’s Marketing Analytics and Dashboard software to measure the performance of your marketing campaigns in one place with built-in analytics, reports, and dashboards.

2. Buffermarketing analytics tool example buffer

Source

Best content marketing analytics tool for: Understanding channel performance in detail with customizable reports.

Buffer’s content marketing analytics offers the option to build reports according to your goals. Add or remove custom metrics about the performance of numerous social media accounts. You can export those reports to share them easily.

Reports are updated daily so you can be sure you’re receiving timely data. Buffer’s analytics are designed to help you see channel performance at a detailed level on one dashboard.

The software also offers engagement metrics for each account individually. This helps you gain an intricate understanding of how customers are interacting with social content. Measure stories, posts, and hashtag performance as well as access the demographics of your audience across channels.

Price

Buffer’s Marketing Analytics product, Analyze, has two payment options with different features and flexibility that cost $35 per month or $50 per month.

3. Google Analytics

marketing analytics tools example google analytics

Source

Best content marketing analytics tool for: Integrating content marketing analytics seamlessly with your other Google business tools and making data-driven content marketing strategy decisions.

Google Analytics’ intuitive interface is easy to navigate and can be used to understand the performance of your content across multiple platforms. You can also choose to analyze your content marketing efforts across all of your web pages or on an individual page level.

To understand how your content marketing strategy is doing, Google Analytics offers metrics for traffic, navigation, conversion, and organic search. The tool allows you to track user-level interactions to provide insight into the ways your audience is engaging with your content.

This analytics tool also integrates with all of Google’s other business software so you can access all of your data and insights in one place.

Price

Google Analytics offers a free and a paid plan. The free plan is ideal for SMBs and you can get started using it immediately. Meanwhile, the paid plan, called Analytics 360, is ideal for enterprise-level companies and requires you to speak with a sales rep for a quote.

4. SimilarWeb

marketing analytics tools example similarweb

Source

Best content marketing analytics tool for: Understanding where your website and content strategy stand in comparison to industry standards.

SimilarWeb provides traffic and engagement industry standards and tells you where your website stands among them. This information is useful for discovering how performance stacks up against the competition.

With SimilarWeb, break down your daily active users, sessions per user, use-time, and rank. Discover more information about your audience — such as repetitive behaviors or interests — to improve your acquisition strategy.

Price

SimilarWeb offers two plans, one of which is free and another that’s meant for enterprise businesses and requires you to contact a rep for a consultation.

5. Moz

content marketing analytics example moz

Source

Best content marketing analytics tool for: Measuring your SEO content strategy and determining which keywords you should be using.

Moz measures the impact of your search-engine-optimized content. Gain insight into how your work is ranking among others in your industry and which keywords are the most effective to use in your strategy.

Moz’s software tracks your site’s keyword rank and how visible it is over time to learn what is and isn’t performing well among audiences.

Additionally, track how competitors rank on search engine results pages (SERPS) — this allows you to spot areas for improvement and the parts of your campaign you can use to target them. To help with this, use Moz’s detailed reports to see how your content is reaching audiences and what you can do to improve.

Price

There are two main Moz solutions, Local and Pro. Both Local and Pro have different plans ranging in features, flexibility, and price. Local ranges in price from $129-299 while Pro ranges in price from $99-599 per month.

6. Hotjar

marketing analytics tools hotjar example

Source

Best content marketing analytics tool for: Tracking and visualizing sessions on your website with heat maps.

Use Hotjar to track sessions on your site. Hotjar provides heat maps about how and where customers spend their time while on your website.

Hotjar’s real-time videos capture how your visitors are navigating and using your website. This allows you to hone in on the content that’s catching your customer’s eye. You can also track conversions and make inferences about which stage of the buyer’s journey customers might be entering or leaving.

Price

Hotjar offers three types of plans. There are two options for those who want a Personal plan that is either free or $39 per month. These options are ideal for personal and low-traffic websites.

The Business plans range in price from $99-$989 per month depending on the number of sessions per day you receive. Lastly, the Agency plan requires you to contact a rep to chat about a plan for your team and clients.

7. Semrush

marketing analytics tools semrush example

Source

Best content marketing analytics tool for: Tracking SEO and keyword performance across your web pages and content strategy.

Semrush is used for search engine optimization (SEO) tracking and helps you track keyword performance in your content as well as monitor brand mentions cross-platform.

Additionally, the tool tracks Google rankings and which of your web pages receive the most traffic. This is helpful because discovering what drives visitors to your site allows you to adjust the content you’re presenting accordingly.

Price

Semrush offers three plans that range in price from $119 to $449 per month.

8. Quintly

marketing analytics tools quintly example

Source

Best content marketing analytics tool for: Improving social planning by analyzing the success of your social media marketing strategy with customizable metrics.

Quintly provides you with the insight necessary to analyze your content marketing campaigns. It helps you make smarter decisions when it comes to social planning by equipping you with customizable metrics so you can better understand how your marketing strategy is working.

Quintly does a deep dive into all of your accounts to uncover metrics that matter to your teams and goals, and you can sort and share reports by team so everyone gets the information they need.

Reports can also be automated and measured by impact using Quintly’s machine learning system. Users can access the API, integrate with popular software like Google Search, and overcome data silos.

Price

Quintly’s custom plans start at $300 per month.

9. BuzzSumo

marketing analytics tools buzzsumo example

Source

Best content marketing analytics tool for: Visualizing and analyzing real-time marketing trends to tailor content to your target audience.

View and analyze marketing trends in real-time with BuzzSumo by topic so you’re able to create content that’s likely to be relevant to your audience. Trends can also be filtered by location — this way, you’ll have an understanding of what’s popular by region.

BuzzSumo lets you customize your feed so you can get the data that matters most to you. Identify relevant keywords to include in your campaigns, access examples of content proven to be successful on BuzzSumo’s site, and use the data you obtain through the tool to discover how you can drive the most traffic to your marketing content.

Price

BuzzSumo offers four plans that range in price from $99 to $499+ per month.

10. Kissmetrics

marketing analytics tools kissmetrics example

Source

Best content marketing analytics tool for: Discovering how your audience interacts with your website and apps and understanding their behaviors.

Kissmetrics allows you to spot a customer’s journey across multiple devices, analyze their behavior on your website, and review conversion metrics (e.g. bounce rate and time-on-site).

Kissmetrics focuses on behavioral analytics which is helpful if you want to learn about how customers react to and interact with your content. This will also provide insight into what’s most valuable to users and how to keep visitors coming back.

Price

Request a Kissmetrics demo or check out the payment plans for their two main products, one of which is meant for SaaS and one for ecommerce.

The SaaS plan comes with three payment options — those plans are $299, $499, or a custom price (based on your custom plan). Ecommerce also has three plans that cost $299, $499, or a custom price (based on your custom plan).

11. Databox

marketing analytics tools databox example

Source

Best content marketing analytics tool for: Combining all of your marketing data to track and understand the success of your strategy in a single location and in real-time.

Databox is a business analytics and KPI dashboard platform that offers insight into the state of your business. The tool organizes all of your business data — from any source — into a single location for accessible performance tracking.

Over 70 available integrations make the process of bringing your data into the tool — as well as displaying, analyzing, and sharing it — simple.

The Goal Tracking feature allows you to track progress towards your targets by assigning and focusing on SMART goals within the tool.

Scorecards are a feature that notifies you (daily, weekly or monthly) of any updates to your KPIs. There are also other alerts you can receive the moment your data is looking off so you can efficiently resolve the issue before it gets worse.

Price

Databox offers a regular version of their product and an Agency edition. The regular version costs anywhere from free to $248 per month. As for the Agency version of Databox, there’s a free plan but if you need more flexibility, contact a rep for billing details.

12. Supermetrics

marketing analytics tools supermetrics example

Source

Best content marketing analytics tool for: Taking marketing data from any source and moving it into Google Sheets, Google Data Studio, Microsoft Excel, Google BigQuery, or Snowflake for analysis.

Supermetrics is a business analytics tool that you can use to pull marketing data (e.g. SEO, PPC, social media, and web analytics data) from any source and move it into Google Sheets, Google Data Studio, Microsoft Excel, Google BigQuery, or Snowflake. Use Supermetrics as a reporting, analytics, and data storage tool.

Bring your favorite metrics and dimensions into Supermetrics. Then, organize and filter your data within Supermetrics to analyze the success of your efforts and identify areas for improvement.

Price

Supermetrics offers multiple plans for all seven of their products, some of which require you to contact a rep and some of which list pricing on their unique web page.

13. Demand Sage

marketing analytics software demand sage example

Source

Best content marketing analytics tool for: Moving all of your HubSpot data into Google Sheets for easy analysis in your platform of choice.

Demand Sage is a tool used to bring all of your HubSpot data into Google Sheets. There are one-click, customizable reports to help you understand your marketing and sales success and which areas to focus your efforts. Demand Sage offers one-click data sync and one-click, flexible reports.

Within your spreadsheet, create granular, record-level reports and use the table builder to display your data with any view you’d like.

Additionally, attribution and revenue reporting connects marketing and sales data in your reports for greater internal alignment and insight into how your pipeline is working as well as what’s driving revenue.

Price

Demand Sage is free.

14. Grow.com

marketing analytics tools grow.com example

Source

Best content marketing analytics tool for: Importing and transforming business data from a variety of sources and then combining that data on custom dashboards.

Grow.com is a business intelligence platform that allows you to import and transform your business’s data from a number of sources and create dashboards with the metrics that matter to you.

Once your data is imported into the platform, it keeps your most relevant data at your fingertips. Build custom metrics, bring disparate data sources together, and select from a number of chart types to visualize your data however you want to. You can also easily share metrics and dashboards with team members to ensure everyone knows where to focus their efforts.

Price

Get a free Grow.com demo and talk to a rep about the price of the right plan for your business.

15. Plecto

marketing analytics tools plecto example

Source

Best content marketing analytics tool for: Keeping your team on top of goals and targets with dashboard data visualization software.

Plecto is a dashboard data visualization platform ideal for discovering real-time insights from an unlimited number of sources you pull your data from. Filter across the sources you integrate with Plecto and display data on your dashboards with different variables as needed.

Display data with pre-built KPI dashboards in Plecto or customize your own. There are also gamification features to increase employee engagement and motivation as well as keep team members focused on their goals.

Price

Plecto offers three payment options depending on which plan you choose ranging from $200 per month, $350 per month, or a custom price (based on your Enterprise plan).

16. Adverity

marketing analytics tools adverity example

Source

Best content marketing analytics tool for: Automating data integration across hundreds of sources.

Adverity is an intelligent marketing data analytics platform ideal for data-driven marketing. The tool automates data integration from hundreds of sources to give you a single view of marketing performance.

Adverity makes it easy to remove any data silos you may have and provide easy access to centrally-located marketing data so your team members can identify and analyze the information they need.

Adverity comes with augmented analytics, meaning it uses AI to identify trends, areas for improvement, strengths, and new insights in your data. It also automates the process of creating marketing reports and data visualizations to save you time.

Price

Contact Adverity to get a custom quote on the right plan for your business.

Performance Content

When measuring the performance of your content, you’ll need to 1) decide which performance indicators you’re going to measure, 2) track those metrics and KPIs, and 3) analyze and apply your findings. 

But first, what is performance content? 

Performance content is content that you create and optimize with a specific business goal in mind (e.g. increasing user sign ups on a web page or your Blog).

Content Performance Indicators 

Here are some common website metrics and KPIs you might choose to track in order to analyze the success of your content. 

1. Web Traffic

The amount of traffic you get on your website and individual pages.

2. Page Views

The number of page views a web page gets from visitors. 

3. Impressions

The number of times an ad or web page is displayed to an individual.

4. Sessions

A group of actions an individual website visitor takes while on a website during a specific amount of time. 

5. Bounce Rate

The percentage of visitors who come to your website but don’t convert in any way — rather, they leave, or bounce, from your site before taking action. 

6. Search Engine Optimization (SEO)

Keyword and search engine results page (SERP) success and performance. 

7. Engagement

The number of interactions that your visitors have with your content (e.g. comments, shares, likes, forwards, subscriptions) and how long engagement lasts across those channels and web pages. 

8. Social Media Engagement and Interactions

Depending on your social media platforms, there will be specific metrics related to engagement and interactions on a post and/or piece of content that you can analyze (views, shares, comments, likes, etc). 

9. Lead Generation and Conversions

The number of acquired leads, conversions, and sales that result from your content (e.g. email sign ups, blog subscriptions, CTA clicks, downloads, product purchase.)

11. Brand Awareness

The way your target audience learns about your brand and becomes aware of your products, mission, and what it is you do.

This can mean taking a look at other metrics on this list such as page views, social media engagement (or simply using the process of social listening), downloads, video views, referrals, and resource/ document reads or shares. 

12. Customer Loyalty

The amount of content that your current customers consume and/or engage with (e.g. if a current customer is a blog subscriber who receives articles in their email inbox weekly). 

13. Upsell/ Cross-sell

Sales for new, additional, or upgraded products that you offer. 

Apply Content Marketing Analytics to Grow Better

Content marketing analytics tools have the power to help your team understand the health of your strategy, audience behaviors and interactions, progress to goal, and more.

As a result, you’ll have the information you need to improve the customer experience, resonate with your audience through your content, and increase conversions.

Editor’s note: This post was originally published in June 2020 and has been updated for comprehensiveness.

Free Resource: How to Reach & Engage Your Audience on Facebook

Categories B2B

How to Make an Ad: A 15-Step Guide

Advertising is changing — in 2021, companies are on track to spend more than $450 billion dollars on digital advertising.

The challenge? Massive variety in the digital advertising market — from differing platforms and ad types to target audiences — can frustrate efforts to capture customer interest and drive ROI.

Download Now: Free Ad Campaign Planning Kit

How do you choose the right medium to promote your platform? What metrics matter? And once you decide, how do you actually make the ad?

Our comprehensive ad-making guide has you covered. Let’s go.

Featured Resource: Advertising Planning Templates & Kit

To make your advertising planning easier, use HubSpot’s free Advertising Planning Kit. Included are templates to help you plan and present your ad pitch, schedule your release dates, and inform your stakeholders. We’ve also thrown in an advertising best practices guide to help you choose the advertising method that works best for your business.

1. Choose Your Target Audience

When making an ad, you’ll first need to decide the audience you’re making the ad for. Target the right market and you’ll find customers naturally inclined to engage with your brand and product. Cast too wide a net and you may find yourself lost in the digital noise.

One way to help your ad find the right audience is to get granular on whom you want to target with your messaging, which will help you incorporate the best messaging and select the best advertising platform. This should be based off of your buyer personas — semi-fictional representations of your ideal customer based on market research and real data about your existing customers.

If you need help building your personas, try using HubSpot’s Make My Persona tool.

2. Conduct Marketing Research

Market research is an essential part of campaign promotion. Feeding into your buyer personas, market research can answer key questions about your target market, such as:

  • How old are they?
  • What do they spend most of their time doing?
  • What social media platforms do they use, if any?
  • Do they live in suburban, urban, or rural areas?

Knowing the above information about your target audience can help you answer questions like — TV or YouTube? Instagram or LinkedIn? Billboard or bus? — because you’ll understand more about how to appeal to the right people.

You can use this Market Research Guide and Set of Templates to get started on market research for your ad.

3. Choose Your Platform

Your market research should give you the insight and confidence you need to choose the most effective platform to reach your target audience. You should also do some supplemental research on the costs, ROI, and benefits of certain ad platforms and methods.

You may come to the realization that using multiple ad platforms and methods would be the right move for your campaign – such as social media and search engine ads. This is actually a great strategy, as it casts a wider net and opens up the possibility of reaching even more prospects where they already are.

4. Decide on a Budget

For advertising, you need to spend money to make money.

Getting your budget approved can be difficult, so make it easier to get what you need by clearly outlining:

  • The total budget you need
  • How the costs are broken down
  • A projected ROI (or business impact)

Be sure to come to any budget meeting prepared to answer whatever questions could be thrown at you and to defend the specifics.

For instance, saying “We need $10,000 to run a Google Ads campaign” doesn’t sound nearly as compelling as “We’d like to run a series of ads on Google. Here’s a list of our keywords and negative keywords, their monthly search volume, and our preliminary bids for each. With these projections, we’re expecting to bring in 400 new contacts next month for a total cost of $10,000.”

5. Craft a Message

By this point, you know your target audience and your preferred platform, but you’re still not sure what you’re saying. Here’s where you’ll want to think about the broad purpose of your campaign to inspire your ad.

Do you want people to come to your store, or visit your website? Is your immediate goal to drive free signups for your software, or ebook downloads? Think about the message and how that can feed into the end goal(s) of your ad campaign.

6. Get People Talking

While your message needs to include your brand purpose and tie in with long-term marketing goals, it also needs to be something people remember.

Here’s why: As more advertising shifts to social media sites such as Facebook, Instagram and even Twitter, brand marketing needs to get to the point ASAP to drive customer interest and social sharing. If your message — whether it’s text, images, or videos — can make users stop, look and share with their connections, you’ve got a much better chance of creating organic interaction and driving more traffic to your site.

7. Decide What You’re Building

Ads can build brand awareness and product awareness — but not simultaneously. As a result, it’s worth taking the time to think about your advertising goals for new marketing campaigns.

For example, if brand awareness is the goal, you may want to consider a set of ads that tell a story or help customers learn more about what makes your brand unique. Here, the goal is to engage with customers over a longer period of time to help them engage with your brand from the first time they see your ad to eventual conversion. Ideally, your brand story will help create a long-term, reciprocal customer relationship.

Product awareness ads, meanwhile, are designed to highlight new products or services, call out seasonal specials or help drive specific action from customers. They’re often one-off or a short series of ads that run over a small period of time.

8. Include a CTA

While building awareness is critical for ads to be effective, it’s not enough in isolation.

That’s why all your ads also need a call-to-action (CTA) that provides information for consumers on what to do next. In some cases — such as an ad on your webpage — the CTA may be simple and direct, such as “sign up for our newsletter” or “click here to buy now.”

If you’re advertising on social sites, meanwhile, reaching for an immediate sale or asking for user contact data may actually drive customers away. Here, your CTA needs to be more subtle but no less clear. For example, you might opt for “click here to learn more” or “explore what we have to offer.” In practice, the goal is to avoid presuming what users want — instead, your CTA provides a path to more information if they’re interested. And if you’ve crafted a great ad, they will be.

9. Don’t Forget the Details

They’re small things — the smallest, in some cases — but can have significant impacts for your ad campaign: The details.

Consider an advertisement for a concert or event that your company is hosting. You’ve done the work: Identified the right market, crafted a great message, and created a CTA that will drive customer action.

But…

You’ve forgotten the details. Your ad doesn’t mention where or when the event is happening. Sure, customers could click through and see the specifics on your website, but there’s no guarantee they’ll take this step. Put simply, when it comes to creating a great ad, you have to account for the forest and the trees: You need big-picture advertisements that are visually compelling, content-rich and engaging, but it’s just as critical to double-check that you’re not missing the details.

10. Create Test Ads

Before launching your ad campaign, it’s worth trying your hand at making an advertisement for your brand. Here’s why: Not all ad designs look as great on the screen as they do in your head. By creating basic mock-ups, you can see what works, what doesn’t, and what needs to improve.

One of the most popular options for simple ad creation is Adobe Photoshop. Not sure where to start? Here’s a quick look at how to make an ad in Photoshop.

How to Make an Ad on Photoshop

Let’s say you want to create a Facebook ad on Photoshop. Follow these steps:

  • Create a new document in Photoshop.

how to make an ad on photoshop

Open Photoshop, select “File,” and then click “New” from the drop-down menu. You’ll see the screen above. Here, you can select the size of your new ad, along with the color profile you want to use.

  • Insert your image.

Next, you’ll want to insert an image to work with. Simply drag-and-drop the image of your choice into the Photoshop workspace and you’re ready to go.

  • Add some text.

how to make an ad on photoshop: add text

Next, add some text to your image by selecting the “T” button in the bottom left-hand corner. You can choose vertical or horizontal text, depending on what works best for your image.

  • Add a CTA.

Once you’re happy with your text placement, consider adding a CTA. Select one of the shape tools from the left-hand side menu and insert that into your image. Resize as needed, then head back to the text tool and insert your CTA.

  • Consider the 20% rule.

Facebook used to have a hard-and-fast 20% rule that stated no more than 20% of your image could contain text. While this is now a strong suggestion rather than an absolute rule, it’s worth keeping your text to a minimum since Facebook rates ads based on their text volume — the more text you have, the lower your chances of getting seen.

  • Save your file.

Finally, save your new ad. Head to “File”, then “Save As,” and then “Format.” It’s worth saving it as both a Photoshop document (.psd) and a .png file, which makes uploading to Facebook easier.

11. Develop Creative Assets

Whether it’s copy for a Google Ad or a flashy landing page from your in-house designers, all ads need creative assets. Chances are, most of the ads you run will need one or more of the following:

  • Short, promotional copy (for image ads and online ads)
  • Long-form copy (for video scripts)
  • Photographs (for online ads)
  • Custom-designed images and/or animations (for online ads and video ads)
  • Video (for…video ads)
  • GIFs (for online ads)

All of these assets can be overwhelming, and if you’re thinking “I’m not a videographer/writer/designer/photographer!”, that’s totally fine. If these resources aren’t available to you in-house to help make your ad, consider hiring a team of freelancers or an agency to help you produce these deliverables and make an outstanding advertisement, or use an online marketing design tool like Canva to help streamline the process.

12. Determine Measurements of Success and Set Up Tracking

No matter if your ultimate goal is Page Likes, online purchases, or promo code uses, you should never launch an ad without first being crystal clear on two questions:

  • What do we want to see in order to call this ad successful?
  • How are we measuring success?

You already thought of your advertisement’s goal in Step 7, so now, make the expectations of your campaign known by setting up the proper ad tracking.

If you’re advertising online, there’s a good chance the platform you’re using — like Facebook, Google, or LinkedIn — has an ad management and tracking platform, allowing you to see how many interactions your ads have had and how much they cost.

However, you’ll also want to take a few extra steps to aid in your analysis down the line:

  • Use an automated free ad tracking platform to measure advertising ROI and see how your ads tie into larger marketing projects and campaigns. You can also use this platform to compare ads from different sites; say, if you were running ads on both Instagram and Twitter.
  • Set up a custom tracking spreadsheet offline to measure engagements with your ad and other data points like cost, conversion, and advertising ROI, especially if your ad is online.
  • Use custom tracking tokens for links promoted in your ad so that you can analyze engagement and conversions on your own website.

13. Launch Your Ad

The stage is set, and you can finally launch your ad for the world to see.

Needless to say, the process of launching an ad on Google is different than on Bing. The same can be said for every social media channel, TV ads, or transportation ads.

Here’s a list of the more detailed, step-by-step process for launching an ad on some of these platforms. Click through to learn more about the platform or platforms that you’re creating an ad for:

14. Track & Analyze Performance

For campaigns that have a set run time (transportation, television, etc.), determine how the ad’s results performed against expectations. Since it’s difficult to draw a one-to-one comparison for these ad types, you may want to look at general business trends, change in revenue, or even social media/press mentions to gauge success.

For online ads, this process is a bit easier. Results start coming in immediately, so you can see how well your ads are performing instantly, and over time. Take note of the ads that are bringing in high numbers at low costs and — just as importantly — ads that are costing a lot but not performing that well.

Remember, you can take the headache out of the manual ad tracking with a free online ads tracking tool.

15. Make Changes, Rinse, and Repeat

Once your ad campaign is over (or if it’s an ongoing online campaign), take your learnings and apply them to your next advertisement.

For instance, maybe you realized your online ads that were wordier performed worse than ads that were more concise, or that YouTube just didn’t work this time around. Lean into what worked (or is working) and abandon what’s not to continue to strengthen your company’s advertising program.

It All Ads Up

And there you have it — our comprehensive guide to planning, creating, launching, and analyzing your new ad.

Looking to streamline the process? Use an advertising planning template to outline your ad campaign, keep all contributors informed, and rally behind the same end goal for your business.

Editor’s note: This post was originally published in October 2019 and has been updated for comprehensiveness.

advertising plan