Internet use is still increasing worldwide every day — in fact, over 4.95 billion people around the world use the internet, as of 2022.
Marketing is, and always has been, about reaching customers where they are. TV commercials, print advertisements, and billboards all attempt to do just that.
The internet offers unique benefits other marketing mediums can’t offer — scope of reach, the option to personalize content, and the opportunity to build far-reaching relationships with customers, being just a few.

But the internet can be an overwhelming and all-encompassing entity, filled with videos and recipes and news articles and e-commerce sites. In the crowded space of the internet, how are you supposed to differentiate your business to reach the right audience?
The answer is internet marketing.
Internet marketing leverages digital channels, including email, social media, websites, and search engines, to reach your ideal audience.
Unlike more traditional advertising mediums, such as print, the internet encourages two-way conversations between your business and your customer, ideally creating better long-term customer retention.
There’s no avoiding it: internet marketing is critical for the success of your business in 2022 and beyond.
But with all the gimmicks and tricks, it can be difficult to distinguish short-term wins from effective long-term strategies, which is why we’ve created an ultimate guide.
Here, we’ll cover everything from marketing strategies to real-world examples, to ensure your business reaches the right people out of that four billion.
What is Internet/Online Marketing?
Online marketing, also known as internet marketing or web advertising, is a form of marketing that uses the internet to deliver promotional messages to customers through digital channels such as search engines, email, websites, and social media.
Online marketing strategies include web design, SEO, email, social media, PPC, and other internet-related methods.
What’s the role of internet marketing?
Simply put, the role of internet marketing is to help your business reach, attract, and convert online audiences.
Let’s dive into two separate goals you’ll have with internet marketing, as well as the necessary methods you’ll want to take to achieve those goals.
Internet Marketing to Attract New Customers
You can use online marketing strategies to attract new customers. To do this, you’ll want to focus primarily on paid social media ads, search engines, and web design.
For instance, you might use Facebook’s Lookalike Audiences to get your message in front of an audience similar to your core demographic. Or, you could pay a social media influencer to share images of your products to her already well-established community.
Paid social media can attract new customers to your brand or product, but you’ll want to conduct market research and A/B testing before investing too much in one social media channel.
To attract new customers, you also need to maintain a powerful SEO presence. With 81% of shoppers using the internet for research before making purchasing decisions, it’s imperative your business is at the forefront of search for related keywords.
Having a strong SEO presence also translates to more in-store purchases, as well — in fact, 78% of local mobile searches result in an offline purchase.
Finally, it’s critical you spend time and resources on your business’s website design.
When these aforementioned customers find your website, they’ll likely feel deterred from trusting your brand and purchasing your product if they find your site confusing or unhelpful. For this reason, it’s important you take the time to create a user-friendly (and mobile-friendly) website.
Internet Marketing to Cultivate Brand Loyalists
Internet marketing is for more than just attracting new customers — it’s also critical for maintaining a loyal, long-term customer base.
You’ll want to use email, blogging, and social media tactics to increase brand awareness, cultivate a strong online community, and retain customer loyalty.
Consider sending personalized emails to past customers to impress or inspire them — for instance, you might send discounts based off what they’ve previously purchased, wish them a happy birthday, or remind them of upcoming events.
To properly employ email campaigns, you’ll need an email list. Here’s how to build an email list from scratch.
Additionally, you might use social media to showcase your brand’s personality and hear directly from your customers. Consider hosting a Twitter chat, posting surveys on Instagram, or creating fun contests on Facebook.
If you don’t feel like you have the bandwidth to create all social media content internally, consider using a third-party service like UpContent, which sends you compelling, curated content that you can share with your audiences for increased engagement.
Internet Marketing vs. Content Marketing
Content marketing and internet marketing are incredibly similar strategies used to attract leads and prospects to your site, and ultimately convert web traffic into customers. However, there are a few slight differences between the two.
Content marketing lives under the roof of online/internet marketing — which means online/internet marketing is the more broad, overarching strategy, and content marketing is one process within that strategy.
Content marketing applies only to the process of creating and distributing content to reach audiences.
Online marketing, on the other hand, encompasses sharing that content through email, search engines, and social media — it also includes paid advertising, retargeting, and a wide range of strategies you might use to reach audiences online.
While most of the strategies that fall under online marketing have to do with content creation, online marketing also pertains to the non-content creation tasks of internet marketing: such as PPC bidding, or website design.
We surveyed 1,067 global marketing professionals working in B2B and B2C companies to find out which trends they leverage, the channels they use, and the challenges they face, as well as their plans and expectations going into 2022.
Based on our research, there are 16 strategies you’ll want to employ to ensure you’re successful at internet marketing.
-
Keep TikTok in mind.
Without question, TikTok’s popularity soared as the pandemic kept many people at home and in need of connection and entertainment. And that popularity isn’t expected to wane anytime soon.
While LinkedIn, Facebook, and Instagram have the highest ROI for B2B businesses, TikTok is quickly becoming the app to invest in.
Through our research, we found that while just 40% of B2B social media marketers leverage TikTok, 65% of those who do plan on increasing their investment in 2022, the highest increase of any social platform.
2. Consider podcasts and audio chat rooms to make connections.
Podcasts are gaining more attention as influencers, celebrities, and comedians continue to step into the medium. Despite low ROI, investment in podcasts or other audio content is expected to grow in 2022.
Our research shows that just 14% of social media marketers leverage audio chat rooms like Clubhouse and Twitter Spaces, but 68% of those who do say they are the most effective social media marketing platforms they leverage.
51% of those who already leverage podcasts or other audio content will invest more in 2022, and 43% plan to continue investing the same amount. Additionally, 26% of content marketers plan to leverage podcasts or other audio content for the first time in 2022.
Essentially, if you’re not leveraging podcasts and audio chats in your marketing strategy, your competition most likely will.
3. Lean into short-form video content.
With the enduring popularity of TikTok, audiences are gravitating more and more toward short-form videos. Short-form videos continue to be the norm as Instagram and YouTube push similar short-form video features such as Reels and Shorts, respectively.
We’ve found 31% of marketers are currently leveraging short-form video and 29% plan to leverage it for the first time in 2022. In this survey, we specified short-form videos like TikTok and Instagram Reels. Yet another reason to keep an eye on TikTok.
4. Repurpose content across various channels.
Repurposing content means re-using your existing content and presenting it in a fresh format that extends its lifespan and audience reach.
Our survey found that 32% of marketers who repurpose content say this method is among their most effective marketing strategies. Examples of repurposing content include:
- Sharing old blog posts you’ve updated with new information, fresh data, and video content (Hint: The piece you’re currently reading is an update).
- Using video clips of podcast recordings sessions on Instagram to create intrigue and excitement over an upcoming episode.
If you’d like to learn more about repurposing content, here are 20 methods you should know about.
5. Invest in Permanent Social Media Content.
Permanent social media content is content that won’t disappear after a set amount of time, unlike Instagram Stories or SnapChat photos and videos.
We found 33% of marketers are currently leveraging permanent social media content. Our surveys also showed 85% of marketers plan to continue investing the same amount or increase their investment in permanent social media content.
6. Design a user-friendly website.
First, you want to create a user-friendly, and mobile-friendly, website. The design of your site will showcase your brand’s personality and differentiate your business from every other online business. But it’s more than just looking good — a cleaner, more well-organized site structure can affect how you rank in the SERPS.
For help designing your website or ensuring it’s up-to-par, check out 8 Guidelines for Exceptional Web Design, Usability, and User Experience.
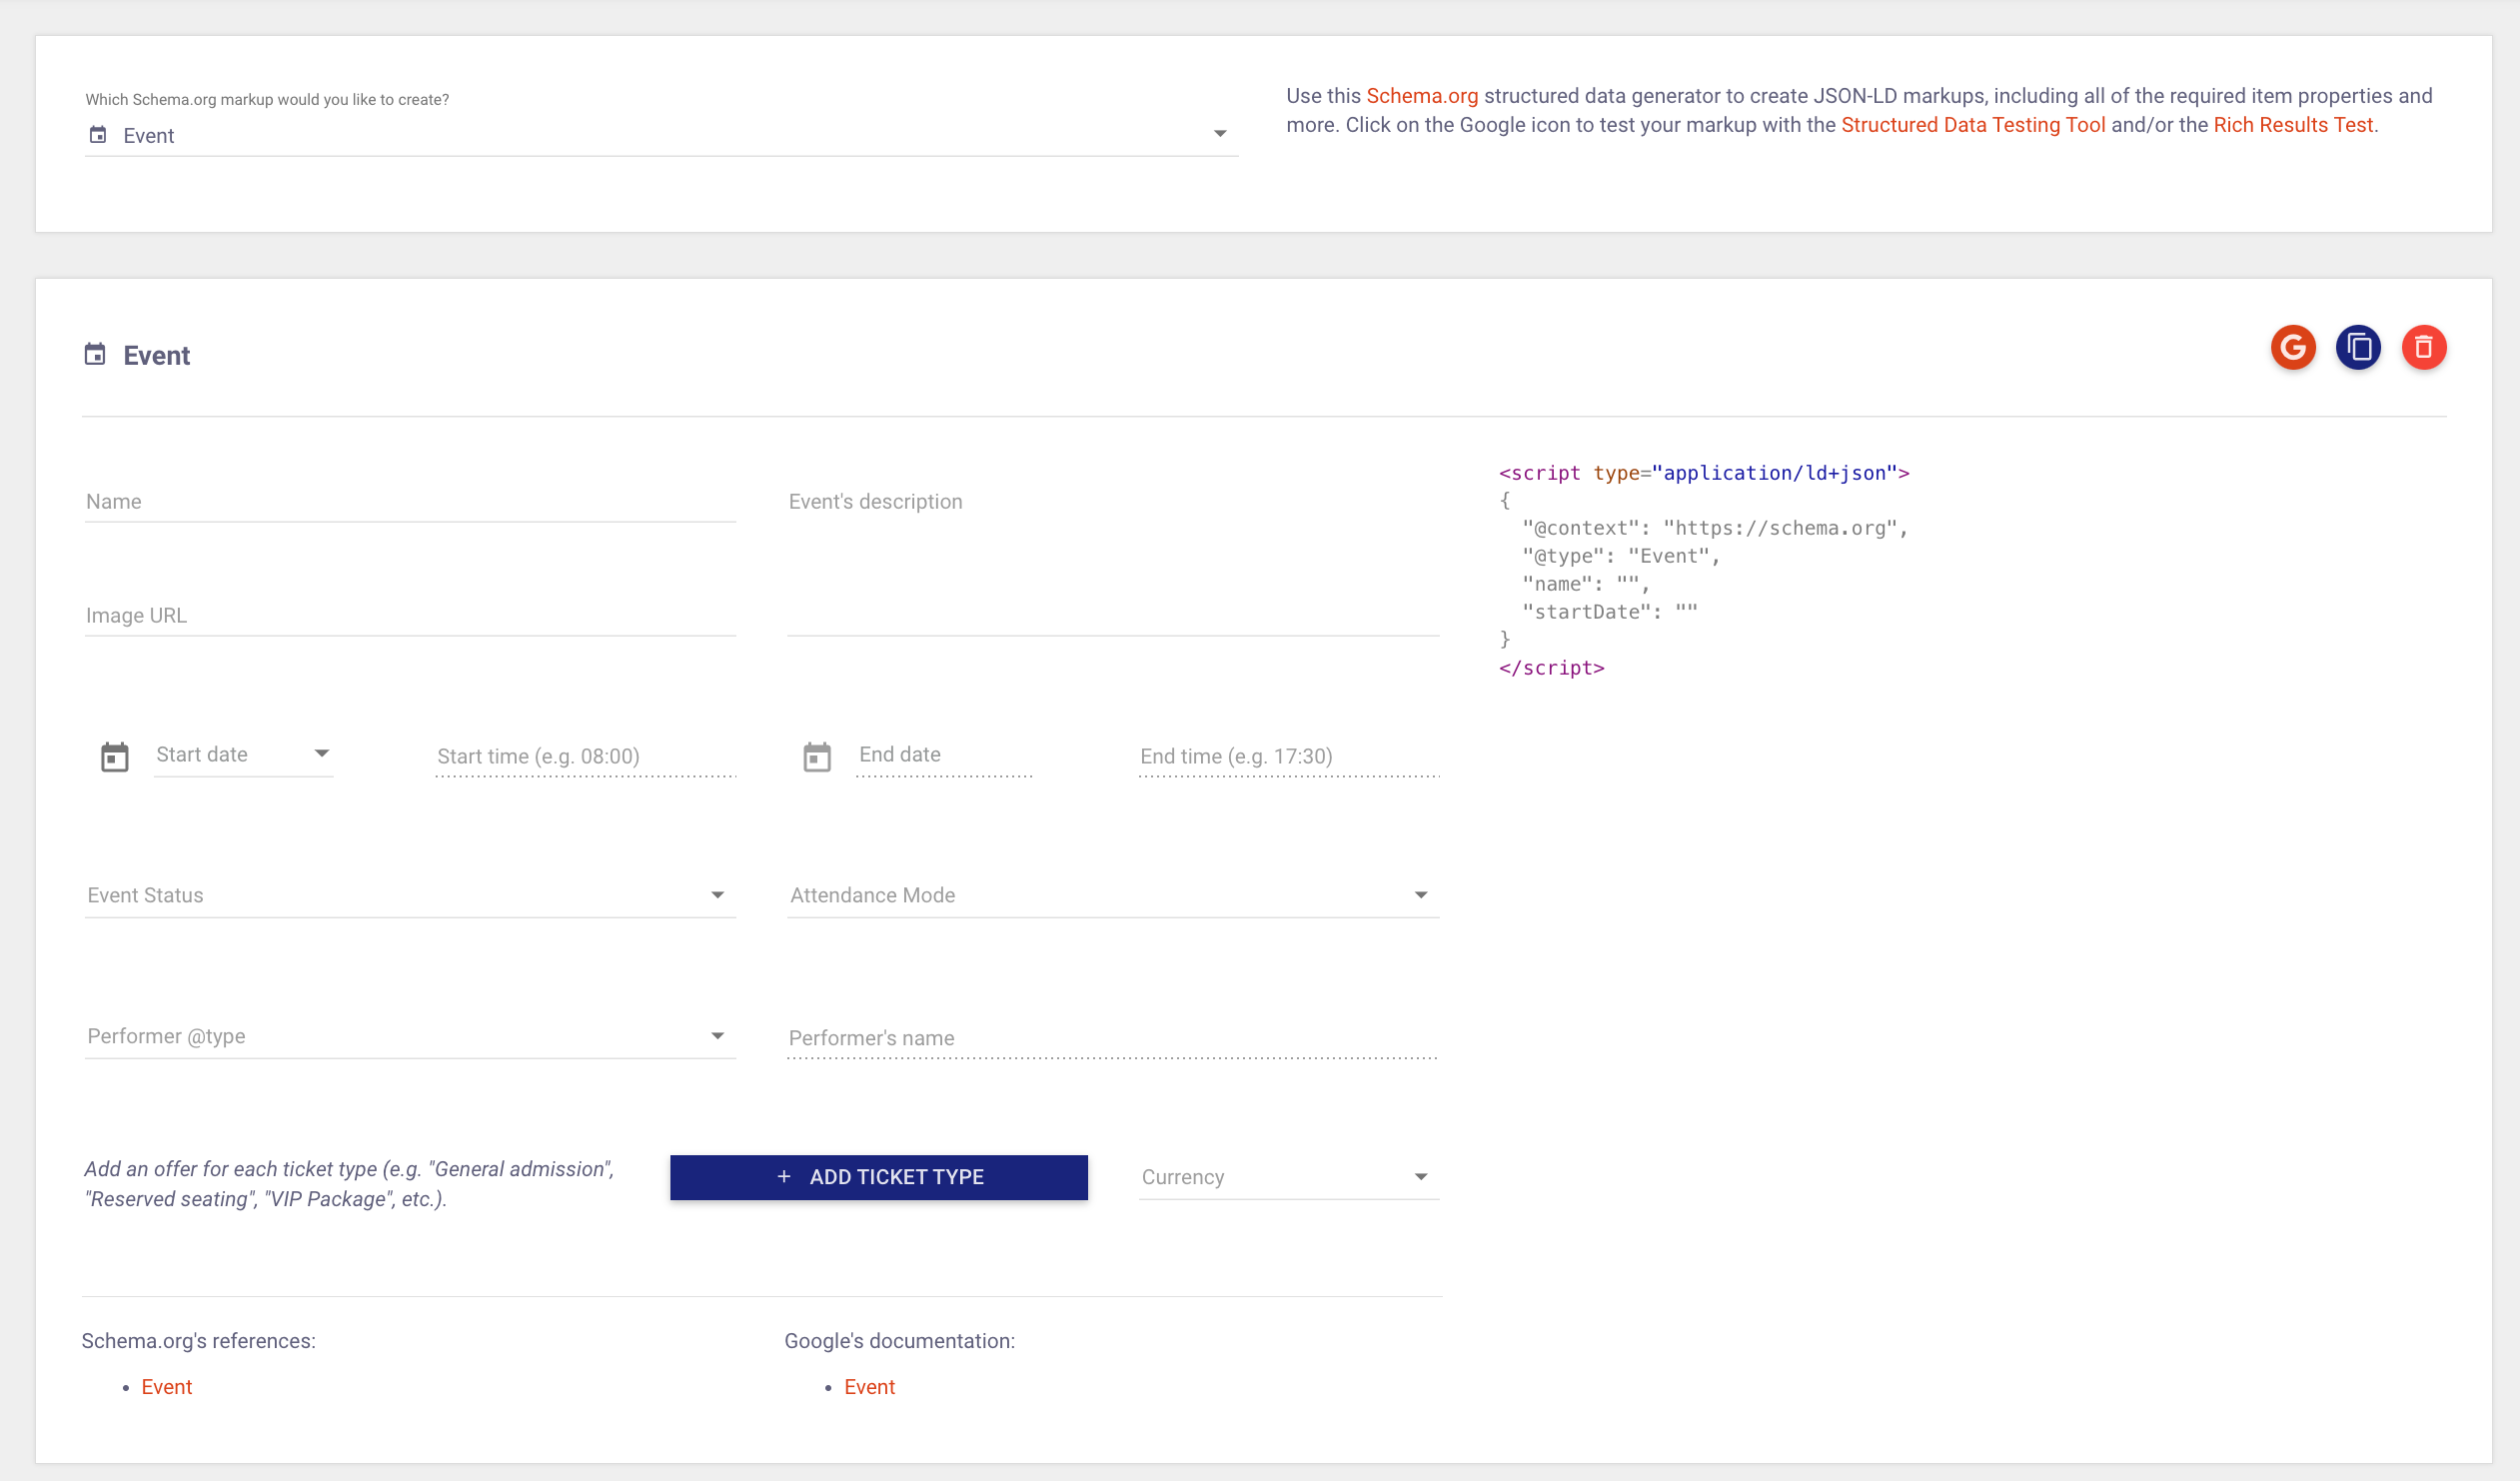
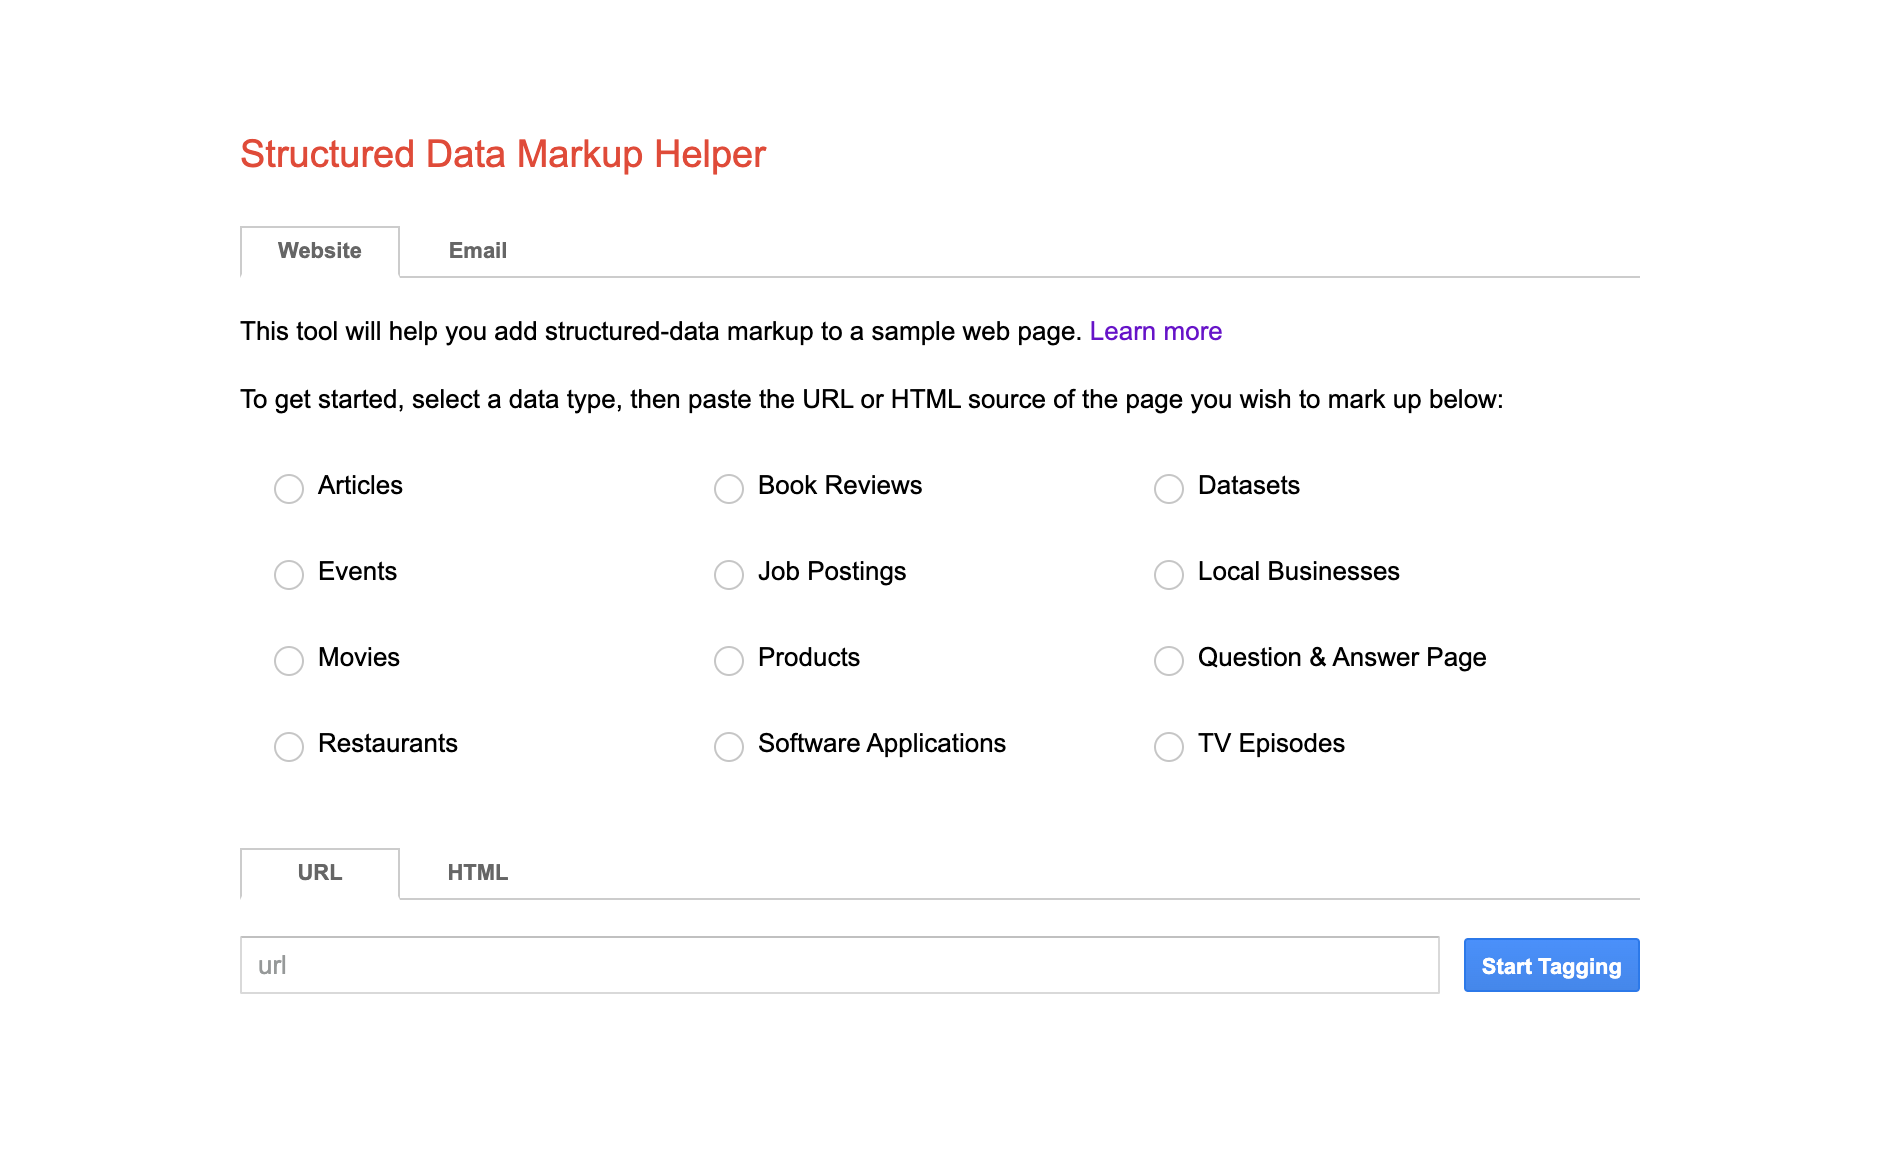
7. Optimize your site for search engines.
Next, you’ll need to keyword optimize your site for search engines. Essentially, this means you’ll choose keyword(s) that relate to your business, and incorporate those keywords into the URL, body text, image text, headers, and navigation bar.
For tips on keyword optimizing your entire site, check out On-Page SEO 101: Tips for Keyword Optimizing the Most Critical Parts of Your Website.
If you’re interested in focusing on keyword optimizing your blog posts, consider reading Blog SEO: How to Search Engine Optimize Your Blog Content.
For a real-life example on how to successfully implement SEO into your digital marketing strategy, check out our case study on Canva here:
8. Use email marketing or opt-in email campaigns.
Email marketing and opt-in marketing campaigns are one of the most effective long-term strategies to connect with potential customers and cultivate brand loyalty.
For everything from getting started with email marketing, to email marketing best practices and lead magnets, check out The Ultimate Guide to Email Marketing.
9. Write online press releases.
Writing online press releases is an additional way to increase online coverage of your business from other sources, which will also positively affect your ranking in the SERPs. Plus, if a local news outlet covers your business, you’ll receive their audience, which you otherwise might not have reached.
To get started writing a press release for your business, consider How to Write a Press Release [Free Press Release Template + Example].
10. Create a blog.
I might be biased, but blogging is one of the best ways to attract a large audience to your site, establish your business as a thought leader in your industry, and prove your brand to be both useful and current.
Writing blog posts is especially effective for providing different opportunities to land on page one of search engines — for instance, maybe your eyeglass store’s website is on page three of Google for “eyeglasses,” but your “Best Sunglasses of 2018” blog post is on page one, pulling in an impressive amount of traffic (over time, that blog post could also boost your overall website to page one).
To learn everything from choosing a domain name to writing your first blog post, check out How to Start a Blog: A Step-by-Step Guide [+ Free Blog Post Templates].
11. Develop social media contests and campaigns.
Social media contests and campaigns are exceptional opportunities to engage with your online audience, form relationships with customers, and learn about your buyer’s persona.
For an overarching compilation on everything you need to know about social media campaigns — from how to craft perfect posts on Facebook to the most shared phrases on LinkedIn — take a look at Everything You Need to Know about Social Media Campaigns.
12. Leverage pay-per-click advertising.
Pay-per-click advertising, or PPC, is an advertising model in which advertisers only pay when someone interacts with their ad through impressions or clicks.
PPC is most commonly used on search engines, and can help your business appear for searches related to your products or services. This is particularly important for more competitive keywords, when it’s difficult to rank on page one against websites with higher domain authority.
It’s important to note — PPC doesn’t replace your SEO strategy, it simply complements it. For instance, if you’re trying to rank for “website builder”, you’ll see the keyword difficulty is “super hard (95)”, according to Ahrefs. However, there are some long-form keywords you might have success ranking for, including “what is a website builder? (52)” or “best website builders for ecommerce (57)”.
If you do want to target “website builders”, you’ll want to bid for an ad and use PPC to stand out against competitors.
13. Optimize your site for conversions.
Okay, you got readers to your blog or homepage … now what?
Ultimately, you’ll want to invest in resources for conversion rate optimization (CRO). If you don’t, you risk not being able to convert any of your traffic into qualified leads and, ultimately, customers.
There are four areas of your website that can benefit from CRO. These include the homepage, pricing page, blog, and landing pages.
Within a blog, a CRO strategy might include adding relevant calls-to-action throughout the text, or inviting readers to submit their emails in exchange for an ebook. On a pricing page, a CRO strategy might include a slide-out that invites viewers to book time with a sales rep or watch a demo.
Optimizing your site for conversions is a critical component of any strong internet marketing strategy.
14. Post videos on YouTube or other social networks.
Video marketing is an undeniably powerful opportunity to reach new audiences and convert leads into customers. In fact, 86% of video marketers say video has helped them generate leads, and 88% of people say that they’ve been convinced to buy a product or service by watching a brand’s video.
Convinced yet? If not, simply consider the fact that YouTube is used by 88% of video marketers — which means, even if you’re not posting videos on the channel, your competitors most likely are.
You’ll want to diversify the type(s) of content you produce to attract audiences who prefer video over text, or YouTube over Twitter.
Consider how you might implement your own video strategy to reach and convert new audiences. If you’re not sure where to start, check out HubSpot’s Ultimate Guide to YouTube Marketing.
15. Find influencers to work with your brand.
I’m currently wearing a watch I found on Amazon. I’m sitting on a couch from Wayfair, with a candle from Anthropology on the table in front of me.
Where did I hear about all these products? Influencers.
Social media influencers have cultivated strong, meaningful relationships with their followers. Their followers typically trust them to provide true, reliable guidance on a range of topics related to the influencers’ expertise. Which is why influencer marketing can be an effective opportunity to spread brand awareness to new audiences.
If you think influencer marketing could be a good choice for your business, consider micro-influencers as a more effective (and oftentimes more cost-efficient) option. Micro-influencers often experience higher engagement rates than mega-influencers, and we predict micro-influencers will likely have more influence than celebrities in 2022.
Additionally, it can be expensive and time-consuming to find the right influencer(s) for your brand. If you’re going to invest in the strategy, consider working with the same few influencers for the long-term — which enables your company to build stronger relationships with their social followers.
16. Create a Facebook group.
A Facebook group — unlike a Facebook page — is an exclusive, private group that enables you to facilitate a sense of community surrounding your brand.
A Facebook group isn’t a necessity for every business, but when done properly, it can go a long way towards creating a stronger relationship between you and your customers. Best of all, it can help foster connections between your customers.
Since having a strong community can help you build brand loyalty, it’s important to seek out unique opportunities to engage directly with your customers. If a Facebook group doesn’t seem like a good fit for your business, however, there are other ways to create a sense of community — including via social media, or through a branded newsletter.
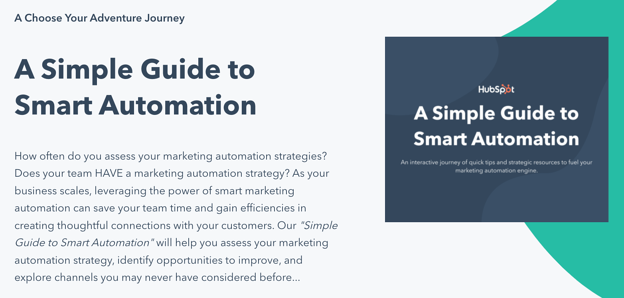
Finally, take a look at our Essential Step-by-Step Guide to Internet Marketing to dive deeper into the six essential steps of internet marketing.
There are many different methods to online marketing you can try to boost engagement for your brand, such as:
1. Repurpose your high-quality content across multiple channels.
Like we said earlier, repurposing your content simply means reusing content you already have but in a fresh format. That reaction video you created on TikTok could be repurposed as a Reel on Instagram. If you change the caption on Reels, you can use the video to react to something else.
2. Lean into permanent social media content that doesn’t have a time limit.
Examples of permanent social media content include tweets, YouTube videos, and TikTok videos. Content such as Snapchat videos or Instagram stories are note permanent and disappear after a period of time.
3. Choose the right keywords and optimize your site for search.
Using keywords helps search engines, especially Google, categorize your content and ensure it reaches the right audience. It also helps your target audience find your website and services. To optimize your site with the right keywords, use applications like Ahrefs that are designed to help you find the right keywords your audience is searching for.
4. Create a mobile-optimized site.
There are many ways to better optimize your website for mobile users, such as compressing images to reduce page load time, mapping your customers’ journey, or creating a mobile app.
5. Publish blog posts regularly.
Blogging consistently has many benefits. It keeps your website up to date with fresh content, maintaining the interest of your audience. It’s also an effective way to get your website to pop up on the first page of search engines. The more you post, the more content you’ll have for the search engine to rank.
6. Conduct email marketing campaigns.
In our recent survey to predict 2022 marketing trends, we found that email marketing is still a helpful approach to marketing your business online. According to our survey, the three most effective email marketing strategies are subscriber segmentation, message personalization, and email automation campaigns.
7. Encourage conversation on social media accounts.
Social media is the place where connections are made and conversations happen. Social media users don’t want to just interact with brands, they want to see the humanity behind the big name and logo.
A great way to create meaningful connections with the humans that make up your audience is to facilitate conversations. Ways to do this include conducting social media polls or hosting Spaces on Twitter.
8. Publish online press releases.
Like blogging, publishing online press releases will increase your presence on search engines and raise awareness of your brand. When writing press releases, remember to answer the “who,” “what,” “where,” and “why” of your brand. And make sure to use simple, understandable language as well as a quote.
9. Cultivate paid social media campaigns.
The idea of paying for advertising may seem a bit daunting, but paid social media advertising is one of the least expensive types of advertising. Paid social media ads can start as low as one dollar thanks to the bidding model and lottery system some platforms use to push ads to users’ news feeds and timelines.
Platforms that allow for paid advertisements are:
10. Leverage pay-per-click advertising for competitive keywords.
Pay-per-click advertising (PPC) and SEO go hand-in-hand like peanut butter and jelly. Optimizing your website for keywords can definitely help your brand appear at the top of search engine results pages. However, it requires patience, and you may not see results for weeks or months if you’re optimizing for highly competitive words.
But by leveraging PPC, you’ll be able to stand out among competitors by bidding for an ad.
11. Post videos on YouTube or other social channels.
YouTube is the second largest search engine on the internet, and 81% of Americans used YouTube in 2021. So, you can bet your audience frequently visits the site. When creating content for YouTube, be sure to diversify your content in order to attract audiences who prefer video over text. You’ll also want to research keywords you can optimize your content for and use in your video’s title, description, and tags.
12. Work with micro-influencers to reach new audiences.
On apps like TikTok, brands are still struggling to find their place. However, influencer marketing has proven to be a helpful tool in helping brands elevate their online presence and find their target audience.
In our survey, we found that 57% of influencer marketers cited influencer marketing as one of the most effective trends they leverage. We also found that 86% of marketers plan to continue investing the same amount or increase their investment in influencer marketing.
Online Marketing Examples
There are hundreds, if not thousands, of online marketing examples to inspire your next internet marketing campaign.
Here, I’ll dive into five real world examples of social media, email, SEO, and website marketing methods. I’ll also include links to additional blog resources at the bottom, for even more exceptional ideas.
1. Social Media: HubSpot’s “Set Sail With HubSpot CRM” Campaign with Kathryn Hahn
In 2022 we kicked off our “Set Sail” campaign with award-winning actress and comedian Kathryn Hahn. In the campaign, Hahn plays a pirate using HubSpot’s CRM to expand her reach across the seven seas.
“As CEO of my own pirate enterprise, I chose HubSpot as our CRM platform,” Hahn says as she tours a busy office-like pirate ship. “Because it helps us treat customers like people, not conquests. Plus it enables my teams to work together seamlessly as we expand.”
Hahn’s comedic timing and stage presence helped highlight the many tools we provide to help businesses achieve their goals, but our approach to social media is what helped the campaign be a success.
Our first social post announcing the campaign was promoting Kathryn Hahn’s Fast company cover, we positioned her as our newest ambassador and let her be the hero of the story—not us to start,” said Hubspot’s Senior Social Strategy Manager Leslie Green. “The positioning of her success as our success leans into our humble voice and tone.”
When it came to Instagram, there was a particular feature on the app that played a key role in spreading our message on the platform.
“We utilized a collab post feature on Instagram which allowed this post to be delivered to both ours (and Fast Company’s) followers,” Green said. “The reach and engagement on this announcement was incredible for this reason. Across channels, we shared our 30 second spot to showcase how Kathryn was making waves as a disrupting Pirate CEO.”
When promoting the campaign on Twitter, Green said it was important to engage and interact to build intrigue.
“On Twitter, along with sharing campaign assets in clever & social-first ways, we made sure to highlight and retweet notable media mentions from publications like Entertainment Weekly to drum up excitement about this partnership and give our audience social proof,” Green said.&
She continued, “In order to encourage our audience to feel included in our fantastical founder’s journey and be inspired to share their own, we repurposed UGC to go with CTAs for the audience to share their own #HubSpotSuccessStory on Instagram and LinkedIn.”
2. Social Media: Under Armour’s “I Will What I Want” Campaign
Under Armour came up with the hashtag “I Will What I Want” to encourage powerful athletic women to achieve their dreams despite any opposition they might face. The hashtag, first used by American Ballet Theatre ballerina soloist Misty Copeland, blew up on Facebook after supermodel Gisele Bündchen used it in one of her Facebook posts. Many other female athletes have also used the hashtag.
The campaign spreads a positive message of female empowerment, while also highlighting Under Armour’s women apparel. The campaign reached five billion media impressions, increased Under Armour’s women’s sales by 28 percent, and pulled in an additional 42 percent of traffic to their website.

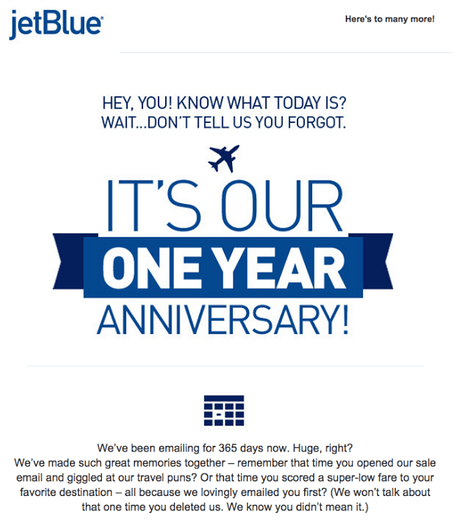
3. Email: JetBlue
Companies often use email marketing to re-engage past customers, but a “Where’d You Go? Want To Buy This?,” message can come across as aggressive, and you want to be careful with your wording to cultivate a long-term email subscriber.
This is why JetBlue’s one-year re-engagement email works so well — it uses humor to convey a sense of friendliness and fun, while simultaneously reminding an old email subscriber they might want to check out some of JetBlue’s new flight deals.
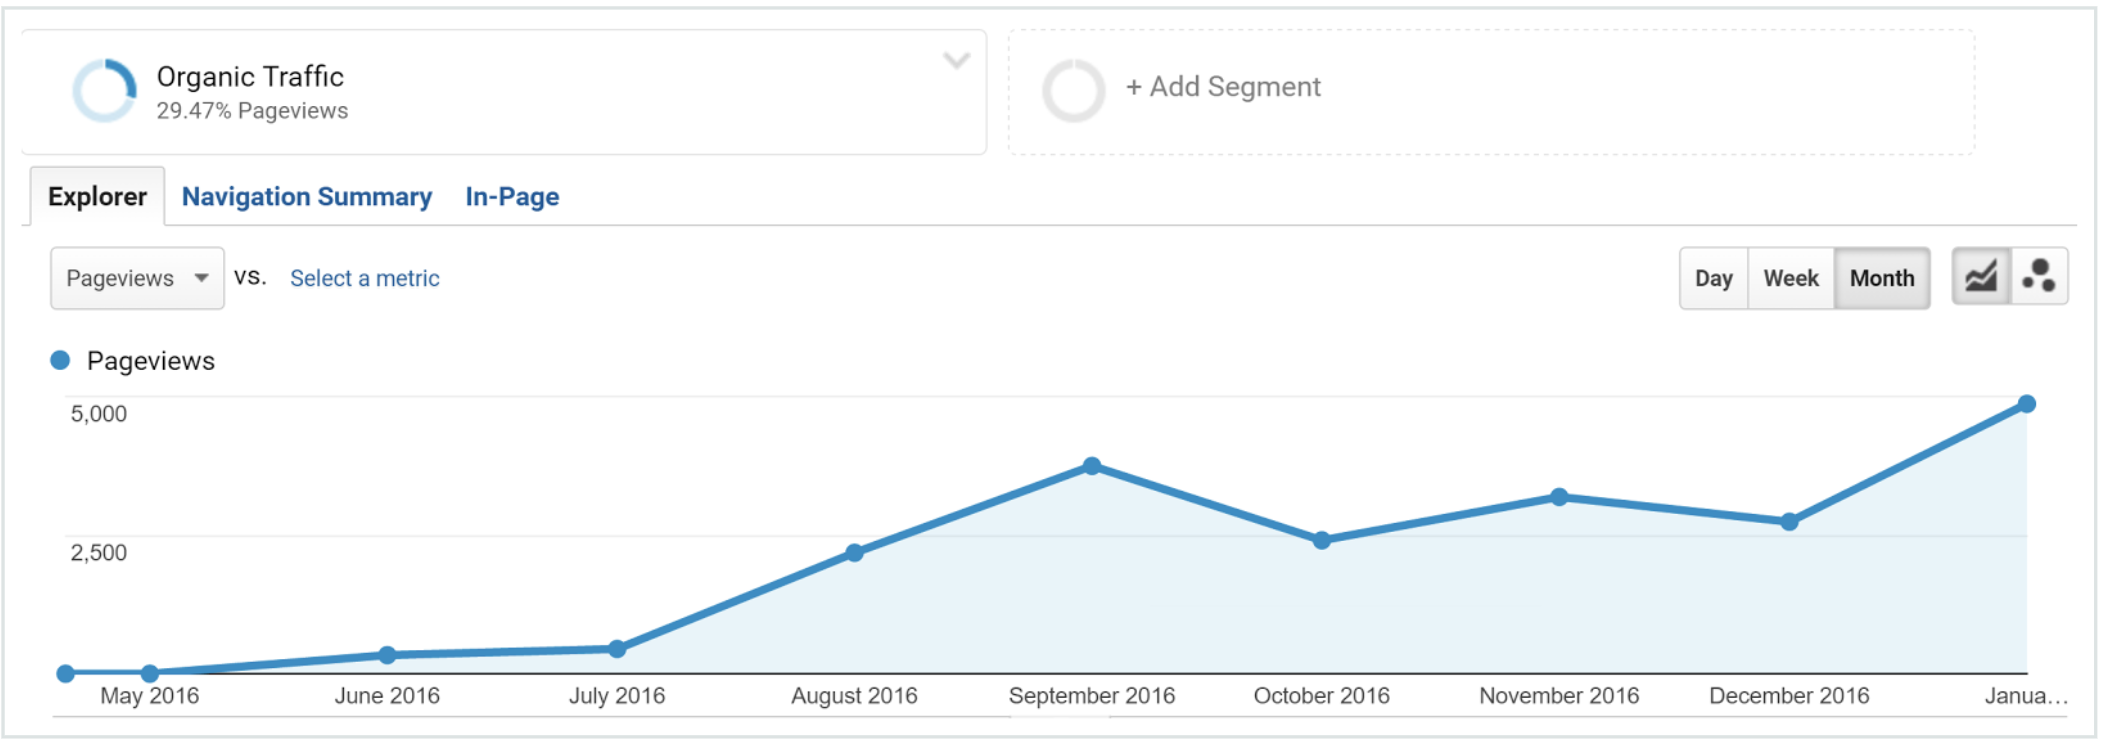
4. SEO: Moz’s case study for Pipedrive, a sales CRM
Using a content marketing strategy that included content creation, outreach, and guest posting, Pipedrive, a sales CRM, was able to rank #1 for a high-volume keyword — “sales management” (9,900 search volume). They were able to outrank many competitors and even US News and Wikipedia. They published their strategy on Moz.
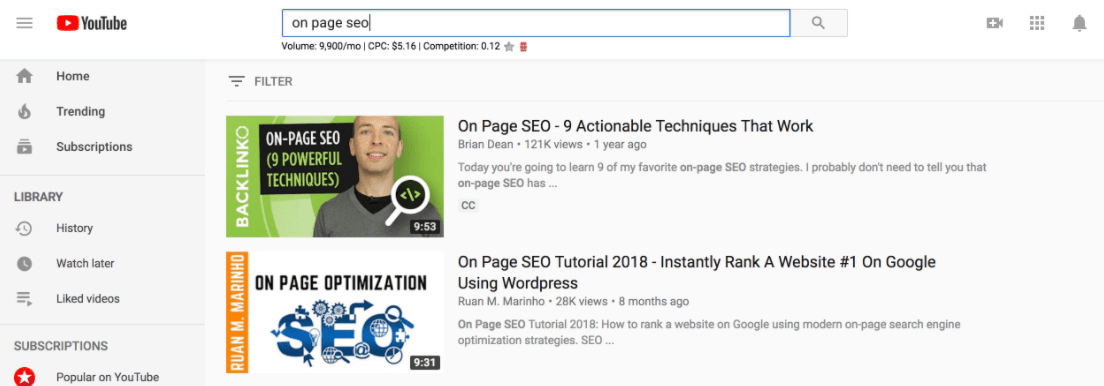
5. SEO: Brian Dean’s YouTube strategy
Brian Dean, an SEO expert and the creator of BackLinko, uses SEO tactics to rank #1 on YouTube for keywords like “on page SEO” and “video SEO”. Initially, Dean admits his YouTube account struggled to get any views.
Employing SEO methods like keyword optimization has enabled Dean to rise to #1 on YouTube for search results related to his business. He published his full strategy on Backlinko.
6. Web Design: AccessAble
AccessAble, an information provider for people with disabilities in the UK and Ireland, hired Agency51 to implement an SEO migration strategy to move AccessAble from an old platform to a new one.
By applying 301 redirects to old URLS, transferring metadata, setting up Google webmaster tools, and creating a new sitemap, Agency 51 was able to successfully transfer AccessAble to a new platform while keeping their previous SEO power alive.
Additionally, they were able to boost visitor numbers by 21% year over year, and the site restructuring allowed AccessAble to rank higher than competitors. Their case study is available on SingleGrain.com.
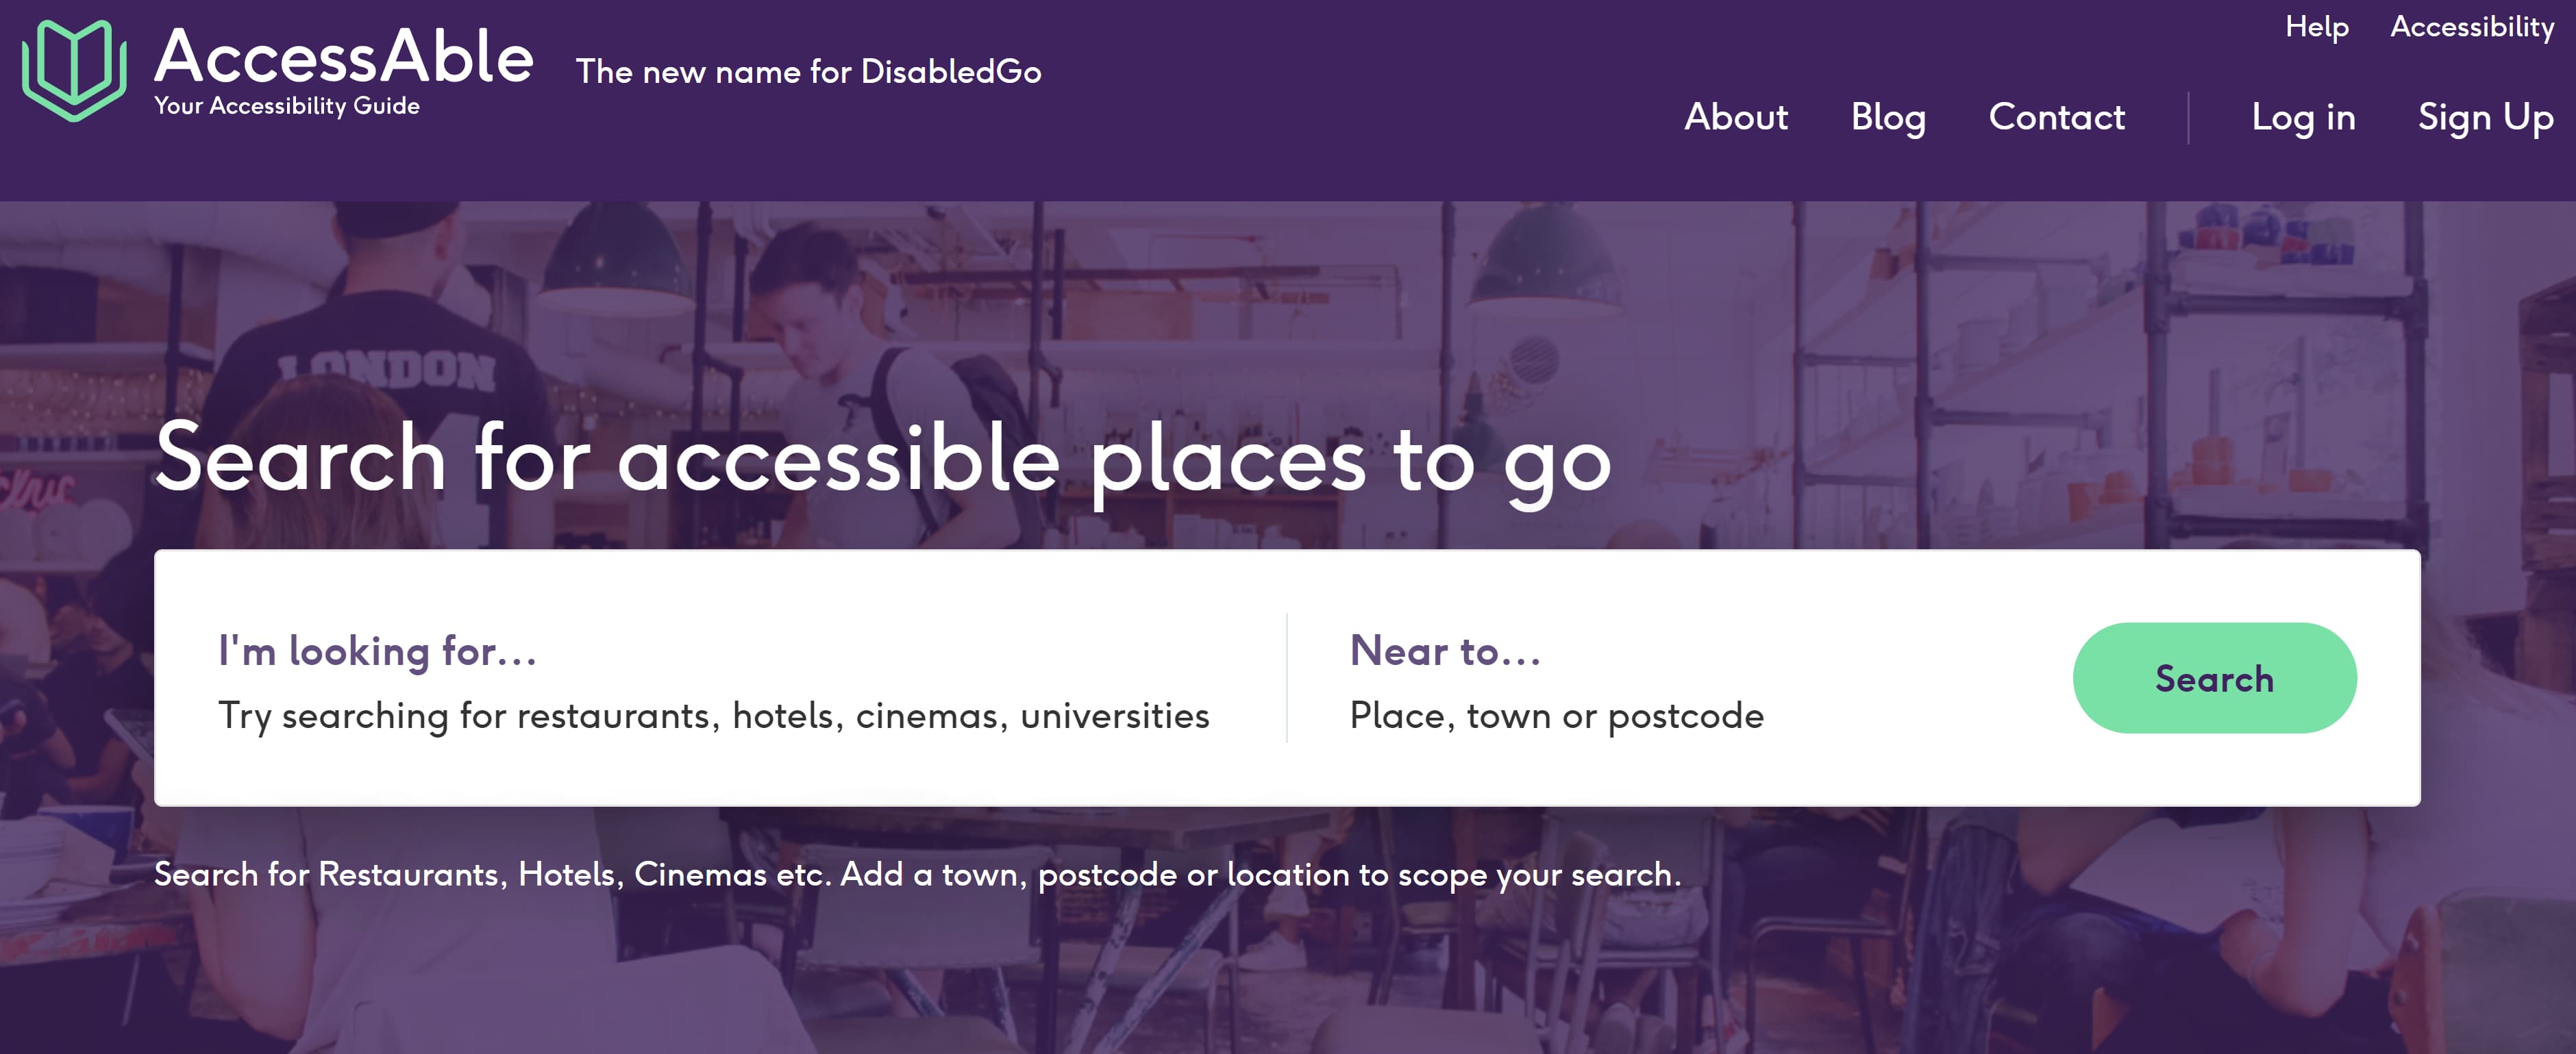 Image Source
More Internet Marketing Examples:
Top Online Marketing Tools
- HubSpot
- Buzzsumo
- Canva
- GTmetrix
- Ahrefs
- Buffer
- Facebook Insights
- SocialRank
- Trello
- Crazy Egg
- Google Keywords Planner
Whether you’re a seasoned marketer, or just starting out, there are plenty of tools available to help build your brand’s audience, including:
Ultimately, your internet marketing strategies will work best if you incorporate inbound marketing methodology. First and foremost, you want all your online content to add value to your customers”s lives. This is the only way you’ll attract quality leads and build deep relationships with your online community for the long-term.
We love Buzzsumo because it can help you analyze what content performs best for any topic or competitor. Buzzsumo can report important metrics such as social shares, backlinks, and which influencers are sharing certain pieces of content.
You can also find influencer reports that give insight if you’re looking for a micro influencer to promote your brand.
Canva makes designing infographics and materials for print, blogs, and social media simple, even if you don’t have much experience with graphic design. Its user interface is easy to navigate and includes thousands of customizable templates you can redesign to fit your brand’s aesthetic.
This application tests your website’s performance, particularly its speed. If your website takes too long to load, you run the risk of deterring potential customers or clients from your brand. With GTMetrix, you can measure how long your website takes to load and what areas of performance need to be improved.
Ahrefs is my favorite tool for finding the right keywords for optimizing my content. They offer tools for tracking keyword performance, analyzing your competitor’s keywords, web traffic, and more. One of my favorite features has been the “content gap” tool, which shows the keywords our competitors rank for that we don’t.
Posting multiple pieces of content across several different platforms can be overwhelming. Fortunately, applications like Buffer allow you to draft and schedule posts across multiple social media channels, such as Facebook, Instagram, Twitter, and Pinterest.
Furthermore, Buffer also offers social media reporting and functionality monitoring so you can track how your content is performing.
When I was a journalist, Facebook Insights played a key role in tracking how my articles performed. With a Facebook Insights dashboard, you’ll be able track user behavior and post performance on your Facebook Business Page.
This tool also reports important metrics like page views and post reach for paid and organic posts. It even recommends competitor pages to monitor.
SocialRank is an online tool that helps you manage your followers on Twitter and Instagram. SocialRank offers a range of filters to better analyze your follower count. It can also search for new followers, get leads, and more.
As your business grows, so will its output and the projects it takes on. Therefore you’re going to need a tool like Trello that will help you manage it all.
With Trello, a project management tool, you can put all your team’s projects in one customizable space that can grow as your company grows. You can use Trello to conduct growth experiments, sales pipelines, and product feature road maps.
Crazy Egg is a website optimization software that offers A/B testing, heat mapping, and usability testing tools. We love its A/B testing tool because it allows you to test variations of every page on your website. All you have to do is copy one snippet of code to the pages you want to test.
You don’t need coding experience to use Crazy Egg, as the software is user friendly to marketers at all levels.
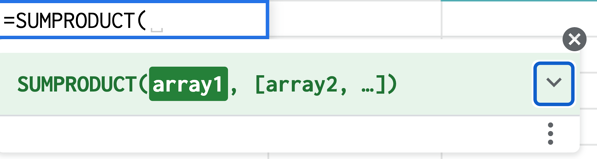
If you struggle with finding the best keywords for your website, Google Keywords Planner is an excellent tool for you.
By putting in one keyword, multiple keywords, or even your website address into Keyword Planner, Google will show a list of related keywords along with simple metrics.
These metrics will gauge the competition around each keyword and how many searches it gets on both a global and local search level.
Ultimately, your internet marketing strategies will work best if you incorporate inbound marketing methodology. First and foremost, you want all your online content to add value to your customers’ lives. This is the only way you’ll attract quality leads and build deep relationships with your online community for the long-term.

![Download Now: Social Media Trends in 2022 [Free Report]](https://i4lead.com/wp-content/uploads/2022/04/3dc1dfd9-2cb4-4498-8c57-19dbb5671820-2.png)


 Next, let’s dive into some conversion copywriting examples.


![Download 10 Excel Templates for Marketers [Free Kit]](https://i4lead.com/wp-content/uploads/2022/04/9ff7a4fe-5293-496c-acca-566bc6e73f42-1.png)
![→ Access Now: Google Sheets Templates [Free Kit]](https://i4lead.com/wp-content/uploads/2022/04/e7cd3f82-cab9-4017-b019-ee3fc550e0b5-3.png)


![→ Download Now: SEO Starter Pack [Free Kit]](https://i4lead.com/wp-content/uploads/2022/04/1d7211ac-7b1b-4405-b940-54b8acedb26e-3.png)