Categories B2B

5 science-backed pricing tips from the U.K.’s top marketing podcast

In 2007, Coulter and Coulter showed two advertisements to two random groups of customers. Each advertised £10 discounts on flights to Turkey. One listed the tickets at £188. The other showed a higher price: £233. Click here to download our free introductory ebook on marketing psychology.

Customers found that the cheaper tickets felt like a worse value. Why? Researchers found that people more easily differentiate smaller numbers. The difference between 4 and 3 seems more salient than 9 and 8. So, customers were more likely to buy when the prices ended in smaller numbers £244 to £233), compared to those ending in higher digits (£199 to £188).

pricing tips, flight to turkey

The takeaway is fairly simple. Next time you run a discount, make the sale price less than five. That’s just one piece of pricing advice that we’ve discussed on my podcast Nudge, the U.K.’s number one marketing podcast. Here are four more psychology-backed tips for pricing your products.

Table of Contents

Break down your price.

Check out the two ads for a budget lunch from Huel. One shows the total cost of 21 meals (£78.96). The other breaks down the price per lunch ($3.76). Researchers found that breaking down the price per unit performed better with customers. Showing a lower price led shoppers to perceive that they were getting a better deal.

pricing tips, break down your price

Richard Shotton and Michael Aaron Flicker tested ads very similar to this for their fantastic book Hacking the Human Mind.

In a study, 282 shoppers were divided into groups. Half were shown Sierra Nevada Pale Ale priced at $18.99 for 12 bottles. The other group was told the price per unit — $1.58 per bottle. Among those shown the per-bottle price, 28.6% said it was good or very good value (more than double the 13.7% who only saw the total price).

show the difference, beer

Framing the cost per unit made the purchase feel more reasonable and affordable.

Show the price difference.

Companies looking to upsell their audience need to pick the right framing. Take this 2019 experiment from David Hardisty at the University of British Columbia. Hardisty tested different pricing packages for New York Times subscriptions.

Group A saw two plans:

  • A “Digital Access” subscription for $9.99/month.
  • An “All-Access” subscription that included web access, the app, print newspapers, podcasts, and the crossword for $16.99/month.

Group B saw the same products described in a different way. The first plan showed a “Web + App” subscription for $9.99/month. The second plan, labeled “+ All the Extras,” was available for an additional $7/month.

Same total price. Different framing. But, Group B chose the premium plan two times as often. Why? Because $7 extra feels easier to justify than $17 total.

Want people to go premium? Don’t show them the full price. Use differential price framing and just tell them the surcharge.

pricing tips, show the difference

Be transparent with your costs.

I went viral on LinkedIn for sharing this image about chicken soup. One showed a bowl priced at $7.99. The second ad showed a breakdown of all the ingredients, how much they cost, and the profit margin before the final price. Which sign would be better for sales? The post attracted a lot of attention because the results were surprising.

pricing tips, show the cost

My post was based on a 2020 study from Harvard designed to test the effects of showing a product’s cost. The initial experiment ran in a Harvard canteen, where researchers tracked actual purchases after students viewed the comparisons.

When the costs were made visible, soup sales increased by 21%.

The takeaway: Price transparency wins. Customers are more willing to pay when they know what goes into making a product.

Make the difference visible.

Imagine handing someone the equivalent of $1 and offering them a choice between two packs of gum. Same flavour. Same brand. Same price.

What happens? Decision paralysis.

In one South Korean study, participants in South Korea were given ₩1,000 and asked to choose between two identical packs of gum, each priced at ₩630. Only 46% made a purchase. More than half walked away.

Then, the researchers made one small change. They adjusted the prices slightly. One pack cost ₩620. The other brand was priced at ₩640. This time, 77% made a purchase. A tiny 20-won difference led to a 31-point jump in purchases.

pricing tips, visible differences in extra gum

Why does that happen?

When two options feel the same, people struggle to decide. So if you’re offering similar choices, find differentiating factors. Make one a bit cheaper, a bit quicker, or a bit more appealing. That tiny tweak can make a big difference.

Small nudges can work.

None of the tactics above changed the products themselves. Each approach simply changed how the price was presented. Those small shifts in framing dramatically changed what people choose. So remember: Small shifts can help products stand out, make deals feel more salient, and entice shoppers to buy.

Start testing and see what works for you.

Categories B2B

Brand Visibility: How to Increase It in the Era of AI

Brand visibility determines whether your business gets found or gets passed over — in search results, on social feeds, and increasingly, in AI-generated answers. It’s one of the highest-leverage investments a marketing team can make, and also one of the most commonly mismanaged.

Most teams treat visibility as a byproduct of other activities: run some ads, publish some content, and hope people notice. The brands that consistently outperform their categories do the opposite — they deliberately build visibility, measure it rigorously, and connect it directly to the pipeline.

I’ve watched companies cut their sales cycles nearly in half simply by ensuring prospects arrived at every conversation already familiar with the brand.

This guide covers what brand visibility actually means (and how it differs from brand awareness), seven strategies to increase it across traditional and AI-powered channels, and the six metrics that show whether your efforts are translating into revenue—not just impressions.

Free Download: How to Create a Style Guide [+ Free Templates]

Table of Contents

What is brand visibility?

Brand visibility is the frequency and prominence of a brand’s exposure to its target audience across relevant channels. When your ideal customers are searching, scrolling, or asking an AI assistant for a recommendation, do they see your brand — or your competitor’s?

How is brand visibility different from brand awareness?

These terms get used interchangeably, but they measure different things.

Brand awareness is a buyer’s ability to recognize or recall a brand. Essentially, brand awareness lives in memory. On the other hand, brand visibility is about presence in the external environment — how often and how prominently your brand appears where buyers are paying attention. Visibility is the input; awareness is the output.

Prioritize visibility when entering a new market or launching a product. Prioritize awareness when you have reach, but conversions aren’t materializing. In other words, prospects see you but don’t remember or trust you. The best-performing brands invest in both memory and trust simultaneously. Brand equity requires both.

Why brand visibility matters for growth

It builds demand before buyers are ready. Research from the B2B Institute at LinkedIn suggests roughly 95% of B2B buyers are out-of-market at any given time. Brand awareness research consistently shows that familiar brands win a disproportionate share of consideration when buyers do enter the market.

You don’t win deals at the moment of purchase — you win them during the months of passive exposure that preceded it.

It influences pipeline generation. When a prospect already knows your brand before a sales rep reaches out, friction is lower. A 2025 study found that 68% of B2B buyers already have a favorite vendor in mind at the very start of their purchasing process, and will choose that front-runner 80% of the time.

It improves sales efficiency. I’ve seen this firsthand: companies investing consistently in content and SEO for two to three years report materially shorter sales cycles — not because the product changed, but because more prospects arrive pre-educated. Reps spend less time building credibility and more time closing.

It reduces dependence on paid acquisition. Brand loyalty data consistently shows that organically acquired customers have higher customer lifetime value (LTV) and lower churn. Building visibility is building an appreciating asset. Paying for reach is a recurring expense that stops the moment you pause the budget.

How to increase brand visibility for your company

1. Build AEO-ready content to appear in AI answers

This is the most important visibility shift happening right now, and many brands are underinvesting in it.

Answer Engine Optimization (AEO) is the practice of structuring content so it gets cited by AI-powered search tools — Google’s AI Overviews, ChatGPT, Perplexity, and Bing Copilot. These surfaces answer queries directly, often before a user sees a traditional result. If your content isn’t structured to be selected as the answer, you’re invisible to a growing share of your audience.

What makes content AEO-ready: explicit definitions (state what things are, what they do, how they differ); question-and-answer structure with headings phrased as real queries; verifiable data with cited sources; comprehensive topic coverage; and schema markup (FAQ, HowTo, Article).

Pro Tip: Run your top pages through HubSpot’s AEO Grader to identify structural gaps in question coverage, schema, and content depth — specific enough to act on immediately.

Best for: Educational content targeting “what is,” “how to,” and “why does” queries in your category.

2. Dominate branded and category search

Organic search captures buyers who are already looking. Own two query types: branded search (your company or product by name) and category search (the problem you solve or solution type you offer).

To increase search visibility: identify what buyers search before they know your brand and build content hubs around those topics; build topical authority through content clusters rather than isolated articles; and optimize for featured snippets and People Also Ask boxes, which function as a stepping stone to AI citation.

What we like: HubSpot Content Hub includes SEO recommendations and content clustering tools that identify topic gaps, suggest related content, and track ranking improvements — removing the guesswork from content strategy.

3. Maintain consistent brand content across every channel

Research shows that consistent brand presentation across channels increases revenue by up to 23%. When buyers see the same visual identity, tone, and message across your website, social, email, and paid channels, impressions stack.

When they don’t match, they don’t compound — and every impression has to start from scratch.

Three things to lock in: a core message (who you help, how, and why it matters); a visual identity that’s identical across every surface; and a documented tone and voice specific enough that a new hire can produce on-brand content on day one. Brands known for consistent stellar branding treat this as infrastructure, not style preference.

4. Earn visibility through thought leadership

Thought leadership — original research, strong opinions, proprietary frameworks — earns visibility that paid media can’t replicate. When your content is cited in industry publications or shared by respected voices, you gain exposure to audiences that no ad campaign could reach with the same credibility.

The formula: say something specific, support it with evidence, and take a clear position. “Marketing is changing” is noise. “Brands investing in AEO now will capture significantly more organic visibility in AI search — here’s the data” is shareable. I’ve consistently found that content that takes a clear, defensible position outperforms “balanced overview” content across every visibility metric.

High-leverage moves: original research (primary data is inherently citable), guest contributions to industry publications, and commentary on industry debates with supporting evidence.

5. Optimize for AI entity recognition

Beyond AEO content structure, there’s a deeper visibility layer: entity recognition. AI systems build knowledge graphs that connect brands to their categories, attributes, and relationships. If those systems don’t have a clear, consistent representation of your brand, you’ll be underrepresented in AI-generated answers regardless of your content quality.

To strengthen entity presence: claim and complete your Google Business Profile, LinkedIn, Crunchbase, and Wikipedia entries; use a consistent brand name and description across all external profiles; earn mentions on authoritative domains; and explicitly define your brand in your own content — your category, differentiation, and the problems you solve.

Don’t assume AI systems already know what you do.

6. Leverage social proof and community

Visibility compounds when customers and the community amplify it. Reviews, case studies, user-generated content, and community participation extend reach into networks that owned channels can’t access.

Practical moves: actively request G2 or Google reviews at moments of peak customer satisfaction; build even a small, active community (a Slack group or LinkedIn community) in a channel you control; and run co-marketing with complementary brands — a joint webinar or co-authored report exposes your brand to a partner’s entire audience, often more efficiently than standalone campaigns.

7. Use paid media to amplify organic visibility — not replace it

Paid media is an amplifier, not a substitute. The most efficient approach: retarget organic visitors (people who’ve engaged with your content are 2–5x more likely to convert than cold audiences) and build lookalike audiences from your highest-LTV CRM segments for awareness-level campaigns.

Run thought leadership content and original research to those audiences before running conversion campaigns — you’re buying visibility with a warm, relevant audience.

What we like: HubSpot Marketing Hub connects CRM data to campaign targeting, making paid visibility more precise and the path from impression to pipeline more measurable.

Brand visibility metrics to track

1. Share of Search

Your branded search volume divided by total branded search volume in your category, multiplied by 100. Research by Les Binet has found that the share of search correlates strongly with revenue share—often with a 6–12-month lag.

Track monthly in Google Search Console with support from Semrush or Ahrefs.

2. Share of AI Visibility

How often your brand appears in AI-generated answers for category-relevant queries, relative to competitors. Track a consistent set of 20–50 queries monthly across ChatGPT, Perplexity, and Google AI Overviews—record which brands appear and how frequently.

Your share of those appearances is your AI visibility benchmark.

3. Branded Search Volume

The clearest signal that visibility is translating to brand salience. Rising branded search means people are seeking you out by name — the compounded result of every impression across every channel.

Track in Google Search Console; spikes after campaigns validate that visibility investments are driving recall.

4. Organic Impressions and Share of Voice

Total organic impressions show how often your content appears in search results. Share of voice — your percentage of total impressions for tracked keywords — shows how you’re competing. Both are available via GSC, Semrush, or Ahrefs.

5. Assisted Conversions

Brand visibility is measured by assisted conversions — conversions in which your brand appeared at some point in the buyer’s journey, even if it wasn’t the last touchpoint. Find this in Google Analytics 4 under attribution reports.

If branded content consistently appears in the paths of high-value deals, that’s direct evidence that visibility is influencing revenue.

6. Pipeline Influenced by Visibility Channels

The ultimate lagging indicator: how far back the pipeline traces to contacts who first engaged through organic search, social, earned media, or referral. HubSpot Marketing Hub’s multi-touch attribution reporting makes this traceable — connecting a closed deal back to the blog post a prospect read six months before ever talking to sales.

Pro Tip: Build a single dashboard showing all six metrics. When branded search volume, assisted conversions, and pipeline attribution are visible together, you can make the case to leadership that brand investment is a compounding growth driver — not a cost center.

Frequently asked questions about brand visibility.

How do I measure brand visibility online beyond impressions?

Focus on branded search volume (are people seeking you by name?), share of search (what percentage of category search is yours?), and assisted conversions (do visibility touchpoints appear in paths leading to closed deals?). Together, these connect what your audience sees to what they actually do.

What is the share of visibility, and how do I track it?

Share of visibility is your brand’s percentage of total search impressions, AI citations, or social mentions in your category relative to competitors. For search: divide your branded search volume by the combined total of your top 3–5 competitors and multiply by 100.

For AI: run 20–50 category queries monthly across major AI platforms and track mention frequency.

How do I increase brand visibility in AI search?

Three things working together: AEO-ready content structure (explicit definitions, Q&A formatting, factual grounding, schema markup); entity authority (consistent presence across Google Business Profile, LinkedIn, Crunchbase, Wikipedia, industry publications); and topical completeness (covering your category’s questions comprehensively enough that AI systems consistently recognize you as a reliable source).

How do I tie brand visibility to the pipeline?

Through CRM attribution. Track which contacts first engaged through a visibility channel, follow their journey through the funnel, and credit pipeline to those initiating touchpoints — not just the last touch before conversion.

Start by pulling an assisted conversions report and identifying which content and channels consistently appear in the paths of your highest-value deals.

How long does it take to see improvements?

Paid visibility moves within days. SEO improvements typically take 3–6 months to reflect in rankings and branded search volume. Thought leadership and earned media compound over 6–18 months.

AI search visibility can shift faster — structural content updates influence AI citations in weeks — but consistent entity presence takes several months to build. The pattern I’ve seen consistently: branded search lift around months 3–4, meaningful organic impression growth around months 6–9, and provable pipeline influence by months 9–12.

Visibility is a compounding asset, not a campaign.

The brands that win the next decade will show up consistently across every channel where buyers make decisions — including the AI surfaces rapidly reshaping how discovery happens.

HubSpot’s Marketing Hub, Content Hub, and Smart CRM give you the connected infrastructure to build, distribute, and measure visibility across all of those channels in one place — from the first AI citation to the closed deal in your CRM.

Explore HubSpot Marketing Hub to see how teams turn brand visibility into a measurable pipeline.

Categories B2B

Product SEO: 8 Strategies That Drive Demand for B2B & SaaS

Product SEO is one of the highest-leveraged — and most overlooked — strategies in B2B and SaaS marketing. While most teams pour resources into top-of-funnel content, the pages that actually drive pipeline decisions, such as feature pages, comparison pages, and pricing pages, often go unoptimized and underperform.

Fortunately, fixing that gap doesn’t require rebuilding your entire site. With the right architecture, keyword strategy, and structured content, your product pages can rank for the exact queries buyers are searching when they’re closest to a decision, and convert that traffic into real revenue.

Download Now: HubSpot's Free AEO Guide

Table of Contents

What Is Product SEO?

Product SEO is the practice of optimizing pages that describe, demonstrate, or compare your products and features so they rank in search results and convert visitors into pipeline. It applies across the entire product surface area of your site, not just a single “Products” page.

For B2B and SaaS companies specifically, product SEO optimizes:

  • Feature pages (e.g., “/features/email-automation”)
  • Integration pages (e.g., “/integrations/salesforce”)
  • Comparison pages (e.g., “/vs/competitor-name”)
  • Pricing pages (e.g., “/pricing”)
  • Documentation and setup pages (e.g., “/docs/getting-started”)
  • Deployment and use-case pages (e.g., “/solutions/revenue-operations”)

This is worth emphasizing because most SEO advice about “product pages” is written for e-commerce, like Shopify stores, optimizing product detail pages with SKUs, inventory counts, and star ratings.

That playbook doesn’t map cleanly onto SaaS. You don’t have a SKU for “Marketing Hub Professional.” You have plans, tiers, seats, add-ons, release notes, and changelog pages. Product SEO for B2B means treating all of those touchpoints as first-class organic assets.

Pro Tip: Don’t confuse product SEO with content SEO. A blog post that mentions your product is content SEO. A page that is your product by demonstrating its value, explaining its features, and comparing it to alternatives is product SEO.

Both matter, but they need different strategies.


Why Is Product SEO Important for B2B and SaaS?

It captures buyers at the peak of their intent.

Most SEO programs over-index on top-of-funnel content — “what is X,” “how to Y” — and underinvest in the pages where buyers are actually making decisions. But by the time someone searches for “[your product] vs [competitor]” or “[your product] pricing,” they’ve left the awareness stage and are not evaluating.

Product SEO puts you in front of that audience at exactly the right moment..

It compounds across the full lifecycle

Product SEO goes beyond acquiring new customers and supports every stage of the lifecycle:

  • Discover: Feature and use-case pages help new audiences find you when searching for solutions
  • Evaluate: Comparison, pricing, and integration pages convert researchers into trial users or demo requests
  • Adopt: Documentation and setup pages improve activation rates and reduce churn
  • Expand: Pages covering advanced features, new integrations, or higher-tier plans drive upsell and cross-sell

I’ve seen SaaS companies generate meaningful pipeline lift simply by cleaning up their integration pages — adding clear use cases, relevant keywords, and structured data — because those pages were already getting traffic but converting at near-zero rates.

Generative search makes structured product content more important, not less

The rise of AI Overviews in Google search is changing what earns visibility. Google is increasingly synthesizing answers from pages that are explicit about what a product does, who it’s for, and how it compares to alternatives. Vague, fluffy product copy gets skipped. Specific, structured, semantically rich product content gets cited.

This means product SEO is now also Answer Engine Optimization (AEO).

Pages that clearly state “HubSpot Marketing Hub is a marketing automation platform that helps B2B SaaS companies generate, nurture, and measure leads” are far more likely to appear in AI-generated answers than pages that lead with generic value proposition language.

Pro Tip: HubSpot’s AEO Grader helps you evaluate whether your pages are structured to appear in AI-generated search results — a critical capability as generative search continues to reshape the SERP.

It reduces your dependence on paid acquisition

In B2B SaaS, customer acquisition cost through paid channels is brutally expensive, often $300–$1,000+ per qualified lead, depending on your segment.

Product pages that rank organically for high-intent queries like “[your feature] tool,” “[your product] for [use case],” and “[your product] alternative” deliver compounding returns that paid simply can’t match.

Every product page that earns a top-3 ranking is a sales asset that works around the clock without an ongoing spend.

How to Optimize Product Pages for SEO

Product SEO aims to improve rankings and conversions for high-intent queries. Here’s how to build and optimize pages that do both.

Step 1: Audit and define your product page architecture

Before optimizing individual pages, clarify your site architecture. Search intent for product SEO includes site architecture patterns that prevent keyword cannibalization — and if you skip this step, you’ll spend months optimizing pages that are competing with each other.

A clean product page architecture for a SaaS company typically looks like this:

/product → Product overview hub

/features/[feature-name] → Individual feature pages

/integrations/[tool-name] → Integration-specific pages

/solutions/[use-case] → Use-case or industry pages

/pricing → Pricing page

/vs/[competitor] → Comparison pages

/docs/[topic] → Documentation pages

The key rules: each URL should target a distinct keyword cluster, pages in the same category should share a consistent template, and your top-level product hub should consolidate internal link authority from the supporting pages below it.

Pro Tip: Clear site architecture reduces keyword cannibalization between category pages and product pages. Run a quick site:yourdomain.com search in Google for your primary product keyword.

If three or four different pages all show up targeting the same term, you have a cannibalization problem to fix before optimizing further.

For a deeper dive into technical architecture, HubSpot’s guide to technical SEO for ecommerce covers many of the same structural principles that apply to SaaS product pages.

Step 2: Map keywords to buyer intent and lifecycle stage

Product SEO optimizes product, feature, integration, comparison, pricing, and documentation pages, and each page type attracts queries at different lifecycle stages. Map them explicitly before writing a single word of copy.

This mapping does two things: it tells you what keywords each page should target, and it clarifies what conversion action makes sense. A documentation page shouldn’t have the same CTA as a comparison page.

Step 3: Write product copy that satisfies both search intent and buyer intent

Search intent for product SEO includes how to optimize product pages to rank and convert — and those two goals aren’t in conflict if you write copy that’s specific, benefit-driven, and substantiated.

For each product or feature page, your copy should:

Address the “what”: Explicitly state what the product or feature does. “HubSpot’s email automation tool lets you build behavioral drip sequences, trigger sends based on CRM activity, and A/B test subject lines at scale.” Don’t make searchers infer this from abstract value language.

Address the “who”: Name your target customer and use case. “Built for B2B marketing teams that need to nurture high volumes of leads without adding headcount.”

Address the “why”: Provide specific, quantifiable benefits where possible. Generic claims like “save time and increase revenue” are worthless to buyers and invisible to search engines. Specific claims like “reduce email setup time by 60% with pre-built workflow templates” are both credible and keyword-rich.

Address the “how”: Give buyers enough product detail to evaluate fit. Screenshots, short demo videos, and step-by-step use case walkthroughs all help here.

What we like: Pages that include a short “How it works” section — even just 3–4 bullet points — tend to convert better and rank better. They satisfy the buyer’s need to understand the product before committing, and they give search engines rich, explicit content to index.

Step 4: Implement structured data correctly for SaaS

Structured data is one of the highest-leverage — and most misunderstood — tactics in product SEO. Search intent for product SEO includes structured data examples, so let me give you concrete guidance.

Do you need a product schema if you’re a SaaS company?

Yes — but use it thoughtfully. Google’s Product schema was originally designed for physical goods with SKUs and prices. For SaaS, you can still implement it on pricing pages for specific plans. Here’s a minimal example:

{

“@context”: “https://schema.org”,

“@type”: “Product”,

“name”: “Marketing Hub Professional”,

“description”: “All-in-one marketing automation software for B2B teams managing high-volume lead generation and nurturing.”,

“brand”: {

“@type”: “Brand”,

“name”: “HubSpot”

},

“offers”: {

“@type”: “Offer”,

“price”: “890”,

“priceCurrency”: “USD”,

“priceSpecification”: {

“@type”: “UnitPriceSpecification”,

“billingIncrement”: “month”

}

}

}

FAQPage schema for product pages

FAQPage markup is highly effective for product and feature pages because buyers are full of questions during the evaluation stage. Adding FAQ schema to your feature pages can earn expanded SERP real estate and appear in AI-generated answers.

Integrate FAQ content in product pages for SEO by placing the most common evaluation questions (“Does this integrate with Salesforce?”, “How many contacts can I store?”, “Is there a free trial?”) directly on the page with structured markup:

{

“@context”: “https://schema.org”,

“@type”: “FAQPage”,

“mainEntity”: [

{

“@type”: “Question”,

“name”: “Does HubSpot Marketing Hub integrate with Salesforce?”,

“acceptedAnswer”: {

“@type”: “Answer”,

“text”: “Yes. HubSpot’s native Salesforce integration syncs contacts, companies, deals, and activity data bidirectionally, with field-level mapping controls and no middleware required.”

}

}

]

}

SoftwareApplication schema

For your main product pages, SoftwareApplication schema explicitly tells search engines that your product is software — and surfaces additional attributes like operating system, application category, and aggregate ratings:

{

“@context”: “https://schema.org”,

“@type”: “SoftwareApplication”,

“name”: “HubSpot Marketing Hub”,

“applicationCategory”: “BusinessApplication”,

“operatingSystem”: “Web”,

“aggregateRating”: {

“@type”: “AggregateRating”,

“ratingValue”: “4.4”,

“reviewCount”: “10750”

}

}

Pro Tip: Pull your aggregateRating data from a verified third-party source like G2 or Capterra, and set up a process to update it quarterly. Stale or inaccurate review counts can get your rich results revoked.

Step 5: Optimize images and video for product pages

Product pages are inherently visual — feature screenshots, workflow diagrams, product tour videos — and that visual content is both an SEO opportunity and a common performance drag.

For images:

  • Use descriptive, keyword-rich file names (e.g., hubspot-email-automation-workflow-builder.png instead of screenshot-1.png)
  • Write alt text that describes what’s shown and includes your target keyword naturally: “product seo dashboard showing keyword rankings by page type”
  • Compress images aggressively — product screenshots in WebP format typically come in under 100KB without visible quality loss
  • Use width/height attributes to prevent layout shift, which affects Core Web Vitals and rankings

For video:

  • Host short product demos natively or on YouTube, then embed them on the page with a VideoObject schema wrapper
  • Always include a transcript — it’s indexed content, and it makes your video accessible
  • Keep demo videos under 90 seconds for feature pages; buyers are evaluating, not watching a webinar

The image pack’s potential for product SEO queries is real. Optimizing alt text with “product seo,” “seo for product pages,” and “product page seo” can earn you image pack placements that increase overall SERP real estate even when you’re not in position one for the text results.

Step 6: Handle SaaS-specific complexity — plans, versions, and docs

This is where most SaaS SEO programs get tripped up. You have:

  • Multiple pricing tiers (Starter, Professional, Enterprise) that share many of the same feature descriptions
  • Version-specific documentation (“/docs/v1/api-reference” and “/docs/v2/api-reference”) that creates near-duplicate content
  • Changelog and release notes pages that accumulate over time and can dilute crawl budget

Here’s how to handle each:

Pricing tiers: Don’t create separate feature pages for each tier. Create one feature page that explains the feature, then reference which tiers include it. Use a single pricing page with clear tier delineation rather than three separate tier pages competing for the same queries.

Version-specific docs: Canonicalize older version pages to the current version, or use a noindex tag on versions beyond the current and one-previous. Add a prominent “You’re viewing docs for v1. [View current docs →]” banner to help both users and crawlers understand the authoritative version.

Release notes and changelogs: These pages serve an important user need (transparency, trust-building) but often aren’t worth pursuing as SEO targets. Consider consolidating them into a monthly roundup format rather than individual pages per release. Add noindex to very thin changelog entries.

For a broader treatment of programmatic SEO for SaaS, HubSpot’s guide to programmatic SEO covers how to scale page production without creating duplicate content problems.

Step 7: Build internal links that signal product page authority

Internal linking is one of the fastest ways to improve product page rankings, and it’s chronically underutilized in SaaS SEO programs. Your blog almost certainly has dozens of posts that mention your product features — but if those mentions don’t link to the corresponding product pages, you’re leaving equity on the table.

A practical internal linking strategy for product SEO:

  1. Map your feature pages to related blog topics. If you have a feature page for “email automation,” every blog post about email marketing, drip campaigns, or marketing automation should link to it.
  2. Use exact-match or near-match anchor text. “Email automation software” linked to your email automation feature page is more valuable than “learn more.”
  3. Prioritize links from high-traffic, high-authority pages. A link from your most-visited blog post carries more weight than a link from a low-traffic resource page.
  4. Create feature-specific hub pages that link out to related blog content and documentation, and receive links back in return.

HubSpot’s guide to finding SERP feature opportunities is a good starting point for identifying which existing pages can pass more authority to your product pages.

Step 8: Measure product SEO by lifecycle stage, not just rankings

Rankings are a leading indicator. Revenue is the lagging one. Connecting product SEO to pipeline requires measurement that bridges the two.

Here’s the framework I use:

Stage 1 — Discover: Track organic impressions and clicks to product pages by page type (feature, integration, comparison, etc.) via Google Search Console. Are pages gaining or losing visibility quarter over quarter?

Stage 2 — Evaluate: Track organic-sourced sessions to product pages, then measure conversion rate to your primary CTA (trial signup, demo request, gated content download). A product page that ranks well but converts at 0.1% needs UX and CTA optimization, not more SEO.

Stage 3 — Adopt: Track documentation and setup page views by users who signed up organically. High adoption-page engagement from organic cohorts correlates with lower churn.

Stage 4 — Expand: Track feature page views by existing customers who later upgraded. Tying CRM data to organic behavior (possible with HubSpot’s Smart CRM) lets you attribute upsell revenue to product SEO.

Pro Tip: Set up URL-level conversion tracking in HubSpot or your analytics platform to compare conversion rates across product page types. Feature pages, comparison pages, and pricing pages will convert differently — and optimizing them requires knowing which ones are underperforming relative to their traffic volume.

For a broader view of connecting SEO to growth metrics, HubSpot’s guide to startup SEO and growth covers the measurement infrastructure needed to make organic a reliable growth channel.


Best Product SEO Tools

These are the tools I’d reach for to build and optimize a product SEO program at a B2B or SaaS company.

1. HubSpot Content Hub

Best for: End-to-end content and SEO management, especially for teams already on HubSpot’s CRM

HubSpot’s Content Hub includes an SEO tool that surfaces keyword recommendations, internal linking opportunities, and content performance data — all connected to contact and pipeline data in the Smart CRM.

This means you can see not just which product pages are getting organic traffic, but which ones are generating leads and contributing to closed deals. For teams that want to connect product SEO to revenue without a custom BI setup, it’s hard to beat.

What we like: The topic cluster feature in Content Hub makes it easy to build the hub-and-spoke architecture that underpins effective product SEO — with automatic suggestions for which pages to link together.

2. Ahrefs

Best for: Competitive keyword research and backlink analysis for product pages

Ahrefs is my go-to for understanding the competitive landscape for product page keywords. The Keywords Explorer shows difficulty, search volume, and SERP features for any keyword, and the Site Explorer lets you see exactly which product pages your competitors are ranking with and what links they’ve earned.

Particularly useful for comparison page research — you can quickly see which “[competitor] vs [product]” queries have viable search volume before investing in a page.

What we like: Ahrefs’ Content Gap feature lets you see which product-related keywords your competitors rank for that you don’t — a fast way to identify missing features or integration pages.

3. Screaming Frog

Best for: Technical audits of product page structure, canonicalization, and crawlability

Screaming Frog crawls your entire site and surfaces technical issues that affect product page performance: missing or duplicate title tags, broken internal links, pages with thin content, incorrect canonical tags on versioned documentation, and more. For SaaS companies with large content footprints, it’s essential for keeping product page architecture clean at scale.

Best for: Teams with 50+ product, feature, or integration pages who need a systematic way to identify technical debt.

4. Google Search Console

Best for: Monitoring product page performance in Google’s actual index

Search Console is free and indispensable. For product SEO specifically, it’s the only tool that shows you real impressions and clicks for your pages in Google’s index — including which specific queries triggered each page.

I use it to identify product pages that are ranking on page 2 for high-value keywords (position 11–20) since those are usually the fastest wins: the page already has some authority, and targeted optimization can push it onto page 1.

Pro Tip: Use the URL Inspection tool in Search Console to check whether your structured data is being parsed correctly after you add Product, FAQPage, or SoftwareApplication schema.

5. Surfer SEO or Clearscope

Best for: On-page content optimization for individual product and feature pages

These tools analyze the top-ranking pages for your target keyword and identify which terms, topics, and content elements they include that yours might lack.

Useful for writing feature pages that are semantically complete — covering the related concepts and questions that searchers have when they search for that keyword. Clearscope tends to be favored by larger enterprise SEO teams; Surfer is popular with smaller teams and agencies for its workflow integrations.

Best for: Content writers and product marketers who need clear guidance on what to include on a product page, without deep SEO expertise.

Frequently Asked Questions About Product SEO

What’s the difference between product SEO and feature page SEO?

Product SEO is the umbrella term — it covers the optimization of any page that represents your product’s capabilities, value, or positioning. Feature page SEO is a subset of product SEO focused specifically on individual feature pages.

The distinction matters because feature pages and top-level product pages have different keyword targets, different content structures, and often different conversion goals. A top-level product page might target a broad keyword such as “marketing automation software” to drive demo requests.

A feature page might target “email drip campaign builder” to drive free-trial signups or documentation visits.

Should I put pricing on my product pages for SEO?

Yes — and I’d argue it’s one of the most underleveraged product SEO moves available to SaaS companies.

Many companies bury or omit pricing out of fear that it’ll lose them deals, but search data tells a different story: “[product] pricing” is consistently one of the highest-volume, highest-conversion queries for SaaS brands. Buyers who search for your pricing are close to a decision.

If your pricing page doesn’t rank, a competitor’s comparison page that includes your pricing (often inaccurately) will.

Beyond ranking for the “[product] pricing” keyword, including pricing on feature pages helps buyers self-qualify — which means fewer unqualified demo calls and higher close rates for the leads who do convert.

How do I handle SaaS release notes and version pages without duplicate content?

The core principle is: give each piece of content a single authoritative URL, and signal that authority to Google clearly.

For versioned documentation, keep the current version at a clean URL (e.g., /docs/api-reference) and redirect or canonicalize older versions to it. If you need to keep old versions accessible (common for API docs), add a canonical tag pointing to the current version and a visible “This is an archived version” notice.

For release notes and changelogs, consolidate thin individual entries into monthly or quarterly roundup pages rather than maintaining hundreds of sparse pages. Set a noindex tag on any release note that’s under ~300 words with no unique educational value. The goal is to preserve the user value of your changelog while keeping your crawl budget focused on pages with real ranking potential.

Do I need schema if I’m a SaaS company without SKUs?

Yes. The absence of SKUs doesn’t mean the schema isn’t valuable — it just means you’re not using Product schema for inventory-level detail. SaaS companies should implement:

  • SoftwareApplication schema on main product and feature pages
  • FAQPage schema on feature, comparison, and pricing pages with Q&A sections
  • HowTo schema on documentation and setup pages
  • Product schema on pricing pages tied to specific plans with published prices
  • BreadcrumbList schema sitewide for navigation structure

Each of these gives search engines more explicit context about what your pages are and what questions they answer — which directly impacts eligibility for rich results and AI-generated answer citations.

How soon will product SEO changes impact pipeline?

Realistically, most product SEO changes take 3–6 months to show up in rankings and 6–12 months to demonstrate measurable pipeline impact. The exceptions are pages that are already indexed and ranking on page 2 — those can see ranking improvements within 4–8 weeks of meaningful optimization.

Technical fixes (fixing canonicalization errors, adding structured data, improving page speed) tend to show faster results than content-level changes.

The key is to connect your product SEO work to CRM and pipeline data from day one, so that when ranking improvements do come, you have the measurement infrastructure to attribute them to deals.

HubSpot’s Smart CRM makes this possible by connecting organic acquisition data to contact records, lifecycle stages, and revenue outcomes — giving you a clear picture of which product pages are actually driving qualified demand.

Want to see how your existing product pages perform for AI-generated search results? Try HubSpot’s AEO Grader →

Ready to optimize and scale your product content? Explore HubSpot Content Hub →

Categories B2B

Our Vision for Building an Open Ecosystem for the Agent Era

For years, HubSpot invested in making our platform the best place for marketing, sales, and service teams to do their work. With AI, we’ve been building it to do the work for them – through agents that qualify leads, resolve tickets, save deals, and drive outcomes across the business. That’s why we call HubSpot an agentic customer platform.

But agents don’t click through dashboards or navigate interfaces; they call APIs, read structured outputs, and take action. Software built for humans has to evolve to be genuinely accessible to agents, too.

Access alone isn’t enough, though. Agents also need substance. An agent reasoning over raw records has no way to know what’s normal for a specific business, or what’s worked for hundreds of thousands of companies like it. As we recently wrote, the real AI race isn’t about models or data; it’s about context.

That conviction shapes everything we build. It’s why we were among the first to ship an MCP server, and why we’ve kept expanding what agents can read, write, and act on since. That was only the beginning.

The vision we are working toward is bigger: Agents can run on HubSpot. And agents can run HubSpot.

Running on HubSpot means any agent – ours or anyone else’s – can plug into HubSpot’s data, context, and capabilities as a building block. Running HubSpot means agents can operate the platform end-to-end through our APIs, MCP server, CLI, and whatever access methods come next.

What we’re opening up

For agents to run on HubSpot and to run HubSpot, they need what we call growth context. That’s the specific, dynamic understanding AI needs to deliver real results across the go-to-market, taking into account everything about a company’s business, teams, processes, and customers – and bolstered by patterns across HubSpot’s network of 280,000+ customers.

It’s derived from two things – data and intelligence – and we are opening both to our ecosystem of customers, partners, and developers.

The data layer is the foundation: contacts, companies, deals, conversations, tickets, activity – open and accessible, powering thousands of integrations today. As always, bringing data into HubSpot is free. A customer’s data is theirs. If they ever choose to leave, it goes with them.

The intelligence layer is what we’re building now. It covers both insights that inform decisions (scores, assessments, and benchmarks that can be called directly) and actions that drive outcomes (qualifying leads, resolving tickets, saving deals). This is the work our Breeze agents already do inside HubSpot, and it will soon be available wherever teams and agents operate.

For example, take deal intelligence. A sales manager pulls their team’s open pipeline into an LLM – amount, stage, close date, last activity – and asks what’s at risk. The model can calculate averages from the data in front of it, but it doesn’t know whether 30 days in-stage is fast or slow for this industry. It doesn’t know the champion on one of these deals went quiet after a reorg. It doesn’t know a similar deal at a comparable company stalled on exactly this objection last quarter.

With the intelligence layer, a single API call will return a pre-computed risk score built on patterns across HubSpot’s hundreds of thousands of customers. It will know that this industry’s sales cycle runs 90 days, not 30. It will know the champion went quiet after a reorg. It will know that other deals like this one stalled on the same objection before. And it will be able to act on that intelligence by recommending a next step, flagging the deal for review, or triggering a follow-up.

The data layer gives an agent raw material. The intelligence layer will give it a head start, something no standalone model, and no platform without a network of this scale, can replicate.

How we think about our platform

There’s a lot changing in the industry right now. Some platforms will respond by closing down, constructing walled gardens, restricting access, and making it harder for customers to benefit from AI. We think the moment calls for the opposite. When agents can access data, act on behalf of customers, and run business processes, openness and trust matter more than ever.

Customer value above all. We believe customers should have the freedom to choose the best agents, integrations, and partners to help them grow. We’ll always invest in world-class first-party agents from HubSpot. But the best agent for a specialized industry or workflow will often come from the ecosystem. We welcome that.

Open by design. We’re working toward a simple standard: anything you can do inside HubSpot, you should be able to do through an API. Our intelligence should reach you wherever you work, inside or outside of HubSpot, directly or through apps and agents built on top of us. That’s why we’re committed to giving builders access to the same foundations we build on.

Trusted by default. We’re treating trust and governance as core infrastructure. When a customer connects a partner tool, spins up an agent, or builds something custom, they should know exactly what it can access and what it’s doing. Agents that act on your behalf are only useful if you can trust them.

These aren’t just principles. They’re a deliberate choice about the kind of platform we want to be.

What’s available today, and what’s coming

Today: an open, agent-ready platform. HubSpot is open for agents now. Our APIs and MCP server are live. Connectors for Claude, ChatGPT, Gemini, and Copilot are delivering real value to customers. More than 2,000 apps run across our ecosystem, and new agents are being built on top of the platform every week.

Coming next: full API parity. We’re continuing to expand our public API surface so that every capability of the platform – every workflow, every action, every piece of context – is accessible to the apps and agents built on top of us. No capability should live only behind a UI.

The opportunity ahead

The shift to agents is already happening in every GTM team trying to figure out where the work goes now, and in every builder deciding which platforms are worth investing in. We think the answer comes down to context. The best agents will be the ones that understand a business the way a great marketer, sales rep, and CSM does: what’s normal, what’s working, what’s changing, what’s worked for companies like it.

That’s what HubSpot has spent two decades developing across 280,000+ businesses. And that intelligence is what we’re opening up – to every agent, every partner, and every customer shaping what comes next. We won’t build every answer. But we’ll build what every answer needs.

Categories B2B

Keyword clustering: How to create a strategy for topic authority in 2026

As a content writer with over 7 years of SEO experience, I can confidently say that keyword clustering is a critical technique—even in a world where the SEO landscape has changed significantly.

Keyword clustering builds authority, boosts your business’s web presence, and helps you find your audience wherever they are in their buyer’s journey. But what is keyword clustering, and how does it work? Keep reading to find out.

Table of Contents

Download Now: HubSpot's Free AEO Guide

What is keyword clustering?

Keyword clustering is an SEO technique that groups related keywords with the same search intent and targets them simultaneously on the same page. For example, people searching for “cat toys,” “toys for cats,” and other variations are looking for the same product and will see the same search results when using search engines or answer engines.

Keyword clustering involves targeting a primary keyword and secondary keywords on the same page. The primary keyword is the main term you want to rank for (“cat toys”), and secondary keywords are synonyms and long-tail variants (“toys for cats”).

How keyword clustering builds topic authority

By building your content around central themes and related keywords, you signal to search engines that you are knowledgeable about the topic. It’s as if someone went through my vinyl record collection and noticed I have albums by various punk artists. They’d likely assume I’m pretty knowledgeable about the genre.

If you prove yourself knowledgeable to search engines, then they’ll rank your page higher in search results related to that topic. Other ways keyword clustering builds topic authority include:

Comprehensive coverage: When you cluster keywords, you build a pillar page for a broad topic that connects to multiple “spoke pages” for related subtopics that cover the subject from different angles.

Let’s go back to the cat toys example. A pillar page would cover the broad topic of “cat toys,” and the spoke pages would cover subtopics such as “interactive cat toys,” “cat toys for indoor cats,” and “cat toys for senior cats.”

visual representation of the broad topic "cat toys" being broken into secondary topics "interactive cat toys," "cat toys for senior cats'

Strong internal linking: Clustered content consists of highly related keywords, themes, and intent. Not only does this create a clear semantic picture of your site’s expertise, but it also makes it easy for engines to crawl your site and pass authority from one page to the next.

Full search journey coverage: Clusters typically map to different search intents, from informational to navigational to transactional. By covering all stages of the consumer’s search journey, you capture users at every point in the funnel and reinforce authority signals across query types.

Reduced cannibalization: Disorganized keyword targeting often results in multiple pages competing for the same query, which can cause one page to “cannibalize” another. When pages cannibalize each other, authority, backlinks, and traffic are split, lowering overall rankings.

Strategic keyword clustering assigns each keyword to a single URL, consolidating authority and rankings.

Keyword clustering methods

The three main keyword clustering methods are SERP-based clustering, semantic keyword grouping, and hybrid clustering. I’ll dive into each with details on how they work, pros and cons, and best use cases.

SERP-Based Clustering

Serp-based clustering groups keywords based on shared search results. For example, if two keywords return a significant overlap of the same URLs in Google’s top 10, Google will place these keywords in the same cluster because Google itself has decided one page satisfies both queries.

Pros:

  • Reflects real search engine behavior rather than assumptions
  • Reduces cannibalization risk with high precision
  • Automatically accounts for search intent
  • Data-driven and objective

Cons:

  • Tool-dependent and costly at scale because SERP-based clustering requires live SERP data
  • SERP overlap fluctuates because clusters can shift over time
  • Misses semantic relationships between keywords that don’t yet have overlapping results
  • Can be slow and resource-intensive for large keyword lists

Best-fit scenarios:

  • Competitive niches where cannibalization is a real risk
  • When you need to decide whether to merge or split existing pages
  • Large e-commerce sites mapping product/category pages to queries
  • Any time precision matters more than speed

2. Semantic Keyword Grouping

Semantic keyword grouping sorts keywords by linguistic and conceptual similarity, such as shared root words, synonyms, and interchangeable terms. The idea is that if words mean similar things, they belong together.

Pros:

  • Fast and scalable since no live SERP calls are needed
  • Works well for building content outlines and topic maps
  • Surfaces thematic relationships that SERP data might miss
  • Great for early-stage research before content exists

Cons:

  • Ignores actual search intent; semantically similar does not always equal the same user goal
  • Can incorrectly cluster keywords that Google treats as distinct
  • Less reliable for cannibalization decisions
  • Embedding quality depends heavily on the model or tool used

Best-fit scenarios:

  • Early-stage site planning and topic architecture
  • Content ideation and siloing for new verticals
  • When working with very large keyword sets (10k+) that need fast organization
  • Informational content where intent variation is low

3. Hybrid Clustering

Hybrid clustering combines both methods by typically using semantic grouping as a first pass to quickly organize large keyword sets, then validating or refining clusters using SERP overlap data for high-priority groups. Some tools layer additional signals on top, such as cost-per-click, volume, and click intent.

Pros:

  • Pairs speed with precision
  • Cost efficiency since the semantic pass reduces the SERP calls needed
  • More robust clusters that reflect both meaning and real ranking behavior
  • Flexible because you can tune how much weight each signal carries

Cons:

  • More complex to implement and maintain
  • Requires either a sophisticated tool or a defined manual workflow
  • Can produce conflicting signals that need human judgment to resolve
  • Overhead may be unnecessary for small sites

Best-fit scenarios:

  • Mid-to-large sites building out full topic authority strategies
  • SEO teams running regular content audits and gap analyses
  • When you need both strategic content planning and tactical page decisions
  • Agencies managing multiple clients across different industries

So, how do you choose the best method for your SEO strategy? I suggest starting with semantic keyword grouping if your focus is discovery, i.e., you’re mapping a new niche, planning your site’s structure, or working with a massive raw keyword list.

Use the SERP-based method when the stakes are high—such as when you’re merging pages, deciding on URL structure, or working in a competitive space where the wrong cluster can lead to cannibalization on your site.

Finally, go hybrid if you’re building a sustained content operation where both strategic planning and tactical execution need to happen consistently at scale.

The method isn’t a fixed choice; in fact, most mature SEO workflows move through all three, using each at the right stage of the process.

How to do keyword clustering

Step 1: Keyword Collection & Data Enrichment

Before clustering anything, you need a comprehensive, enriched keyword set. In my experience, thin data produces weak clusters.

Sources to pull from:

  • Google Search Console (queries you already rank for)
  • Keyword research tools (Ahrefs, Semrush, Moz)
  • Competitor gap analysis
  • Autocomplete and People Also Ask scrapes
  • Internal site search data

Enrich every keyword with:

  • Search volume
  • Keyword difficulty
  • CPC (signals commercial intent)
  • Current ranking position
  • Search intent classification (informational, navigational, commercial, transactional)

The intent classification is critical because it’s your first filter before any clustering logic is applied. Remember, keywords with fundamentally different intents should never be clustered together, regardless of semantic similarity.

Step 2: Intent Segmentation

Split your keyword list by intent before clustering. This prevents the most common clustering mistake: grouping keywords that share a topic but serve completely different user needs.

A user searching “what is a CRM” and “buy CRM software” are on opposite ends of the journey. Putting them in the same cluster produces a page that satisfies neither.

Intent categories to segment by:

  • Informational — questions, how-tos, definitions (“how does keyword clustering work”)
  • Commercial — comparisons, reviews, best-of lists (“best keyword clustering tools”)
  • Transactional — purchase or signup-ready (“keyword clustering tool free trial”)
  • Navigational — brand or destination-specific (“Ahrefs keyword clustering”)

Once segmented, cluster within each intent category. This keeps your content purpose-built for a specific user state.

Step 3: Apply Your Clustering Method

Using the method appropriate for your scale and goal (SERP-based, semantic, or hybrid as covered earlier), group your intent-segmented keywords into clusters. Each cluster should:

  • Have one clear head term (the primary keyword that defines the cluster’s topic)
  • Contain supporting long-tail variants that a single page can address
  • Represent a single search intent throughout
  • Be distinct enough from other clusters that content overlap is minimal

A practical threshold for SERP-based clustering: if two keywords share 3 or more of the same top-10 URLs, they belong in the same cluster. If the overlap is 0 or 1, they likely warrant separate pages.

For semantic clustering, use cosine similarity scores between keyword embeddings. A similarity threshold of 0.75–0.85 typically produces clean clusters without over-merging.

Step 4: Map Clusters to a Pillar Architecture

Once clusters are formed, assign them to a content hierarchy. This is where clustering becomes a structural strategy rather than just an organizational exercise.

The three-tier architecture:

Tier 1 — Pillar Pages: Broad, high-volume, high-difficulty topics. These pages aim to be the definitive resource on a subject. Pillar pages create the hub that gives surrounding content authority rather than trying to rank for every keyword in their cluster.

Tier 2 — Cluster Pages: Each keyword cluster from Step 3 maps to one cluster page. These go deep into a specific subtopic, targeting the long tail and supporting keywords within their cluster. They draw authority from the pillar and return it via internal links.

Tier 3 — Supporting Content: Highly specific pages — FAQs, glossary entries, case studies, data pages — that target very narrow queries and feed authority upward into cluster pages.

Every piece of content should know its tier, its parent pillar, and its sibling cluster pages to inform your internal linking strategy directly.

Step 5: Internal Linking Architecture

Internal linking is where your cluster map becomes a living authority engine. Most sites treat internal links as an afterthought. In a properly executed cluster strategy, they serve as structural load-bearing elements.

The core principle: Links pass PageRank and topical relevance signals. A well-linked cluster focuses on the pages that need to rank, while also indicating the semantic relationships between pages to search engines.

How to build your internal link structure:

Pillar ↔ Cluster links (bidirectional) Every cluster page links to its pillar with keyword-rich anchor text. The pillar links out to each of its cluster pages. This bidirectional flow creates a closed authority loop — equity doesn’t leak out of the topic silo.

Cluster ↔ Cluster links (contextual): Related cluster pages should link to each other when there’s genuine contextual relevance. A page on “keyword research process” should naturally link to “keyword clustering methods” — these links reinforce the semantic neighborhood to search engines.

Anchor text strategy: Use exact or close-variant anchor text for your most important links. Google uses anchor text as a relevance signal — vague anchors like “click here” or “learn more” waste the opportunity. Vary anchors naturally to avoid over-optimization flags, but do so deliberately.

Link depth management: Important cluster pages should be reachable within 2–3 clicks from the homepage. Pages buried 5+ clicks deep receive little crawl attention and minimal PageRank. Your cluster architecture should naturally enforce shallow link depth across topic areas.

Avoiding orphan pages: Every page in your cluster must have at least one inbound internal link. Orphan pages receive no PageRank, get crawled infrequently, and effectively don’t exist in your authority structure, no matter how good the content is.

Crawl budget efficiency: For large sites, internal linking directly affects which pages get crawled and how often. A tightly linked cluster structure ensures crawlers efficiently discover and re-crawl your highest-priority content, while thin or duplicate pages get naturally deprioritized.

Step 6: AEO — Answer Engine Optimization

Search is no longer just about ranking in the 10 blue links. Answer engines — including Google’s AI Overviews, SGE, Bing Copilot, and standalone LLMs like ChatGPT and Perplexity — pull content directly into synthesized responses.

AEO is the practice of structuring your content so it is selected as the source.

Why keyword clustering directly enables AEO: Answer engines favor sources that demonstrate deep, comprehensive coverage of a topic. A well-clustered content library signals exactly that — you haven’t written one article on a subject, you’ve built an authoritative knowledge base around it.

Structural elements that improve answer engine selection:

Direct answer formatting: Place a concise, direct answer to the primary question within the first 100 words of any informational page. Answer engines frequently pull from opening paragraphs. Don’t bury the answer after three paragraphs of preamble.

FAQ and Q&A blocks. Each cluster page should include a structured FAQ section addressing the secondary questions within its keyword cluster. These map directly to People Also Ask boxes and are prime extraction targets for AI Overviews. Use proper FAQ schema markup to make extraction easier.

Schema markup at scale. Implement structured data across your cluster:

  • Article schema on all editorial content
  • FAQPage schema on Q&A sections
  • HowTo schema on process content
  • Breadcrumb List schema to reinforce your content hierarchy
  • Speakable Specification for voice-optimized content

Schema provides machine-readable confirmation of what your content is about, increasing selection confidence.

Snippet-optimized formatting: Answer engines extract content that’s already formatted for quick consumption. Use definition blocks for concepts, numbered lists for processes, comparison tables for multi-option topics, and short declarative sentences for factual claims. If your content reads like an answer, it’s treated like one.

Passage-level optimization, Google’s passage indexing means individual sections of a page can rank independently. Each H2/H3 section in your cluster pages should be self-contained enough to answer its own specific question — don’t rely on surrounding context to make a section meaningful.

Step 7: Semantic Search Optimization

Semantic search is the underlying technology that enables clustering. Understanding it deeply lets you write content that search engines can correctly interpret, not just index.

Now you have the steps, here’s how semantic search actually works:

Modern search engines don’t match keywords — they map meaning. Google’s language models (built on transformer architecture similar to BERT and MUM) convert queries and documents into high-dimensional vectors and find the closest meaning match. This means:

  • Synonyms and paraphrases rank as well as exact keywords
  • Context within a document affects how each sentence is interpreted
  • Co-occurring terms signal topical depth even without exact keyword repetition
  • The absence of expected related terms can lower a page’s topical relevance score

When writing for semantic in depth, remember these elements:

Entity coverage: Identify the key entities (people, places, concepts, products) that belong to your topic cluster and ensure your content references them naturally.

If you’re writing about “content marketing strategy,” semantic completeness means covering entities such as editorial calendars, buyer personas, content distribution, and funnel stages—not just repeating the head keyword.

Co-occurrence and LSI signals. While the term “LSI keywords” is technically outdated, the underlying principle is valid: content that naturally uses the vocabulary of a topic area scores higher for semantic relevance.

Use tools like Clearscope, Surfer SEO, or MarketMuse to identify the terms that top-ranking pages consistently use, then ensure your content covers the same conceptual ground.

Topic completeness vs. keyword density: Semantic search penalizes thin coverage as much as it rewards depth. A page that mentions a keyword 20 times but covers only one dimension of a topic will lose to a page that mentions it 5 times but thoroughly addresses related concepts, common questions, counterarguments, and practical applications.

Contextual relevance through proximity. The semantic relationship between your pages matters as much as the content within them. When your cluster pages link to each other with descriptive anchor text, you’re building a contextual graph that search engines can interpret.

Two pages linked by relevant anchors are considered semantically related — this is essentially manual knowledge graph construction.

Structured data as semantic markup, Schema.org vocabulary is a direct semantic signal. When you mark up a page with structured data, you’re not just helping rich results — you’re providing machine-readable semantic labels that override any ambiguity in your natural language content.

A page with an Article schema, about a specific Topic entity, authored by a known Person entity, is semantically unambiguous.


4 Best keyword clustering tools

1. Keyword Insights

What we like: Keyword Insight’s SERP-based clustering engine is the most accurate I’ve tested — it groups keywords based on real URL overlap in Google’s top results, so clusters reflect how search engines actually think, not just how words sound similar.

Generating content briefs directly from clusters saves our team hours, and the GSC integration means we’re working with live ranking data rather than guesswork.

Best for: SEO professionals and content teams who need a dedicated, precision-first clustering tool with a full workflow from research to brief without paying for a bloated all-in-one suite.

keyword insights

Source

2. Semrush Keyword Strategy Builder

What we like: Semrush’s visual topic map offers a useful planning interface that shows how pillar topics and subtopics relate, and it changes how we think about content architecture.

Best for: Marketing teams and agencies already running their SEO operations inside Semrush who want clustering baked into a single, end-to-end workflow rather than managing a separate tool.

semrush keyword strategy builders

Source

3. Ahrefs Keywords Explorer

What we like: Ahrefs Parent Topic methodology is fast and efficient, especially for large-scale keyword research across multiple markets or clients.

Best for: Research-heavy teams who need to process large keyword sets quickly, or anyone already using Ahrefs as their primary SEO platform who wants reliable clustering without adding another tool to the stack.

ahrefs keywords explorers

Source

4. LowFruits

What we like: The pay-as-you-go model is convenient, and clustering itself is free; credits are only consumed for deeper SERP analysis.

For niche sites and smaller projects, the signal-to-noise ratio is excellent: clusters are clean, actionable, and don’t require a steep learning curve to interpret.

Best for: Bloggers, niche site operators, and small teams who want solid SERP-based and semantic clustering without the overhead of an enterprise platform — especially useful when budget flexibility matters more than feature depth.

lowfruits

Source

Frequently asked questions about keyword clustering.

When should you not use keyword clustering?

Keyword clustering loses its value when your site is too new to have established any topical authority. At that stage, a single well-targeted pillar page will outperform a half-built cluster every time.

It’s also counterproductive when applied to a keyword list that hasn’t been intent-segmented first, since clustering mixed-intent keywords produces pages that satisfy no one.

If you’re running a single-product or highly niche site with a limited keyword universe, the overhead of a full cluster architecture may outweigh the benefit. In those cases, a flat content structure with strong internal linking often performs just as well.

How many keywords belong in one cluster?

There’s no universal number, but most well-structured clusters contain 5-20 keywords targeting a single page. The right size depends on how much variation exists within the topic — a broad informational cluster might support 15–20 long-tail variants, while a transactional cluster might only need 5–8 tightly related terms.

The real test isn’t quantity but whether a single piece of content can naturally address every keyword in the cluster without diluting its focus. If you’re stretching the page to cover keywords that feel tangential, that’s a signal to split the cluster.

Should every cluster have a pillar page?

Not necessarily — the pillar page model works best when you have enough cluster content to justify a central hub, typically 6–10 supporting pages minimum. For smaller clusters focused on narrow subtopics, a well-optimized cluster page can serve as a standalone asset without a dedicated pillar above it.

That said, every cluster should at least map to a broader topic tier, even if a full pillar page doesn’t exist yet — this keeps your content architecture scalable as you publish more. Think of the pillar as something you grow into, not a prerequisite for starting.

How do you prevent keyword cannibalization with clusters?

The most effective prevention is assigning clear keyword ownership during the clustering phase — each keyword should map to exactly one URL before any content is written. Use a tracking sheet that logs the primary keyword, target URL, and cluster assignment for every page, making conflicts visible before they become ranking problems.

If cannibalization already exists, run a SERP overlap check.

If two of your pages appear in the same results for the same query, consolidate them or use canonical tags to declare the authoritative version. Keeping cluster boundaries tight and reviewing your keyword map quarterly prevents overlap from silently accumulating over time.

What’s the best way to validate cluster intent quickly?

The fastest method is a manual SERP check: search your primary cluster keyword and scan the format, content type, and language of the top 5 results in under 2 minutes. If the results are predominantly listicles, your cluster is informational; if they’re product pages or comparison tables, it’s commercial or transactional.

A secondary check using the People Also Ask box will surface the adjacent questions your cluster content needs to answer, confirming whether your keyword grouping aligns with how users actually think about the topic.

For larger lists, tools like Semrush’s intent filter or Keyword Insights’ automatic intent classification can validate hundreds of clusters in a single pass.


Categories B2B

AEO prompt tracking for marketing teams

You already track and analyze your SEO strategy — keyword rankings, organic traffic, SERP positions. But when a prospect asks ChatGPT, Perplexity, or Google AI Overviews a buying question and your brand doesn’t appear in the answer, traditional rank tracking can’t tell you that. AEO prompt tracking helps you measure brand visibility within AI-generated answers by monitoring whether (and how) your brand gets cited when real AI prompts are run across the engines your audience is actually using. For marketing leaders, SEO managers, and demand gen teams, it’s the measurement layer that closes the gap between “we publish great content” and “we can prove AI search drives pipeline.”

Get Started with HubSpot's AEO Tool

The challenge is that most teams trying to operationalize AEO today are stuck. Prompt-level visibility is limited, AI search data is disconnected from web analytics and CRM, attribution to leads and revenue is unclear, and choosing the best tools for monitoring AEO citations in answer engines feels overwhelming when the category is still emerging. The result is inconsistent reporting, governance gaps, and AEO efforts that stall before they reach a budget conversation.

This guide is built to fix that. Below, I’ll walk you through:

  • The metrics marketing should own
  • How to build and maintain a prompt library
  • How to close content gaps that cost you citations
  • How to connect AEO prompt tracking tools step by step (with HubSpot’s AEO Product as your CRM-connected baseline)

Everything here is structured around a single goal: giving marketing teams a repeatable, data-driven framework that ties AI search visibility directly to pipeline and revenue impact — anchored by HubSpot AEO. Let’s get started.

Table of Contents

What Is AEO Prompt Tracking and Why It Matters

a hubspot-branded image explaining what AEO prompt tracking is in plain English

AEO prompt tracking is the practice of monitoring whether (and how) your brand, content, or URLs appear in AI-generated answers when users ask specific prompts across large language models.

Unlike traditional SEO rank tracking, which measures where your page falls on a search engine results page for a given keyword, AEO prompt tracking measures your visibility inside the answer itself (i.e., the citation, the mention, the recommendation that an answer engine surfaces when a user asks a question like “What’s the best CRM for small businesses?” or “How do I set up marketing automation?”).

That distinction matters more than it might seem at first glance. SEO rank tracking tells you your position on a list. AEO prompt tracking tells you whether you made it into the conversation. Think of it this way: SEO rank tracking answers “Where do I rank?” and AEO prompt tracking answers “Am I even in the AI’s answer?”

Pro tip: Learn all about AEO in under 30 minutes with this video from the HubSpot Marketing YouTube channel.


How AEO Prompt Tracking Differs from SEO Rank Tracking

AEO prompt tracking differs from SEO rank tracking in four core ways: what you measure, where you measure it, how stable the outputs are, and how attribution works. The underlying shift is that SEO rank tracking measures stable URL positions on a search results page, while AEO prompt tracking measures non-deterministic brand presence inside AI-generated answers.

  • What you’re measuring. SEO tracks keyword-to-URL position. AEO prompt tracking measures whether a brand or source appears — and in what context — within an AI-generated response to a specific prompt.
  • Where you’re measuring. SEO focuses on Google (and occasionally Bing). AEO prompt tracking requires coverage by engine and simultaneous visibility across ChatGPT, Perplexity, and Gemini.
  • How often outputs change. SERP positions update with algorithm refreshes. Answer engine outputs can change with every model update, retrieval-augmented generation pull, or even between identical prompts in the same session.
  • Attribution complexity. A SERP click generates a clear referral URL. An AI citation may drive traffic without trackable clicks, making attribution to leads and pipeline significantly harder.

This is exactly why the best tools for monitoring AEO citations don’t rely on a single engine. Instead, they run prompt-level monitoring across multiple answer engines on a scheduled cadence, tracking citation share, sentiment, and competitive positioning over time.

Pro tip: HubSpot AEO is built to handle these differences from the inside out. It runs scheduled prompts across ChatGPT, Gemini, and Perplexity and rolls coverage, citation share, and competitor comparison into a single AI visibility score inside Marketing Hub Pro and Enterprise.

Prompt-Level Monitoring Across Multiple Answer Engines

Prompt-level monitoring means selecting a defined library of prompts that reflect how your target audience actually queries answer engines, then systematically tracking how each answer engine responds, thus revealing:

  • Who gets cited
  • What content gets surfaced
  • How your brand’s citation share compares to competitors

Now, in practice, this looks like running a set of 50 to 200 prompts weekly across ChatGPT, Perplexity, and Gemini, then logging which brands, URLs, or domains appear in each response.

The challenge is that no single tool does this flawlessly yet, and manual tracking breaks down fast. This is one of the key pain points driving demand for AEO prompt tracking tools: marketing leaders need consistent, repeatable data across engines, not one-off spot checks.

HubSpot AEO is built to close that gap, automating prompt runs across ChatGPT, Gemini, and Perplexity inside Marketing Hub Pro and Enterprise so the data stays fresh and connected to the CRM.

Pro tip: Citation share (the percentage of answers where your brand or source appears) becomes your core AEO visibility metric, functioning as the prompt-level equivalent of share of voice in traditional search.

AEO Prompt Tracking’s Role in the Growth Stack

AEO prompt tracking’s role in the growth stack is to feed content updates, sourcing decisions, and campaign strategy with prompt-level visibility data — connecting AI search insights to broader marketing and revenue operations. ​​HubSpot’s own marketing team used AEO methodology to increase leads by 1,850%, validating the approach on its own brand before building the tools to help other businesses do the same.

Here’s more detail on each below:

  • Content updates. When prompt monitoring reveals that a competitor is consistently cited for a topic you should own, that’s a direct signal to update, restructure, or create content optimized for AI retrieval. AEO prompt tracking helps you measure brand visibility within AI-generated answers so you can prioritize the right content refreshes. HubSpot AEO surfaces these gaps as prioritized, plain-language recommendations so content teams know exactly which pages to update first.
  • Sourcing and link strategy. Tracking which sources answer engines pull from (and how often) informs where to invest in authoritative backlinks, data partnerships, and original research that answer engines are more likely to cite.
  • Campaign strategy. If your brand consistently appears in AI answers for bottom-of-funnel prompts but disappears at the awareness stage, that gap shapes where you invest in thought leadership, paid amplification, and distribution. Inside Marketing Hub Pro and Enterprise, that funnel-stage view sits alongside campaign reporting, so AEO insights flow directly into existing planning.

The bottom line: AEO prompt tracking isn’t a replacement for SEO rank tracking. It’s the additional measurement layer that accounts for where your audience is increasingly going for answers.

Pro tip: HubSpot AEO provides a baseline view of AI search visibility, giving marketing teams a starting point for tracking how their brand appears across AI-generated results without stitching together multiple disconnected tools. For teams already running CRM, reporting, and campaign workflows inside HubSpot, this creates a more direct path from AEO prompt tracking data to the attribution and pipeline metrics that drive budget decisions.

AEO Metrics That Marketing Should Own

AEO metrics that marketing should own are the five KPIs that make AI search visibility measurable, comparable to competitors, and tied to pipeline: coverage by engine, citation frequency and placement, share of voice, referral traffic from answer engines, and demand and pipeline influence. Together, they turn AEO prompt tracking from a concept into a measurable discipline that informs content strategy, campaign planning, and revenue reporting.

Every time a user asks a question, the answer engine assembles an answer, and that answer either includes your brand or it doesn’t. The critical shift for marketing teams is recognizing that these AI-generated answers are analyzable. Marketing teams can systematically track:

  • Which brands get cited
  • How often they’re cited
  • In what context they appear
  • Which engines they’re surfaced on

Below are the five KPIs marketing should own for AEO prompt tracking. Each is measurable inside HubSpot AEO and connectable to pipeline through Marketing Hub Pro and Enterprise.

a hubspot-branded image highlighting AEO metrics that marketing should own


1. Coverage by Engine

Coverage by engine measures whether your brand appears in AI answers on each platform independently. Marketers should examine visibility across:

  • ChatGPT
  • Perplexity
  • Gemini

This matters because answer engines don’t behave the same way. Your brand might be consistently cited in Perplexity (which leans heavily on web retrieval and source attribution) but completely absent from Gemini’s responses for the same prompt. Without engine-level breakdowns, you’re working with an average that hides critical gaps.

To measure it with precision, run your prompt library across each engine and log a binary yes/no for brand presence per prompt, per engine. Your coverage rate is the percentage of prompts where your brand appears, calculated per engine.

Pro tip: The best tools for monitoring AEO citations automate this across engines on a set schedule, so you’re not manually querying five platforms every week. HubSpot AEO, for example, runs prompts on a weekly cadence across ChatGPT, Gemini, and Perplexity and surfaces engine-level visibility breakdowns inside Marketing Hub.

2. Citation Frequency and Placement

Citation frequency measures how many times your brand, domain, or specific URLs are cited across a defined set of prompts. Citation placement tracks where in the answer you appear, which includes:

  • First source mentioned
  • Mid-answer reference
  • Footnote-level attribution

But, both matter for different reasons:

  • Frequency tells you how broadly your content is being pulled into AI answers. A brand cited in 40 out of 200 tracked prompts has a 20% citation rate. It’s a concrete, reportable number.
  • Placement tells you how prominently the answer engine positions your brand. Being the first-cited source in an answer carries more implied authority than appearing as the fourth link in a footnote cluster.

Pro tip: Track citation frequency and placement separately. A brand with moderate frequency but consistent first-position placement may have stronger effective visibility than a competitor cited more often but always buried. HubSpot AEO surfaces both citation visibility and competitor positioning in a single view within Marketing Hub Pro and Enterprise, so the comparison happens without manual cross-referencing.

3. Share of Voice (Citation Share)

Citation share shows how often a brand or source appears in AI answers compared with competitors for the same set of prompts. This is the AEO equivalent of organic share of voice, and for many marketing leaders, it’s the single most useful metric for benchmarking. Here’s how it works in practice:

  • Define a prompt library of 100 to 200 prompts mapped to your priority topics and funnel stages.
  • Run each prompt across your target answer engines.
  • Log every brand or domain cited in each response.
  • Calculate your citation share as: (number of responses citing your brand ÷ total responses) × 100.

If your brand appears in 35 out of 100 tracked responses and your top competitor appears in 52, your citation share is 35% versus their 52%. That gap becomes a strategic input (not a guess) for content investment and competitive positioning.

4. Referral Traffic From Answer Engines

Referral traffic measures the actual clicks and visits arriving at your site from AI-generated answers. This is where AEO prompt tracking connects to web analytics — and where most teams hit a wall because attribution is fragmented. The challenge is that not all answer engines pass clean referral data. Here’s the current state of each.

  • Perplexity: Typically passes referral parameters, making it the most trackable answer engine for click attribution.
  • Google AI Overviews: Traffic often blends into standard Google organic referrals in analytics platforms, requiring filtering or UTM-based workarounds.
  • ChatGPT: Citations may generate visits that show as direct or unattributed traffic, since users often copy-paste URLs rather than clicking inline links.

Pro tip: Set up dedicated segments in your analytics platform for known AI referral sources, and compare trends in direct traffic alongside AEO citation changes. (A spike in direct visits that correlates with increased AI citation frequency is a strong directional signal, even without perfect click-level attribution.) For teams using Marketing Hub Pro and Enterprise, HubSpot AEO citation data sits alongside web analytics and contact records, making this correlation work native rather than a manual stitch.

5. Demand and Pipeline Influence

Demand and pipeline influence measures whether AEO visibility translates into leads, opportunities, and revenue. AEO prompt tracking helps marketing teams measure brand visibility within AI-generated answers, but visibility alone doesn’t close deals.

The operational question is whether AI-sourced traffic converts, and whether that conversion path is traceable. Wiring this together requires three things:

  • AI referral traffic segmented in your CRM. Contacts arriving from identified AI referral sources should be tagged at the source level so you can track them through lifecycle stages.
  • Prompt-to-page mapping. Knowing which prompts drive traffic to which landing pages lets you tie AEO visibility to specific conversion points.
  • Pipeline attribution. Contacts influenced by AI-referred sessions need to flow into your existing attribution models — whether first-touch, multi-touch, or revenue-weighted.

Pro tip: This is where the CRM connection earns its keep. Inside Marketing Hub Pro and Enterprise, HubSpot AEO ties prompt visibility data directly to contact records, lifecycle stages, and deal pipeline. AEO impact reports use the same attribution logic that already drives budget decisions.

Next, let’s walk through how to build a functional, easily scalable prompt library that powers all five of these KPIs.

How to Build Your AEO Prompt Library and Taxonomy

Building an AEO prompt library and taxonomy is a three-step process: seed prompts from personas, journeys, and pain points; cluster them by topic, intent, and region with funnel-stage tags; and assign ownership, target pages, source gaps, and a QA cadence to each entry. The library is the foundation. It determines:

  • What marketing teams monitor
  • How visibility data is organized
  • Whether tracking connects to actual business outcomes

A poorly built library gives marketing teams noise. A well-structured one becomes a decision-making asset that ties AI search visibility directly to content strategy, campaign planning, and pipeline.

a hubspot-branded image explaining how to build an AEO prompt library and taxonomy

Most teams stall here because they don’t have a repeatable process for choosing, organizing, and maintaining prompts. Below is a step-by-step build:

Step 1: Seed your prompt list from personas, journeys, and pain points.

Seed the prompt list using three sources — buyer personas, customer journey stages, and documented pain points — then layer in core category terms the brand should own. The list should reflect how the target audience actually asks questions in answer engines, not how internal teams think about the product. Here’s how:

  • Start with personas. For each buyer persona, list the questions they’d ask an answer engine at each stage of awareness. A VP of Marketing asks different prompts than an SEO manager, even about the same topic. “What’s the best CRM for mid-market SaaS?” is a different prompt (with different citation patterns) than “How do I set up lead scoring in HubSpot?”
  • Map to journey stages. Awareness-stage prompts tend to be category-level (“What is AEO prompt tracking?”). Consideration-stage prompts are comparative (“Best tools for monitoring AEO citations”). Decision-stage prompts are specific (“Does [Brand X] integrate with Salesforce?”). You need coverage across all three.
  • Mine pain points. Sales team call notes, support tickets, community forums, and review sites are prompt goldmines. The language your customers use to describe problems is often the exact phrasing they type into ChatGPT or Perplexity.
  • Add category terms. Include the core category and subcategory terms your brand should own. These become the prompts where citation presence is non-negotiable. If you sell marketing automation software, prompts like “best marketing automation platforms” and “marketing automation vs. email marketing” belong in your library regardless of persona.

Pro tip: Aim for 100 to 200 seed prompts to start. Fewer than 50 won’t give you statistically meaningful citation data. More than 300 becomes operationally unwieldy unless you have automation in place. Inside Marketing Hub Pro and Enterprise, HubSpot AEO uses CRM data to suggest prompts automatically — so teams get business-context-driven suggestions rather than starting from a blank page.

Step 2: Cluster by topic, intent, and region, then tag by funnel stage.

Clustering by topic, intent, and region — then tagging each prompt by funnel stage — converts a flat list into a structured tracking system that supports segmented analysis and cross-functional decision-making. A flat list of 200 prompts isn’t usable for reporting; the taxonomy layer is what makes the library queryable. To do this, cluster your prompts across three dimensions:

  • Topic cluster. Group prompts by subject area — the same way you’d organize a keyword universe for SEO. Example clusters: “CRM selection,” “lead scoring,” “marketing attribution,” “AEO prompt tracking.” (Each cluster should map to a content pillar or product category your team owns.)
  • Intent type. Classify each prompt by user intent: informational (learning), commercial (comparing), navigational (finding a specific brand or product), or transactional (ready to act). Intent determines which content assets and pages should be cited in AI answers, and, most importantly, which gaps to flag.
  • Region and language. If your audience spans multiple markets, the same prompt asked in English, Spanish, or German can produce entirely different citation results. Coverage by engine tracks visibility across ChatGPT, Perplexity, and Gemini, but each engine also behaves differently by language and locale. Tag prompts with their target region so you can segment reporting accordingly.

Once clustered, assign every prompt its respective funnel stage, which should be:

  • Top
  • Middle
  • Bottom

This is what lets you report AEO visibility by funnel position, not just by topic. When leadership asks, “Are we visible in AI answers for bottom-of-funnel buying prompts?” marketing teams need the tagging in place to answer in seconds, not hours.

Pro tip: HubSpot AEO inside Marketing Hub Pro and Enterprise lets marketing teams filter prompt tracking results by buyer’s journey phase and product or service relevance, making funnel-stage reporting available without building a separate tagging system.

Step 3: Assign ownership, map target pages, identify source gaps, and set QA cadence.

Each prompt in the library needs four metadata fields to be actionable: an owner, a target page, source gaps, and a status. Assigning ownership and tracking source gaps is where most AEO prompt tracking programs either become operational or die in a spreadsheet.

  • Owner. Assign a specific person (content strategist, SEO manager, product marketer) responsible for each prompt cluster’s visibility. Without ownership, no one acts on citation drops or competitive losses.
  • Target page. For each prompt, define the ideal URL you want answer engines to cite. This is your “target page” (also known as the asset that should appear in the answer. If no suitable page exists, that’s a content gap flagged for production).
  • Source gaps. After running your first round of AEO prompt tracking, note where your brand isn’t cited but should be. Source gaps are the difference between your target page mapping and the actual citations answer engines return. These gaps become your content and optimization backlog.
  • Status. Track each prompt’s monitoring status: active (currently tracked), paused (deprioritized), or gap (no content exists to support citation). This keeps your library clean and your reporting accurate.

In short, QA cadence is the operational heartbeat. Set a regular schedule (biweekly or monthly) to review prompt library health and ask these questions:

  • Are new prompts emerging from product launches, market shifts, or competitive moves that need to be added?
  • Are any active prompts returning zero citations across all engines for three or more consecutive cycles? (If so, investigate whether the prompt is still relevant or whether your content needs updating.)
  • Are ownership assignments current, or have team changes left gaps?
  • Are target pages still live and optimized, or have redirects or content decay created broken mappings?

The prompt library and taxonomy aren’t a one-time build. They’re a living system that gets sharper as marketing teams layer in citation data, competitive benchmarks, and pipeline attribution over time.

The teams that treat AEO prompt tracking as an ongoing operational discipline, with clear ownership, defined target pages, documented source gaps, and a real QA cadence, are the ones who turn AI search visibility into a measurable growth input rather than an unstructured experiment.

How to Connect AEO Prompt Tracking Tools

Connecting AEO prompt tracking tools is a five-step process: start with a CRM-integrated platform like HubSpot AEO as the operational hub, layer in supplemental tools for deeper prompt-level monitoring, connect web analytics to capture AI referral traffic, wire data into pipeline and attribution reporting, and automate monitoring and alerting. The goal is a connected system, not a tool sprawl.

The AEO tooling landscape has expanded fast in the last 18 months, and most marketing teams now have access to more options than they can realistically operationalize. The right approach is to build a layered stack where each tool plays a defined role, with the CRM-integrated platform anchoring attribution and reporting.

a hubspot-branded image explaining how to connect AEO prompt tracking tools step-by-step


Step 1: Activate HubSpot AEO as your baseline.

HubSpot AEO combines prompt-level visibility tracking across ChatGPT, Gemini, and Perplexity with native CRM integration, eliminating the data-stitching overhead that breaks most early AEO programs. It’s built directly into Marketing Hub Pro and Enterprise, or available as a standalone solution for $50/month with no hub required. Starting here eliminates the most common pain point teams hit early:

  • Disconnected tools that force manual data stitching between an AEO monitoring platform and the CRM
  • A web analytics tool that doesn’t pass AI referral source data into the CRM automatically
  • A CRM that doesn’t surface citation visibility alongside contact and pipeline records

With all that in mind, here’s how to get started:

  • Enable HubSpot AEO within your HubSpot portal. Access it through your HubSpot settings. The product surfaces how your brand appears across AI-generated results, giving you an initial visibility baseline without requiring a separate vendor login or data export.
  • Connect it to your existing HubSpot reporting. Because HubSpot AEO lives inside HubSpot, citation visibility data can be viewed alongside your traffic analytics, contact records, and deal pipeline (no API middleware or third-party connectors required for baseline reporting).
  • Establish your starting metrics. Before layering in additional tools, document your initial citation share, coverage by engine, and top-cited pages. This baseline is what you’ll measure all future improvements against.

Step 2: Layer in a dedicated prompt monitoring platform.

HubSpot AEO covers ChatGPT, Gemini, and Perplexity with CRM-connected visibility tracking. For broader engine coverage — specifically Copilot and Google AI Overviews — and for high-volume prompt-level monitoring (running hundreds of prompts on a scheduled cadence), most teams will also need a dedicated AEO monitoring platform. The best tools for monitoring AEO citations offer capabilities that complement your HubSpot baseline:

  • Scheduled prompt execution. Automatically run your full prompt library (100 to 200+ prompts) across ChatGPT, Perplexity, Gemini, Copilot, and Google AI Overviews on a weekly or biweekly cadence.
  • Citation extraction and logging. Parse each AI-generated response to identify which brands, domains, and URLs are cited, and in what position within the answer.
  • Competitive benchmarking. Track citation share for your brand versus named competitors across the same prompt set over time.
  • Historical trending. Store response data over months so you can identify citation gains, losses, and patterns tied to content updates or model changes.

To connect a dedicated monitoring platform to your HubSpot workflow, do the following:

  • Export citation data on a regular cadence (weekly or biweekly CSV exports at minimum; API integration if the platform supports it).
  • Map citation metrics to HubSpot custom properties or reporting dashboards. Create custom properties for key metrics (i.e., citation share, coverage by engine, citation trend) so they’re reportable inside HubSpot alongside traffic and pipeline data.
  • Align prompt clusters to HubSpot campaign objects. If your prompt library is organized by topic cluster and funnel stage, map those clusters to HubSpot campaigns so you can report AEO visibility within the same campaign-level performance views your team already uses.

Pro tip: When evaluating the best tools for monitoring AEO citations, prioritize platforms that offer structured data exports (CSV or API) with per-prompt, per-engine granularity. Aggregate-only exports make it impossible to connect citation data to specific pages, campaigns, or pipeline segments inside your CRM.

Step 3: Connect web analytics to capture AI referral traffic.

AEO prompt tracking shows where the brand is cited. Web analytics tells you whether those citations drive visits — connecting the two closes the gap between “visibility” and “traffic.” To help you close that gap, here’s a closer look at the connection workflow:

  • Create AI referral segments in your analytics platform. Set up channel groupings or traffic segments for known answer engine referrers: Perplexity (the most reliably trackable), Google AI Overviews (often requires filtering within Google organic), and any other engines passing identifiable referral parameters.
  • Sync analytics data to HubSpot. If you’re using Google Analytics or a similar platform, ensure that session-level source data flows into HubSpot contact records — either through native integration, HubSpot’s tracking code, or UTM-based workflows. The goal is to tag contacts who arrived via AI-referred sessions so they’re identifiable in your CRM.
  • Correlate citation changes with traffic trends. Build a simple reporting view that overlays your AEO citation data (from Step 2) with AI referral traffic (from analytics). When citation share increases for a prompt cluster and AI referral traffic to the mapped target pages rises in the same period, that’s your strongest directional evidence that AEO visibility drives engagement.

Pro tip: Marketing teams that set up AI referral segments early — even before their attribution is perfect — start accumulating historical data that becomes increasingly valuable as answer engine referral tracking matures across the industry.

Step 4: Wire AEO data into pipeline and attribution reporting.

Wiring AEO data into pipeline and attribution reporting is what turns AEO prompt tracking from a content performance metric into a revenue conversation. The connection between citation visibility and pipeline requires deliberate CRM configuration.

  • Tag AI-influenced contacts. Using the AI referral segments from Step 3, apply a lifecycle-stage-aware tag or custom property in HubSpot that flags contacts whose first or assisted touch came from an AI-referred session. This property becomes your filter for AEO-influenced pipeline reporting.
  • Build an AEO attribution dashboard. In HubSpot, create a custom dashboard that reports on contacts tagged as AI-influenced, segmented by lifecycle stage (lead, MQL, SQL, opportunity, customer). Overlay this with citation share trends to show leadership the correlation between visibility investments and pipeline movement.
  • Connect prompt clusters to revenue. Map your AEO prompt clusters (from your prompt taxonomy) to any HubSpot campaigns or content assets they correspond to. (When a contact enters pipeline after visiting a page mapped to a high-priority prompt cluster, that prompt cluster gets partial attribution credit, making your AEO investment defensible in budget conversations.)

Step 5: Automate monitoring and alerting.

Automating monitoring and alerting eliminates the manual weekly check-ins that AEO prompt tracking otherwise depends on. Once tools are connected, the recurring operational tasks should run on autopilot.

  • Set up scheduled citation reports. Configure your monitoring platform to deliver weekly or biweekly citation summaries (either via email or directly into a Slack channel) highlighting citation share changes, new competitive entries, and citation losses.
  • Create HubSpot workflow triggers. Build workflows that fire when AI referral traffic to a target page crosses a threshold (positive or negative), flagging the responsible content owner to investigate whether a citation gain or loss is driving the change.
  • Establish quarterly review automation. Schedule recurring tasks in your project management system for prompt library QA, trusted-source analysis refreshes, and dashboard audits — the governance cadence that keeps your AEO tracking system accurate over time.

Pro tip: Automation doesn’t replace human judgment. The alerts and reports surface signals; the strategic decisions (which content gaps to close, which engines to prioritize, which prompt clusters to invest in) still require a human connecting AEO data to business context.

How to Close Content Gaps and Improve Citations

Closing content gaps and improving citations is a three-step process:

  • Analyze which sources answer engines currently trust
  • Build a prioritized sourcing plan that matches those source patterns
  • Optimize on-page structure for answer engine retrieval

The gaps between target prompt coverage and actual citations are the highest-leverage content opportunities on the roadmap. Here’s how to execute each step:

 a hubspot-branded image that explains how to close content gaps and improve citations


Step 1: Run a trusted-source analysis.

A trusted-source analysis examines the URLs, domains, and content types that answer engines consistently cite for a given prompt set. Running one before creating or updating content shows which sources are winning citations now — and why — so the resulting sourcing plan targets formats answer engines already trust. Here’s how to run one:

  • Pull citation data from your AEO prompt tracking system. For each prompt where your brand isn’t cited, log every source that is. Note the domain, page type (glossary, research report, product page, comparison article), and content format.
  • Identify source patterns. Across your prompt library, certain source types will appear repeatedly. Answer engines tend to favor reference pages with clear definitions, data-backed glossaries, original research with cited statistics, and authoritative comparison content. These are high-trust citation sources.
  • Map your own content against those patterns. For each gap prompt, ask: “Do we have a page that matches the content type and depth of the currently cited sources?” If your competitor is being cited from a comprehensive glossary page and you don’t have one, that’s your gap.

Step 2: Build a sourcing plan for high-trust content.

A sourcing plan for high-trust content prioritizes the creation or optimization of formats that answer engines consistently cite, ranked by impact and feasibility. The goal is to produce content that matches source patterns answer engines already trust, not guess at what might work. Prioritize three content types that consistently earn AI citations:

  • Reference pages and glossaries. Pages that define key terms with clear, concise language (structured as standalone definitions rather than buried inside longer articles) are disproportionately cited by answer engines. A well-structured glossary page for your category terms gives answer engines a clean, extractable source.
  • Original data and benchmarks. Answer engines frequently cite pages that contain specific statistics, survey data, or industry benchmarks. If you can publish original research or proprietary data relevant to your prompt clusters, those pages become high-trust citation magnets.
  • Comparison and “best of” content. Prompts like “best tools for monitoring AEO citations” or “top CRM platforms for mid-market” trigger AI answers that pull from comparison-style content. Pages structured as honest, detailed evaluations, not thinly veiled product pitches, earn more consistent citations.

Prioritize by impact and feasibility. Not every gap is worth closing immediately. Rank your content gaps using two criteria:

  • Impact. How many tracked prompts does this gap affect? A missing glossary page that maps to 15 high-priority prompts is higher impact than a niche comparison page that maps to two.
  • Feasibility. Can you create or update this content with existing resources in the current quarter, or does it require original research, design, or cross-functional input that extends the timeline?

Stack-rank your sourcing plan by impact × feasibility, and you have a prioritized editorial backlog driven directly by AEO prompt tracking data, not editorial intuition alone.

Step 3: Optimize on-page patterns for answer engine retrieval.

Optimizing on-page patterns for answer engine retrieval means structuring content so that answer engines can extract and cite specific passages cleanly. Answer engines retrieve and synthesize content differently from traditional search crawlers, and certain on-page patterns increase the likelihood of citation. Here are the structural patterns that matter most:

  • Definition boxes. Place clear, concise definitions near the top of relevant pages — ideally within the first 200 words. Use a consistent format: “[Term] is [plain-language definition].”
  • Short Q&A sections. Add FAQ or Q&A blocks that mirror the exact phrasing of prompts in your library. Answer engines frequently pull from Q&A structures because the question-answer format maps directly to how users query answer engines. Keep answers to two to four sentences for maximum extractability.
  • Consistent entity usage. Use your brand name, product names, and category terms consistently throughout the page — exactly as they should appear in AI citations. Inconsistent naming (switching between “HubSpot CRM,” “the HubSpot platform,” and “our CRM”) makes it harder for answer engines to associate your content with a specific entity.
  • Internal links to canonical sources. Link from supporting content to your primary reference pages, glossaries, and pillar pages. This reinforces which pages on your domain are the authoritative source for a given topic (which is a signal that answer engines with web retrieval capabilities can follow).
  • Schema markup. Implement structured data (FAQ schema, Article schema with author and publication date signals, Product schema where relevant) to provide answer engines with machine-readable context about the content’s topic, structure, and authorship. Schema doesn’t guarantee citation, but it reduces ambiguity about what the page covers and who published it.

Pro tip: HubSpot’s Content Hub gives teams a centralized platform for managing these on-page optimizations at scale, from updating definition blocks and FAQ sections across multiple pages to maintaining consistent internal linking structures and deploying schema markup, all within the same system where your content performance data lives.

Frequently Asked Questions About AEO Prompt Tracking

How is AEO prompt tracking different from SEO rank tracking?

AEO prompt tracking and SEO rank tracking differ in four ways: what they measure, where they measure it, how stable the outputs are, and how attribution works. SEO rank tracking monitors a page’s position on a search engine results page for a specific keyword — the output is a number, like ranking #3 for “marketing automation software.” That position is indexable, relatively stable between algorithm updates, and tied to a clickable URL.

AEO prompt tracking monitors whether a brand, content, or domain appears inside AI-generated answers when users ask specific prompts across answer engines.

The output isn’t a rank; it’s a presence-or-absence signal, combined with context about how you’re cited (first source, supporting mention, or footnote) and how often. Here are a few key differences at a glance:

  • Data source. SEO tracking pulls from search engine results pages. AEO prompt tracking pulls from AI-generated responses across ChatGPT, Perplexity, Gemini, Copilot, and Google AI Overviews.
  • Stability. SERP positions shift with algorithm updates but remain relatively consistent between them. Answer engine outputs are non-deterministic — the same prompt can return different citations across sessions, models, and even consecutive queries.
  • Attribution. A SERP click generates a clean referral URL. An AI citation may drive traffic that appears as direct or unattributed in analytics, making pipeline attribution harder without deliberate tracking infrastructure.
  • Competitive framing. SEO ranks brands relative to competitors on a list. AEO prompt tracking signals whether a brand appears in the answer at all, and citation share shows how often a brand or source appears in AI answers compared to competitors for the same prompt set.

Pro tip: Don’t treat these as either/or. The teams getting the clearest picture of search visibility run SEO rank tracking and AEO prompt tracking side by side using the same topic clusters, comparing traditional organic visibility against AI citation visibility for the same subjects.

Which AEO metrics should a marketing leader review monthly?

Marketing leaders should review five core AEO metrics monthly to maintain visibility into AI search performance without getting lost in operational detail:

  • Citation share. The percentage of tracked prompts where the brand appears in AI answers versus competitors. This is the top-level competitive benchmark (the AEO equivalent of organic share of voice).
  • Coverage by engine. Coverage by engine tracks visibility across ChatGPT, Perplexity, Gemini, Copilot, and Google AI Overviews independently. A healthy aggregate number can mask total absence on a single platform, so engine-level breakdowns are essential.
  • Citation trend (month over month).Whether the brand is gaining or losing citations over time. A single month’s snapshot is useful, but the trend line shows whether content investments are working or whether a competitor is displacing the brand.
  • Source gaps. The number of high-priority prompts where the brand should be cited but isn’t. This metric directly informs content production priorities and resource allocation.
  • AI referral traffic. Sessions attributed to known answer engine referral sources, segmented in the analytics platform. Even with imperfect attribution, directional trends in AI-referred traffic validate whether citation visibility is translating into site engagement.

How often should we refresh our prompt library?

Refresh the AEO prompt library on a quarterly cycle, with lighter monthly reviews layered in. For your reference, here’s a practical cadence:

  • Monthly (light review). Check for new prompts emerging from product launches, competitive shifts, trending industry topics, or sales team feedback. Add net-new prompts as needed, but keep the library stable enough for month-over-month trend analysis.
  • Quarterly (full refresh). Audit the entire library. Remove prompts that are no longer relevant (deprecated product categories, outdated terminology). Add prompts reflecting new market positioning, campaign themes, or audience segments. Revalidate funnel-stage tags and target page mappings. Confirm ownership assignments are current.
  • Event-driven (as needed). Major triggers (a new product launch, a competitor rebrand, a significant answer engine model update, or a shift in category language) warrant an immediate prompt addition or reclassification outside the regular cycle.

The best tools for monitoring AEO citations in answer engines make library management easier by flagging prompts that return zero citations for multiple consecutive cycles — a signal of either a content gap or a prompt that’s no longer reflective of real user behavior. Without that automation, build a manual QA check into the quarterly review to catch stale prompts before they dilute reporting.

Can we tie AEO visibility to pipeline without new tools?

Yes — with caveats. Marketing teams can build a functional connection between AEO prompt tracking and pipeline reporting using tools most already have, but the depth of attribution depends on how much manual work the team is willing to sustain. Here’s a minimum viable approach without adding new platforms:

  • Tag AI referral sources in analytics. Create segments for known answer engine referrers (Perplexity is the most reliably trackable). Monitor trends in direct traffic alongside citation changes; correlated spikes are a strong directional signal even without click-level attribution.
  • Map prompts to landing pages in the CRM. For each high-priority prompt, document which page answer engines should cite. When contacts arrive on those pages from AI referral sources (or correlated direct traffic), tag them with a campaign or source property in the CRM.
  • Report at the cohort level. Rather than attempting per-contact, per-click attribution (which current answer engine referral data rarely supports), report on cohorts: ‘Contacts who first visited a page mapped to our top-of-funnel AEO prompts converted to pipeline at X% rate over the past quarter.‘

This works, but it’s manual, fragile, and hard to scale across hundreds of prompts and multiple engines.

Pro tip: For teams that want to move past spreadsheet-based stitching and into a CRM-first AEO tracking and reporting framework, Marketing Hub Pro and Enterprise include HubSpot AEO with CRM-powered prompt suggestions, citation analysis, and prioritized recommendations. These tools are all connected to contact records and pipeline dashboards in one interface. That native integration removes most of the manual data-stitching overhead that causes early AEO-to-pipeline attribution efforts to break down.

What triggers should we automate from AEO changes?

Automate four core triggers from AEO prompt tracking data: citation loss alerts, competitor entry alerts, traffic threshold triggers, and quarterly QA prompts.

  • Citation loss alerts. Configure the monitoring platform to flag when a high-priority prompt loses citation share for two or more consecutive cycles. Route the alert to the content owner mapped to that prompt cluster so the response is investigation, not inbox noise.
  • Competitor entry alerts. Set up notifications when a new competitor begins appearing in citations for tracked prompts. Early detection lets the team analyze the source content driving the citation before the competitor compounds the gain.
  • Traffic threshold triggers. In the CRM or analytics platform, build workflows that fire when AI referral traffic to a target page crosses a defined threshold (positive or negative). Both directions are useful: a spike validates a content investment; a drop signals a citation loss worth investigating.
  • Quarterly QA automation. Schedule recurring tasks for prompt library audits, trusted-source analysis refreshes, and dashboard health checks. The governance cadence keeps the AEO tracking system accurate over time.

Pro tip: Inside Marketing Hub Pro and Enterprise, AEO features surface citation share changes and competitor positioning shifts automatically, so the alerts don’t require building separate workflows in a third-party monitoring tool.

AEO Prompt Tracking Is Achievable With the Right Structure

AEO prompt tracking isn’t inherently complicated. The core concept is straightforward:

  • Monitor whether your brand shows up in AI-generated answers
  • Track how often and where
  • Use that data to make better content and campaign decisions.

The tools exist. The metrics are definable. The workflow is repeatable.

What makes it hard (and what causes most teams to stall) is attempting it without structure. Running ad hoc prompts across ChatGPT once a quarter isn’t tracking. Logging citation data in a spreadsheet that never connects to your CRM isn’t reporting. Knowing your brand appeared in a Perplexity answer, but having no path from that visibility to pipeline isn’t strategy.

But the teams that make AEO prompt tracking work treat it the same way they treat any other measurable marketing discipline:

  • They build a prompt library rooted in real buyer personas, journey stages, and pain points, not internal assumptions about what people search.
  • They organize that library with a taxonomy that supports segmented reporting by topic, intent, engine, and funnel stage.
  • They assign ownership, map target pages, document source gaps, and run QA on a set cadence so the system doesn’t decay.
  • They track the right KPIs, then report them with the same rigor as organic search metrics.
  • They connect AEO data to their CRM so visibility insights flow into the same attribution and pipeline reporting frameworks that drive budget decisions.
  • They close content gaps with intention, using trusted-source analysis and on-page optimization patterns that match how answer engines actually retrieve and cite information.

None of that requires a massive budget or a dedicated AEO team. It requires a system, and the discipline to maintain it.

The brands gaining citation share right now aren’t the ones waiting for AEO to mature. They’re the ones who built the structure, committed to the cadence, and started measuring. Over time, the data compounds and the gaps close. And the conversation with leadership shifts from “we think AI search matters” to “here’s exactly what it’s doing for pipeline.”

Ready to see where your brand stands in AI search? Get started with HubSpot AEO and build an AI visibility baseline for $50/month.

Categories B2B

AEO Competitor Analysis: Track AI Answer Engine Rivals

Every company’s competitors are showing up in AI-generated answers, but do marketers know which ones, for which queries, and why? That’s exactly what AEO competitor analysis is designed to tell teams. Get Started with HubSpot's AEO Tool

Answer engines like ChatGPT, Perplexity, and Google’s AI Overviews don’t rank pages. They cite sources. That shift changes everything about how competitive visibility works. A brand can hold a top-three organic ranking and still be completely absent from the AI answer a prospect reads first.

If brands are not tracking who’s earning those citations and how, they’re making content and SEO decisions without half the picture. This guide walks through how to run an AEO competitor analysis from scratch — what to measure, which tools to use, and how to turn findings into content that closes the gap.

Table of Contents

What is AEO competitor analysis?

AEO competitor analysis is the process of identifying which brands, pages, and sources answer engines cite in AI-generated responses — and benchmarking a brand’s own visibility against competitors across those same queries.

“AEO” stands for Answer Engine Optimization: the practice of structuring content so that AI platforms like ChatGPT, Perplexity, Google’s AI Overviews, and Gemini surface it as a trusted answer.

AEO competitor analysis extends that practice outward — instead of marketing teams just optimizing their own content, they’re systematically tracking who else the engines are citing, why, and what gaps they can close.

I’ve found that teams often confuse AEO with traditional SEO competitive research. The key difference: Traditional SEO competitor analysis tracks keyword rankings and backlinks. AEO competitor analysis tracks citation frequency, answer share, entity coverage, and QA content depth across AI-generated answers. The units of measurement are different because the underlying competition is different — marketers and SEO leaders are not fighting for a rank position, they’re fighting to be the source an LLM trusts.

HubSpot AEO helps marketers track how their brand appears across answer engines, showing which prompts cite competitors instead and where they’re completely absent, so teams can benchmark visibility against rivals in a single view.

Why AEO Competitor Analysis Matters Now

Emerging channels may favor front-running adopters.

Answer engine search is not a future trend, so stop thinking that way. It’s a current channel with accelerating adoption. According to Search Engine Land, 58.5% of U.S. Google searches and 59.7% of EU searches result in zero clicks. Meanwhile, ChatGPT has surpassed 900 million weekly active users.

Teams that build AEO measurement and content infrastructure now are establishing citation authority before most competitors have even started tracking it.

I’ve spoken with SEO leaders who treat AI visibility as a “wait and see” channel. My experience has taught me that’s a mistake. Citation patterns in LLMs tend to be sticky — once a model associates a brand with authority on a topic, that association persists across queries and model updates.

AI answers compress traditional SERPs.

Google’s AI Overviews push organic blue links further down the page, often below the fold. For high-intent queries — “what is the best CRM for startups,” “how do I calculate customer lifetime value” — the AI answer is the SERP result for most users. If a competitor is consistently cited in those answers and a brand is not, that brand is effectively invisible for those queries, regardless of its rankings.

Visibility shifts to citations, entities, and QA patterns.

Traditional search rewards pages. Answer engines reward entities and answers. Answer engines evaluate content based on:

  • Citation frequency. How often is a brand or URL cited for a given topic set?
  • Entity coverage. Does the content clearly establish what the brand is, what it does, and who it serves?
  • QA depth. Does the content directly and completely answer the questions users are actually asking?

Competitor analysis in this environment means understanding not just what a brand’s rivals are publishing, but how their content is structured and why LLMs prefer it.

HubSpot AEO breaks down which domains, content types, and sources answer engines are citing most often, giving marketers clear insight into what content is currently favored and what they need to create or optimize to improve visibility.

Impact on pipeline influence, support deflection, and brand authority.

AEO visibility has a downstream business impact beyond traffic. Brands that appear consistently in AI answers for buying-stage queries — “best [category] software,” “how to choose a [tool],” “[brand A] vs [brand B]” — influence purchase decisions before a prospect ever visits a website.

Teams tracking AEO competitor data are also using it to identify support and product FAQ opportunities, deflecting inbound questions by owning AI-generated answers to common customer issues.

HubSpot AEO and AEO features in Marketing Hub Pro and Enterprise provide a prioritized list of recommendations based on visibility and citation data, helping teams turn competitor insights into a clear plan for improving their presence in AI-generated answers.

How to Run an AEO Competitor Analysis Step by Step

how to run an aeo competitor analysis, discover, benchmark, diagnose, act, measure

Step 1: Collect priority questions that answer engines must resolve.

Start by building a query set, which is a representative list of questions your target audience asks that answer engines are likely to resolve with a generated answer. These should span:

  • Awareness-stage questions – “What is [category]?” / “How does [process] work?”
  • Consideration-stage questions – “Best [tool type] for [use case]” / “[Brand A] vs [Brand B].”
  • Decision-stage questions – “How much does [product] cost?” / “Is [brand] right for [company type]?”
  • Support and FAQ questions – Common issues customers search for after purchase.

Pro tip: Pull questions from the existing keyword research, customer support tickets, sales call transcripts, and “People Also Ask” boxes in Google. Marketers want 30 to 100 queries across their core topic clusters to get a statistically meaningful view of answer share. For HubSpot users, built-in AEO features in Marketing Hub Pro and Enterprise suggest prompts to track based on its knowledge of their business and customers.

Step 2: Test queries across chatbots and AI Overviews.

Run each query manually or with an AEO tool across multiple answer engines: ChatGPT, Perplexity, Google AI Overviews, and Gemini. Record:

  • Which sources are cited (URLs and domain names).
  • Which brands are mentioned by name (even without a citation link).
  • The structure and format of the answer (list, paragraph, table, step-by-step).
  • Whether your brand appears at all.

At scale, this is where AEO tools become essential — manual testing across 50+ queries on four platforms isn’t sustainable. But I recommend starting with manual testing for a brand’s top 10 to 15 queries. It builds intuition for why certain content gets cited that dashboards alone won’t give you.

With HubSpot AEO, marketers can automatically track prompts across ChatGPT, Perplexity, and Gemini, seeing which responses cite their brand, which cite competitors, and how visibility changes over time without manual testing.

Step 3: Extract cited sources and entities.

For each query in a set, document every cited source and named entity. Marketers are building a map of:

  • Which competitor domains are most frequently cited (citation frequency by domain).
  • Which specific pages or content types win citations (blog posts, documentation, landing pages, research reports).
  • Which entities are consistently mentioned (brand names, product names, people, organizations).

Look for patterns. If a competitor’s blog consistently gets cited while their product pages don’t, that tells marketers something about what content format LLMs prefer. If a direct competitor is appearing for their core queries, that’s a new competitive threat worth tracking.

Step 4: Map competitors by topic cluster and answer share.

With citation data collected, marketers should organize it by topic cluster — not just by competitor. Calculate a rough answer share for each brand: the percentage of queries in a topic cluster where that brand is cited.

This map reveals two things:

  1. Where competitors dominate. Topic clusters where a rival has a high answer share, and you have low or none — these are priority gap areas.
  2. Where the field is open. Topic clusters where no brand dominates — these represent fast-mover opportunities where strong content could quickly establish citation authority.

Here’s an example of an AEO competitor analysis chart:

Step 5: Diagnose why competitors win.

This is the step most teams skip — and it’s the most valuable. Don’t just identify that a competitor wins citations. Diagnose why.

For each competitor page that consistently earns citations, analyze:

  • Content format. Is it a listicle, a long-form guide, a FAQ page, a comparison article?
  • QA structure. Does the page directly answer the question in the first 1–2 sentences, then provide supporting detail?
  • Entity clarity. Does the page clearly state what the brand/product/topic is, who it’s for, and what problem it solves?
  • Freshness. When was the content last updated? LLMs often favor recently updated content for fast-moving topics.
  • Schema markup. Does the page use FAQ, HowTo, or other structured data?
  • Backlink authority. Is the page well-cited by other authoritative sources?

What I like: The most actionable diagnostic question is: “If I were a language model trying to answer this question, would this page give me a clear, trustworthy, complete answer?” That framing cuts through much of the complexity.

AEO in HubSpot Marketing Hub generates prioritized, plain-language recommendations with clear next steps, helping teams move from insight to action. Teams get valuable insights in the interface they already know.

AEO Competitor Analysis Tools and Workflows

1. HubSpot AEO

aeo competitor analysis tools, hubspot aeo

HubSpot AEO gives marketers a clear view of how their brand is showing up across major answer engines, like ChatGPT, Perplexity, and Gemini. It tracks share of voice at the prompt level, showing exactly which prompts cite a brand, which cite competitors, and where a brand is completely absent. Instead of requiring AEO expertise, it translates complex visibility data into plain-language insights that teams can act on immediately.

The tool also connects that visibility data to a concrete strategy. Marketers can track priority prompts, analyze which sources and content types AI engines cite, and identify where competitors are gaining share of voice. From there, HubSpot AEO generates prioritized recommendations with clear next steps, helping teams move from “we’re not showing up” to a defined plan for improving visibility.

What I like: HubSpot AEO doesn’t just surface gaps — it shows marketers exactly where they’re losing ground to competitors and provides a prioritized, plain-language action plan they can use right away.

Best for: Marketers who want a fast, accessible way to understand how their brand shows up in AI-generated answers and get a clear action plan.

2. HubSpot AEO Features in Marketing Hub

aeo competitor analysis tools, hubspot aeo in marketing hub

AEO features in Marketing Hub Pro and Enterprise give marketers a clear view of how their brand appears across answer engines. Markteres can also get a strategy for improving visibility and the tools to implement it — all in one end-to-end system.

Because it’s connected to HubSpot CRM, the Marketing Hub automatically suggests the most relevant prompts based on a company’s industries, competitors, and customer segments, making insights more specific and actionable from day one. Recommendations also get sharper over time as more CRM data informs the system.

HubSpot AEO surfaces visibility gaps across prompts and competitors, tracks answer share trends over time, and connects AI visibility data to contact and pipeline reporting in HubSpot CRM — so marketers can tie AEO performance to actual business outcomes, not just impressions.

What I like: Teams with multiple hubs can take AEO suggestions from Marketing Hub and implement them in Content Hub. When the AEO tool surfaces a gap, marketers can brief and publish new content.

Best for: Marketing teams that want to connect AI visibility insights directly to execution using their CRM data and existing marketing workflows.

3. HubSpot AEO Grader

ai share of voice tools, hubspot aeo grader

HubSpot AEO Grader benchmarks answer engine visibility by measuring how often a brand appears in AI-generated answers relative to competitors. It gives teams a snapshot of their share of voice across key prompts, along with insight into how their brand is being represented in those answers. This makes it easier to understand not just whether a brand is visible, but how it compares in competitive contexts.

The tool acts as an entry point into AEO by helping marketers quickly assess where they stand and identify whether visibility gaps exist. From that initial benchmark, teams can start to understand which questions matter most for their business and where they may need to improve their presence in AI-generated responses.

AEO Grader is also completely free, making it a great starting point for marketers just dipping their toes into AEO.

What I like: It provides a quick, low-friction way to understand how often a brand appears in AI answers and how it stacks up against competitors, without requiring any setup or prior AEO experience.

Best for: Marketers benchmarking AI visibility across the funnel.

4. Perplexity

aeo competitor analysis tools, perplexity

Running priority queries directly in Perplexity gives marketers a fast, free view into what sources are being cited and how answers are structured. Perplexity shows citations inline, making it easy to identify which competitor URLs are earning placement.

Pro tip: Use Perplexity’s “Focus” modes (Web, Academic, Writing) to test how answer sources vary by query context.

Best for: Quick qualitative spot-checks.

5. ChatGPT with Browse

aeo competitor analysis tools, chatgpt browser

ChatGPT’s browsing mode surfaces citations for current queries. It’s particularly useful for testing consideration-stage and comparison queries (“best X for Y” formats), where brand mentions in AI answers have the highest purchase influence.

Best for: Testing conversational and mid-funnel queries.

6. Ahrefs

aeo competitor analysis tools, ahrefs

Traditional SEO tools remain valuable for diagnosing why certain pages earn AI citations — backlink authority, on-page optimization, and topical authority signals all contribute to LLM citation patterns.

Use Ahrefs to audit competitor pages that consistently earn citations, and identify the SEO factors that may be reinforcing their AI visibility.

Best for: Pairing traditional SEO data with AEO insights.

7. BrightEdge or Conductor

share of voice tools, brightedge

Enterprise SEO platforms are beginning to add AI Overview and answer engine tracking features. These are best suited for large teams managing hundreds of topic clusters that need automated citation monitoring and executive-ready reporting.

Best for: Enterprise teams running AEO at scale.

AEO Competitor Analysis Metrics and Dashboards

Measure answer share and citation frequency.

Answer share is the foundational AEO metric: the percentage of queries in a defined set where a brand is cited in the AI-generated answer. It’s the AEO equivalent of organic market share.

Track answer share at three levels:

  • Overall. Across a full query set.
  • By topic cluster. To identify where a brand is winning and losing.
  • Over time. To measure whether content investments are improving visibility.

Citation frequency is the raw count behind answer share — how many times a domain or URL is cited across the query set. High citation frequency on a small number of pages may indicate over-reliance on a few content assets; broad citation frequency across many pages signals strong topical authority.

Track entity coverage and QA depth.

Entity coverage measures whether a brand, product, and key topics are explicitly recognized and associated correctly by answer engines. Test this by asking LLMs directly: “What is [your brand]?” / “What does [your brand] do?” / “Who uses [your product]?” If answers are vague, incomplete, or incorrect, marketers have an entity clarity problem that will suppress citations across their full query set.

QA depth measures how completely a brand’s content answers the specific questions in its query set. Score competitor content and your own on a simple rubric:

  • Does the page answer the question directly in the opening section?
  • Does it cover the question comprehensively (including follow-up questions and edge cases)?
  • Is the answer structured for easy extraction (headers, bullets, numbered steps)?

Connect AI answer visibility to conversions.

The hardest — and most important — AEO measurement challenge is connecting AI visibility to the pipeline. I recommend a multi-touch approach:

  • UTM tracking on cited URLs. Ensure all high-priority content assets have UTM parameters so teams can track traffic from AI-referred clicks in HubSpot or GA4.
  • Self-reported attribution. Add “How did you hear about us?” fields to forms and track “AI search” or “ChatGPT/Perplexity” as a source option. This captures influenced pipeline that never generates a tracked click.
  • Dark social monitoring. Monitor branded search volume and direct traffic trends in parallel with AEO investments — AI answer visibility often drives brand searches that convert through direct channels.

Pro tip: In HubSpot, create a custom contact property for AI-attributed first touch. Over time, this builds a dataset that correlates AEO content investments with actual contact and deal creation.

AEO in HubSpot Marketing Hub Pro and Enterprise connects AI visibility tracking to CRM data, making it possible to tie answer engine performance to contacts, pipeline, and revenue in the same reporting system.

Turn AEO Competitor Insights Into Actions

Once your analysis is complete, translate findings into a prioritized action list. Here are the most common and highest-impact actions I’ve seen AEO competitor analysis surface:

  • Create direct-answer content for high-gap queries. If a competitor earns citations on 8 out of 10 queries in a topic cluster and you earn 0, the fastest path to closing that gap is publishing purpose-built QA content that directly answers those questions — structured with a clear question as the H2, a direct answer in the first 1–2 sentences, and supporting detail below.
  • Update and restructure existing pages. Many citation wins come from reformatting existing content rather than creating new content. Add direct answers, FAQ sections with schema markup, and clearer entity statements to pages that are already indexed and authoritative.
  • Build entity disambiguation content. If LLMs give incomplete or inaccurate answers about your brand, publish an authoritative “About” or “What is [Brand]?” page with structured entity information. Reinforce entity signals across your site and in third-party sources (Wikipedia, Crunchbase, press coverage).
  • Prioritize topic clusters where answer share is low but competitor content is weak. Not every gap requires competing with a dominant rival. Look for clusters where no competitor has strong AEO content — those are the fastest paths to establishing first-mover citation authority.
  • Add comparison and “best for” content. Comparison queries (“X vs. Y,” “best [tool] for [use case]”) are high-intent and frequently answered by LLMs. If competitors are winning these queries and you’re not, comparison content is a high-priority gap to close.
  • Strengthen internal linking between high-performing and low-performing pages. LLMs index topical authority signals across a domain. Pages that aren’t earning citations may benefit from stronger connections to your most-cited content.
  • Submit updated content to Google for re-indexing. For pages you’ve updated to improve QA depth or entity clarity, use Google Search Console to request re-indexing so updated signals are picked up quickly.
  • Track changes at monthly intervals. AEO competitive dynamics shift as competitors publish new content and as LLMs update. Build a monthly cadence of running your priority query set and updating your answer share benchmarks.

Frequently Asked Questions About AEO Competitor Analysis

How often should you run AEO competitor analysis?

I recommend a full AEO competitor analysis — running your complete query set, documenting citations, and updating benchmarks — on a monthly cadence for most teams.

For competitive markets or during active content campaigns, biweekly monitoring of top-priority query clusters is worth the investment. Unlike traditional SEO rankings, which update continuously, AI citation patterns can shift meaningfully after a competitor publishes new content or after a model update — so regular snapshots are necessary to detect changes.

How do you attribute pipeline impact from AI answers?

Pipeline attribution for AI answers requires a combination of methods because AI-generated answers don’t always generate trackable clicks.

Use UTM-tagged URLs on cited content to capture direct referral traffic, add answer engines as a self-reported attribution option on forms and in sales conversations, and monitor branded search and direct traffic trends as a proxy for AI-influenced awareness.

In HubSpot, custom contact properties and deal source fields let you build a longitudinal view of an AI-attributed pipeline over time. Within HubSpot Marketing Hub, marketers can use CRM data, custom properties, and reporting tools to track AI-influenced contacts and build a clearer view of how AEO contributes to pipeline over time.

What is the best way to structure QA content for LLM citations?

The content format most consistently cited by LLMs is the direct-answer structure: the target question appears verbatim (or near-verbatim) as an H2 or H3 heading; the first 1–3 sentences provide a complete, direct answer to that question; supporting detail, examples, and nuance follow in clearly organized subsections.

FAQ schema markup reinforces this structure for Google’s AI Overviews. HowTo schema works similarly for process-oriented content. Avoid burying the answer in lengthy preambles — LLMs favor content that gets to the point immediately.

When should you prioritize AEO over traditional SEO?

AEO and traditional SEO are not mutually exclusive — the same content quality signals that drive rankings (authority, depth, structured formatting, freshness) also drive AI citations.

However, if analytics show declining organic click-through rates despite stable or improving rankings, that’s a signal that AI answers are intercepting clicks for your target queries. In that scenario, investing in AEO content structure and citation optimization is likely to have a higher marginal return than chasing additional ranking improvements.

More broadly, for any query type where AI Overviews or LLM answers are already dominant, AEO should be the primary optimization lens.

From Analysis to Action: Turning AEO Insights Into Competitive Advantage

AEO competitor analysis gives marketers something traditional SEO never fully could: a direct view into how brands are actually recommended at the moment of decision-making. Instead of optimizing for rankings alone, teams can now measure citation frequency, answer share, and entity presence — and understand exactly why competitors are being surfaced in AI-generated answers.

The real value, however, comes from what happens next. Identifying gaps is only useful if teams can act on them quickly and consistently. That’s where tools like HubSpot’s AEO Grader provide an accessible starting point, helping marketers benchmark their current visibility and understand how they compare. From there, HubSpot AEO and AEO features in HubSpot Marketing Hub enable ongoing tracking, competitor analysis, and prioritized recommendations — while also connecting those insights directly to content execution, CRM data, and pipeline reporting.

For teams investing in AEO, the path forward is clear: Build a reliable query set, track answer share over time, and continuously refine content based on what AI engines actually cite. The companies that operationalize this process early won’t just keep up with competitors — they’ll define how their category is represented in answer engines.

Categories B2B

Share of Voice Tools for Growing Companies

When tracking share of voice for marketing teams, it’s often assumed to be a vanity metric — a number executives like to include in board decks but one that rarely influences strategy. In practice, that assumption doesn’t hold up.

Get Started with HubSpot's AEO Tool

Share of voice (SOV) is one of the clearest leading indicators of whether a brand is gaining or losing visibility long before it shows up in the pipeline. The problem is that most teams measure it inconsistently, compare apples to oranges across channels, and end up with dashboards that no one acts on.

This guide is designed to change that. It breaks down what each type of SOV actually measures across SEO, social, paid, and emerging AI search, which tools are worth the investment at different stages of growth, and how to avoid common measurement pitfalls — including the growing issue of AI-driven share of voice bias. It also shows how to connect visibility metrics to CRM, attribution, and revenue outcomes that leadership actually cares about.

Table of Contents

What are share of voice tools and which SOV types matter?

Share of voice is the percentage of visibility a brand earns compared with competitors in a defined market or channel. In plain English: Out of all the conversations, impressions, and results happening in a business’s category, how much of that attention is going to it?

Share of voice tools measure competitive visibility across channels such as search, social, PR, retail media, and answer engines. The definition sounds simple. The complexity lies in the fact that “visibility” means something fundamentally different across channels, which is exactly why so many SOV reports mislead rather than inform.

Here’s a quick breakdown of the core SOV types and when they matter most:

A note on growth stage relevance: Early-stage startups typically get the most signals from social SOV and SEO SOV — they’re the fastest to move and the easiest to act on. Mid-market teams often need to add PR SOV as a brand-building lever. Enterprise teams are now adding AI SOV to their measurement stack, and frankly, the mid-market teams that start tracking it now will have a meaningful head start.

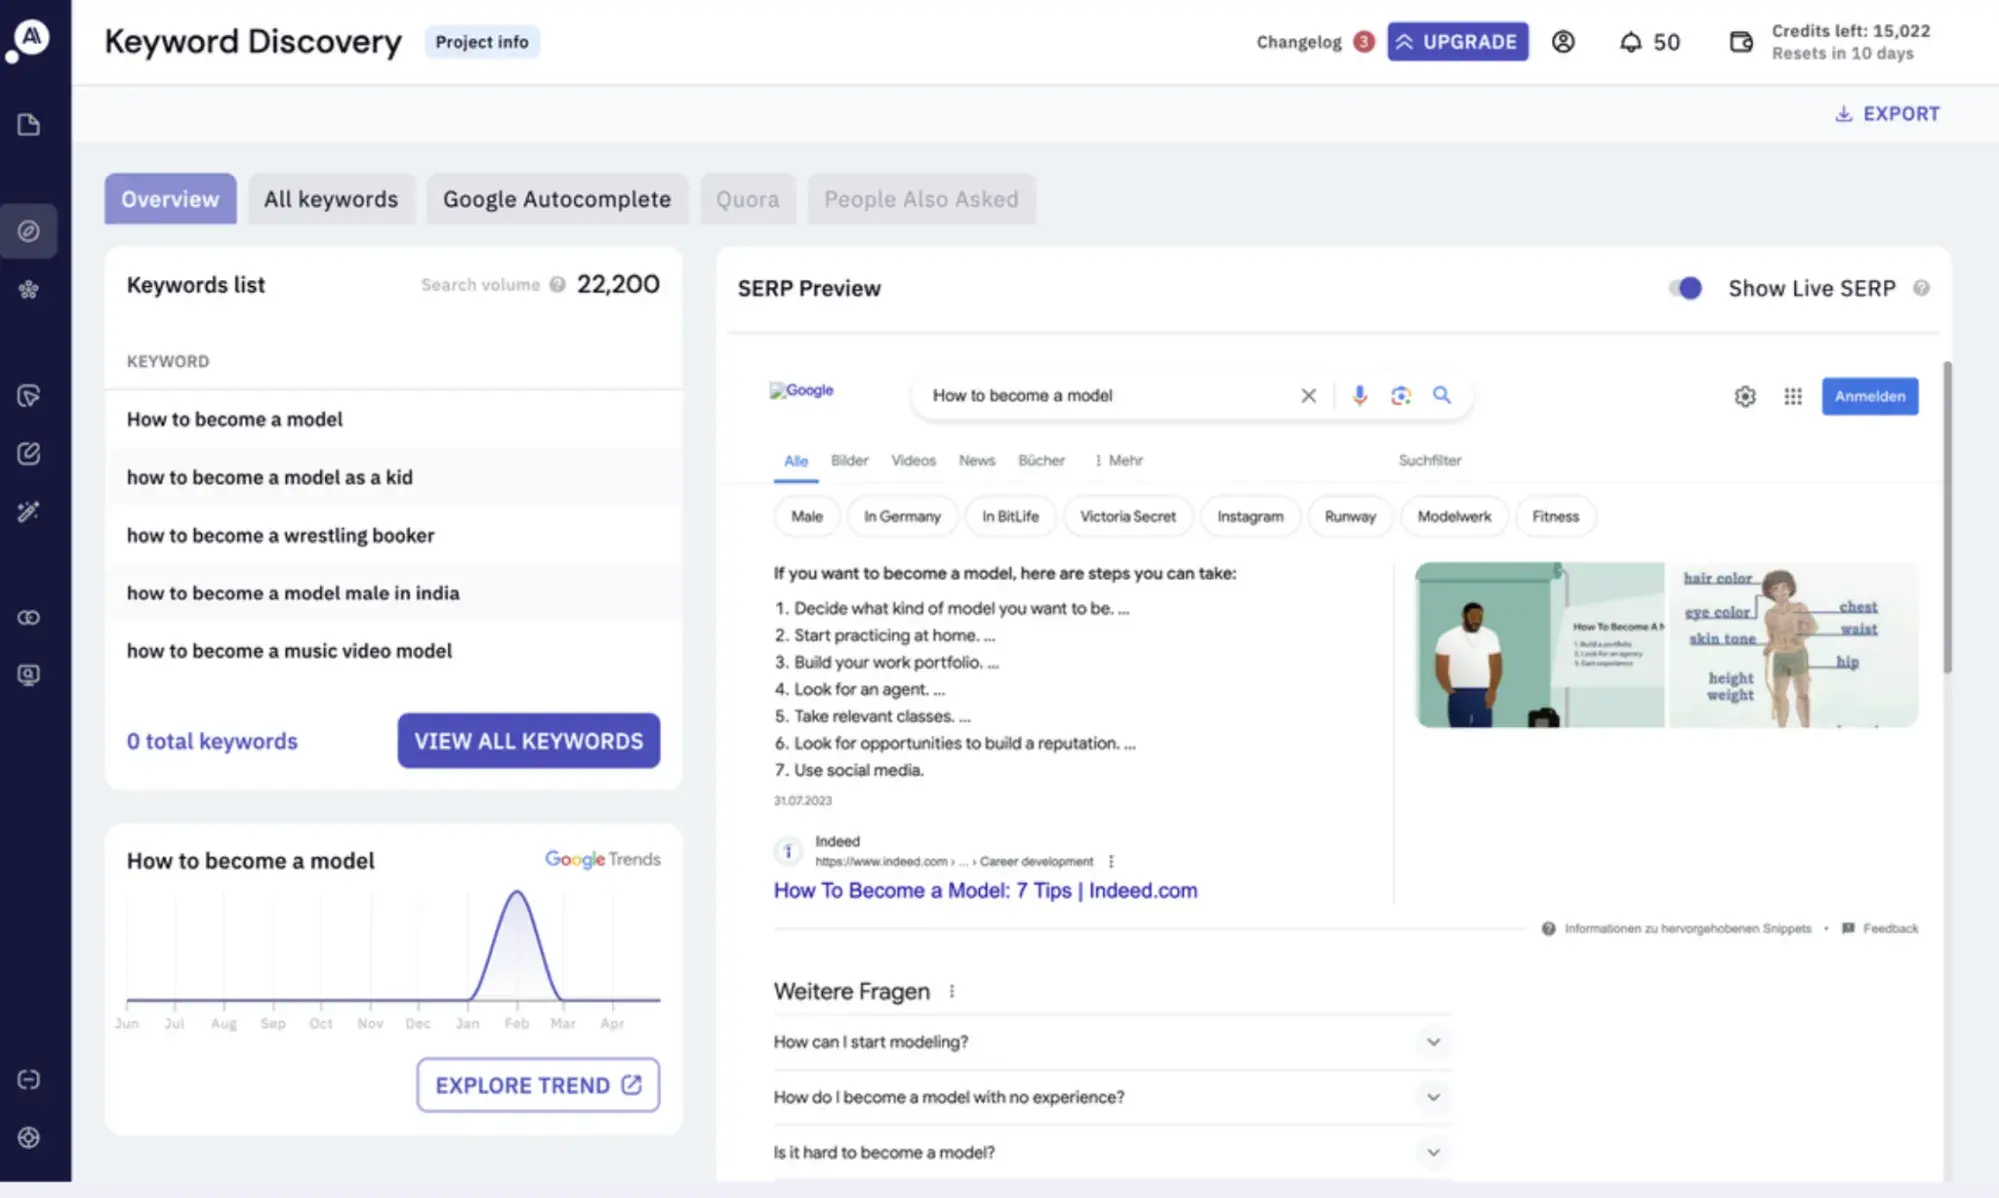
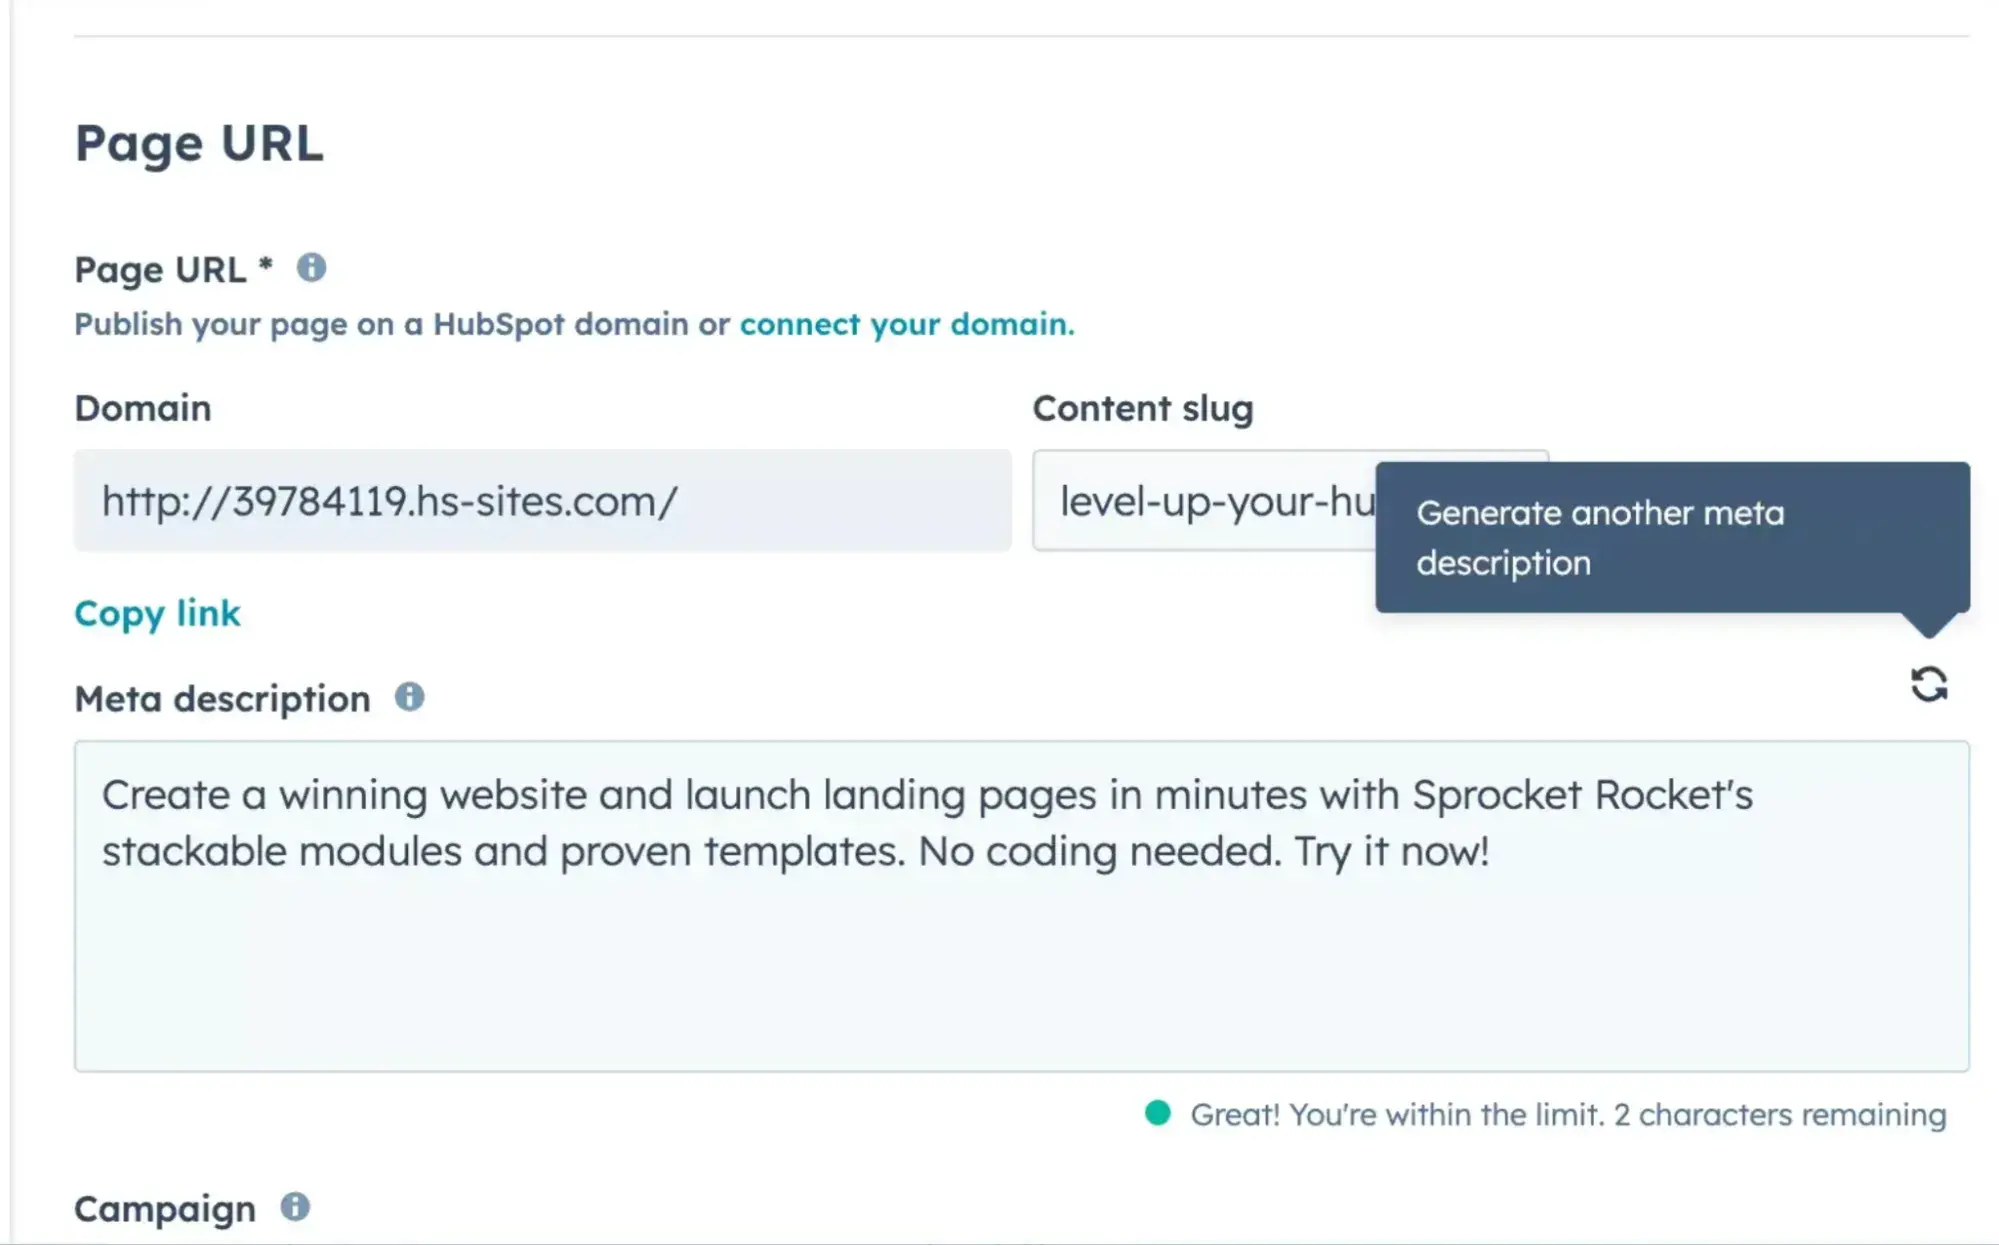
HubSpot AEO helps marketers quantify AI share of voice by showing how often their brand appears in AI-generated answers compared to competitors across a defined prompt set, making competitive gaps immediately visible.

How do share of voice tools calculate SOV?

The core share of voice calculation is consistent across channels, even if the inputs vary:

Share of Voice (%) = Your Brand Metrics ÷ Total Market Metrics × 100

For SEO, “your brand metrics” means estimated organic clicks or impressions for a tracked keyword set. For social, it means brand mentions. For PR, it means the volume of a brand’s media coverage. The formula is always the same; the data source changes.

Why Vendor Numbers Differ (and Why It Matters)

Teams get confused — and occasionally panicked — when two tools report different SOV numbers for the same brand. This happens for three main reasons:

  1. Keyword set differences. One tool may track 500 keywords, while another tracks 5,000. A wider keyword set almost always produces a lower SOV percentage, even if the rankings are identical.
  2. CTR model variations. SEO SOV tools estimate traffic by applying click-through rate curves to ranking positions. Different tools use different CTR curves, which produce different traffic estimates.
  3. Data source coverage. Social SOV tools scrape different platforms and apply different filters. A tool that monitors Reddit and TikTok in addition to X and Instagram will produce different mention counts than one that doesn’t.

None of these discrepancies means the tool is wrong. They mean marketers need to standardize their measurements before benchmarking.

Standardization Checklist

  • Define a fixed keyword set or competitor set before measuring.
  • Lock your tracked competitor list (adding competitors mid-measurement skews trending data).
  • Use the same tool for the same channel consistently — don’t switch mid-year.
  • Document your methodology so new team members can replicate it.
  • Set a consistent cadence (weekly snapshots for volatile channels, monthly for SEO).

It’s best to build a competitive analysis template before starting, so SOV measurements align with how a team is already thinking about the competitive landscape.

Defining a brand’s competitive set upfront prevents one of the most common SOV reporting mistakes: comparing it to a different set of competitors each quarter and calling the change “progress.”

How to Use Share of Voice Tools for SEO

SEO share of voice tracks a brand’s relative organic visibility for a target keyword set. Organic share of voice uses non-paid search visibility as its measurement base — meaning marketers and SEO strategists are measuring the percentage of organic clicks or impressions they capture versus all the organic clicks available for their tracked keywords.

The formula in practice:

SEO SOV = (Estimated organic traffic for keyword set ÷ Total possible organic traffic for keyword set) × 100

For example, if a company’s tracked keywords collectively receive 500,000 organic searches per month, and their site is estimated to capture 75,000 of those clicks based on its ranking positions and expected CTRs, its SEO share of voice is 15%.

Aligning keywords to personas and funnel stages is non-negotiable. Marketing teams may track 1,000 keywords and celebrate a rising SOV score, only to discover they’re gaining visibility on informational queries at the top of the funnel while losing ground on high-intent, bottom-funnel terms their sales team actually cares about.

Segment the keyword set by persona, funnel stage, and product line to provide actionable SEO SOV insights.

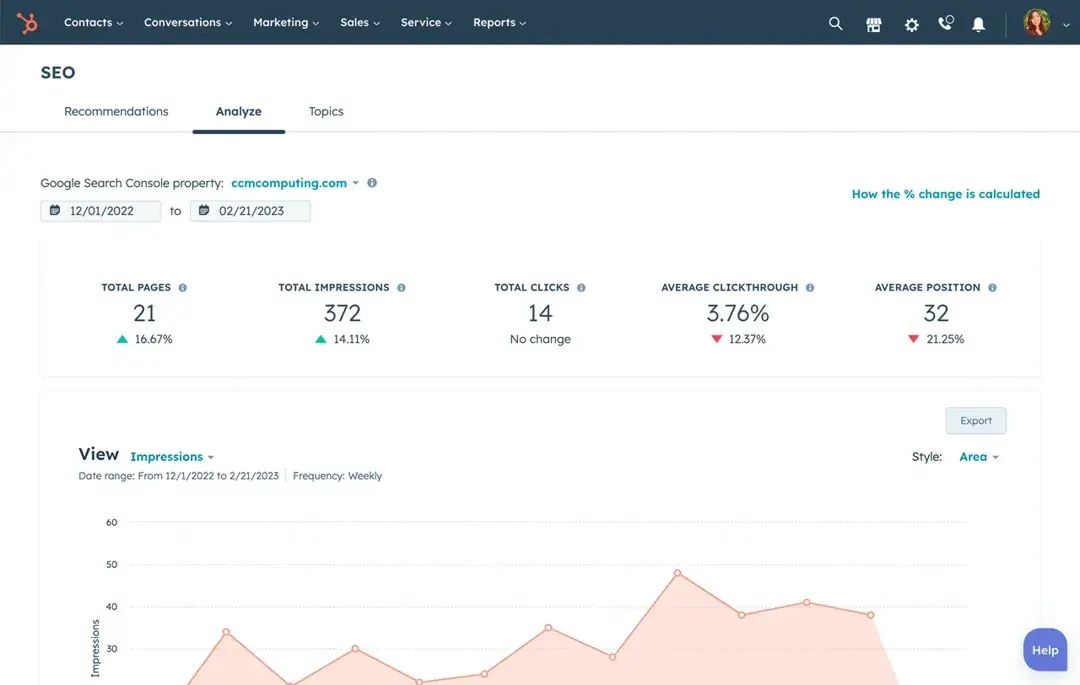
Pro tip: HubSpot Marketing Hub users can pipe their SEO visibility data into their marketing analytics dashboard and correlate SOV trends with organic traffic and lead volume — making it much easier to show leadership the ROI of their organic investment.

SEO SOV Tools

Semrush Position Tracking

share of voice tools, semrush

Semrush’s Position Tracking and Market Explorer features let marketers and SEO strategists track their keyword rankings against a defined competitor set and report on their share of market within organic search.

It includes AI Overview detection, so teams can see when their keywords trigger Google’s AI-generated answers — and whether their brand is included. Pricing starts at approximately $208/month for small business plans.

Best for: Teams wanting an all-in-one SEO platform with SOV built in.

What I like: The ability to segment SOV by keyword group, tag sets by product line or persona, and get daily rank updates.

Ahrefs Rank Tracker

share of voice tools, ahrefs

Ahrefs Rank Tracker includes a dedicated share of voice metric that shows an organization’s visibility score as a percentage of the total available clicks for their tracked keywords. Its Brand Radar add-on (from $199/month) extends this into AI visibility tracking.

Best for: Teams with a strong focus on link-based authority signals who want to connect organic SOV to citation strength.

What I like: The interactive graphs that show SOV over time, making it easy to correlate visibility shifts with content launches or algorithm updates

Moz Pro

share of voice tools, moz pro

Moz Pro’s keyword tracking and Brand Authority features offer a slightly less complex entry point for teams newer to SEO SOV measurement, with solid competitor benchmarking and automated weekly reports.

Best for: Smaller teams or those newer to SEO SOV who want a clean, guided experience.

What I like: The straightforward reporting format, which makes it easier to build leadership-facing summaries.

BrightEdge

share of voice tools, brightedge

BrightEdge is the enterprise-grade choice. It was one of the first platforms to patent share of voice capabilities for organic search, and it has since added AI visibility tracking (AI Catalyst) that connects traditional SEO SOV with AI search citations.

Best for: Enterprise teams managing thousands of keywords across multiple product lines who need both organic SOV and AI SOV in one platform.

What I like: The DataMind engine, which surfaces SOV shifts in real time and ties them to content recommendations.

How to Measure AI Share of Voice and Avoid Prompt Bias

AI share of voice measures how often a brand appears in AI-generated answers through entity mentions and citations. When someone asks ChatGPT, Gemini, or Perplexity for the best tool or service in your category, your brand is either mentioned or it isn’t.

AI SOV quantifies, over time and across a large set of prompts, how a brand’s competitors compare to it.

The formula is simple:

AI SOV = (Number of AI responses mentioning your brand ÷ Total AI responses for your prompt set) × 100

The hard part isn’t the math. It’s building a prompt set that actually reflects how buyers think and avoiding the measurement traps that produce a number that looks meaningful but isn’t. AI share of voice accuracy depends on a prompt set that is balanced across personas, funnel stages, and platforms.

AEO features in Marketing Hub Pro and Enterprise go further by suggesting prompt opportunities based on CRM data, campaign performance, and known customer behavior, helping teams build prompt sets that reflect real buyer questions rather than generic keyword lists.

I’ve seen teams build prompt sets entirely from their top SEO keywords. The result is a high citation share (their blog posts are referenced) but near-zero entity mentions (their brand is never recommended). These are two different things, and they require different strategies to improve.

Steps to Build a Reliable AI SOV Prompt Set

Step 1: Ground prompts in your competitive arena.

Before anything else, marketers should define the categories in which they want to win. For a B2B SaaS company, this might range from “project management software” broadly down to “project management software for remote engineering teams under 50 people.”

The specificity of the category definition determines the relevance of the prompts.

Step 2: Layer in first-party voice-of-customer data.

Pull from sales call transcripts, demo recordings, support tickets, and win/loss interviews.

The questions a company’s buyers ask before they convert are almost exactly what they’re now typing into ChatGPT — often more detailed and personalized than traditional search keywords. For HubSpot users, their CRM notes and conversation intelligence data are a goldmine here.

Step 3: Mine communities and forums.

Reddit, G2, Capterra review threads, and industry Slack communities surface the questions buyers ask before they know a brand exists.

Look for comparison prompts (“Tool A vs. Tool B for use case X”), best-for prompts (“best [category] for [constraint]”), and problem-solution prompts (“struggling with [problem], what are people doing?”). Rewrite these as natural AI prompts.

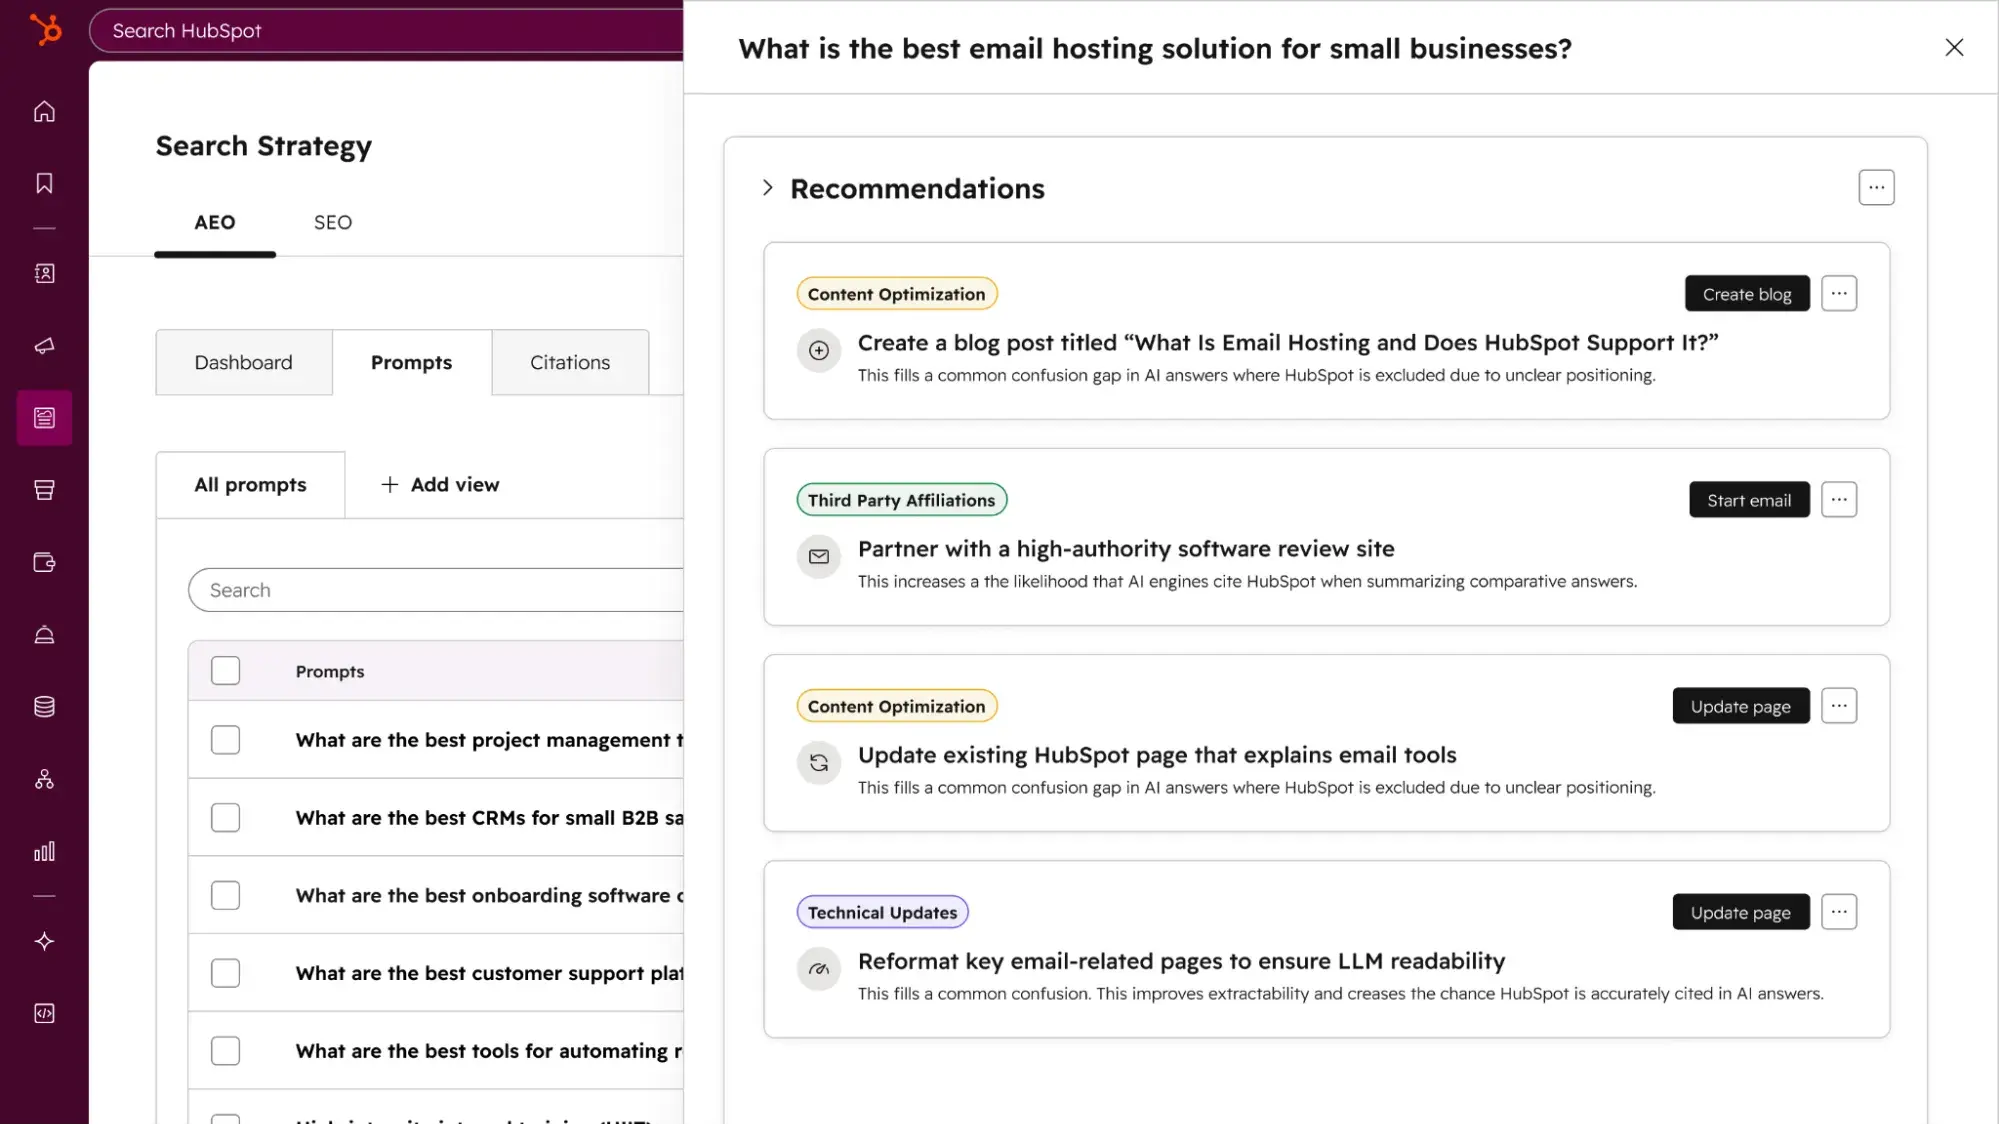
HubSpot AEO doesn’t just highlight gaps — it provides clear, prioritized recommendations for updating existing content or creating new assets to improve visibility in the prompts where competitors are currently winning.

Step 4: Triangulate against search data.

Use keyword research to validate and prioritize prompts. High-volume, commercial-intent keywords often map to high-value AI prompt categories.

Step 5: Segment your prompt set.

Build separate prompt clusters for: brand/category prompts (the core), persona-based prompts (by ICP), funnel-stage prompts (awareness, consideration, decision), and competitor comparison prompts. A balanced 100–200 prompt set is more reliable than an unbalanced set of 1,000.

A word on entity mentions vs. citations: Entity-based SOV counts how often a brand is recommended as a named entity (“I’d suggest [Brand] for this use case”). Citation-based SOV counts how often a brand’s content is sourced in an AI answer.

Both matter, but entity mentions are the more actionable metric for most growth teams because they directly map to brand recommendations.

Pro tip: Refresh the AI SOV prompt set at least quarterly. AI model updates — like when Google integrated Gemini 3 into AI Overviews in February 2026 — can reshuffle which brands get cited, making a previous prompt set stale.

Research suggests AI citations can fluctuate significantly month over month, so continuous tracking beats one-time audits. HubSpot AEO continuously tracks AI visibility over time and surfaces changes in share of voice, helping marketers stay on top of shifts in how their brand is being represented as AI models and competitive content evolve.

Tools to Track AI Share of Voice

HubSpot AEO Grader

ai share of voice tools, hubspot aeo grader

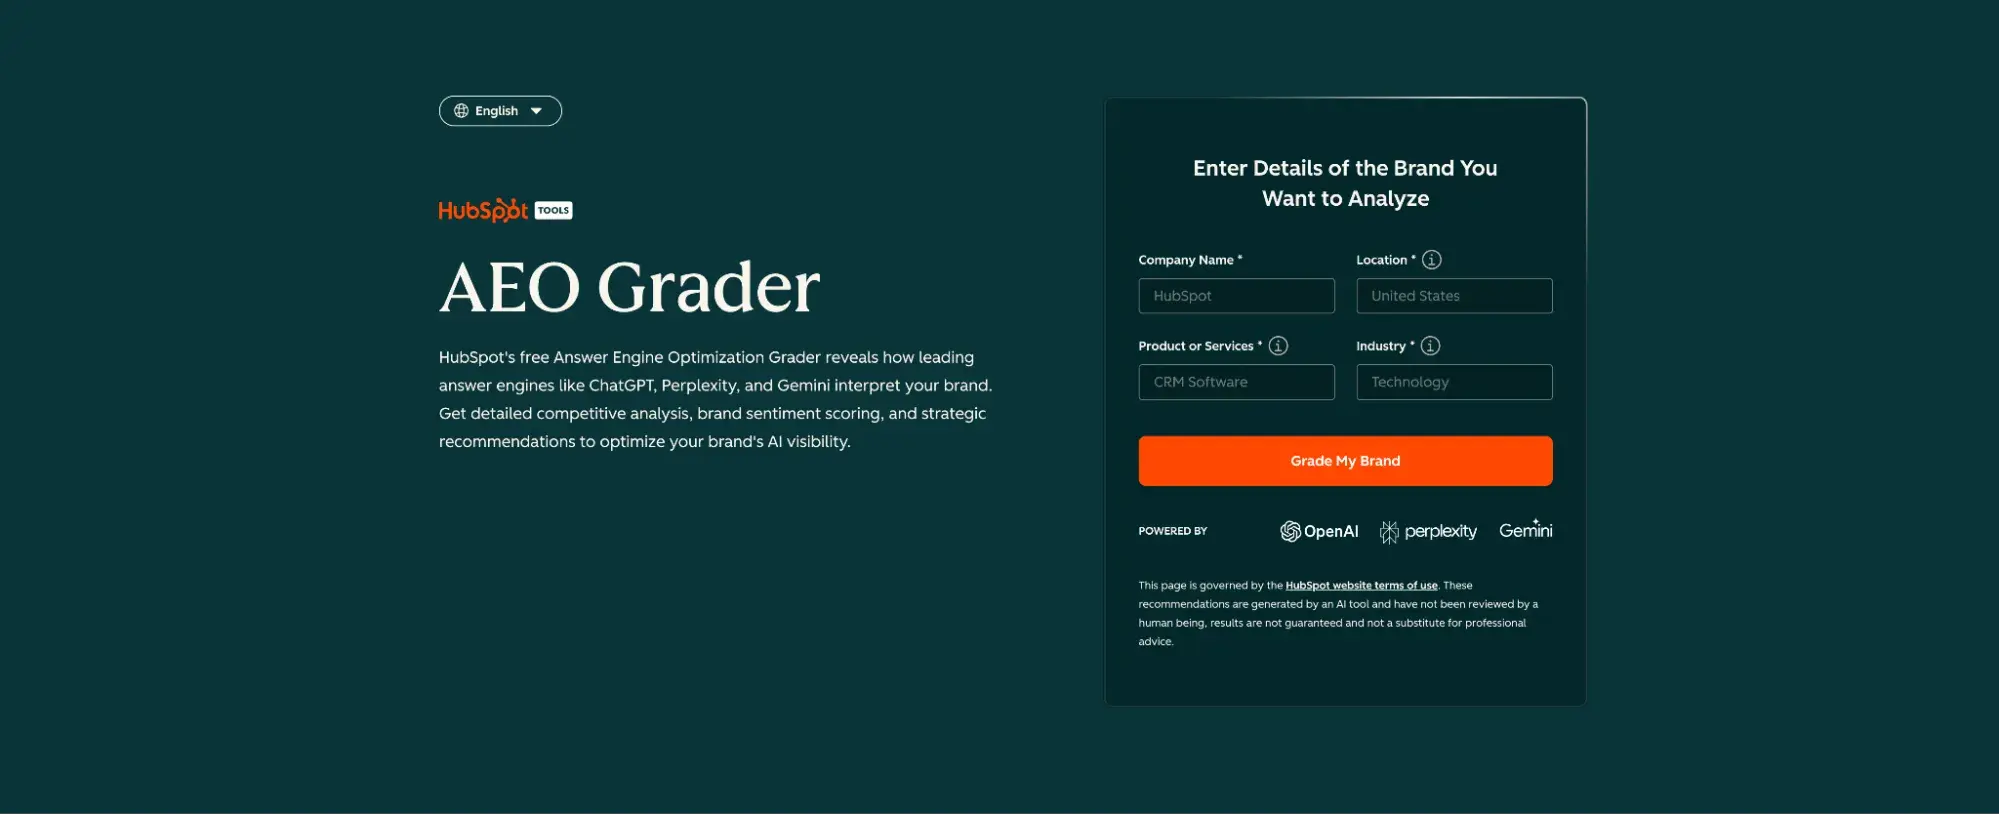
The fastest way to establish a baseline is HubSpot’s AEO Grader. This free tool offers a snapshot of a brand’s current AI visibility across platforms and identifies gaps in how AI systems represent that brand.

It’s a strong starting point before companies invest in a more comprehensive paid platform.

Best for: Getting started, establishing a baseline, identifying quick-win content gaps.

What I like: Free to use, fast to set up, and it frames the results in terms of the specific content and authority signals you need to address — not just a score.

HubSpot AEO

share of voice tools, hubspot

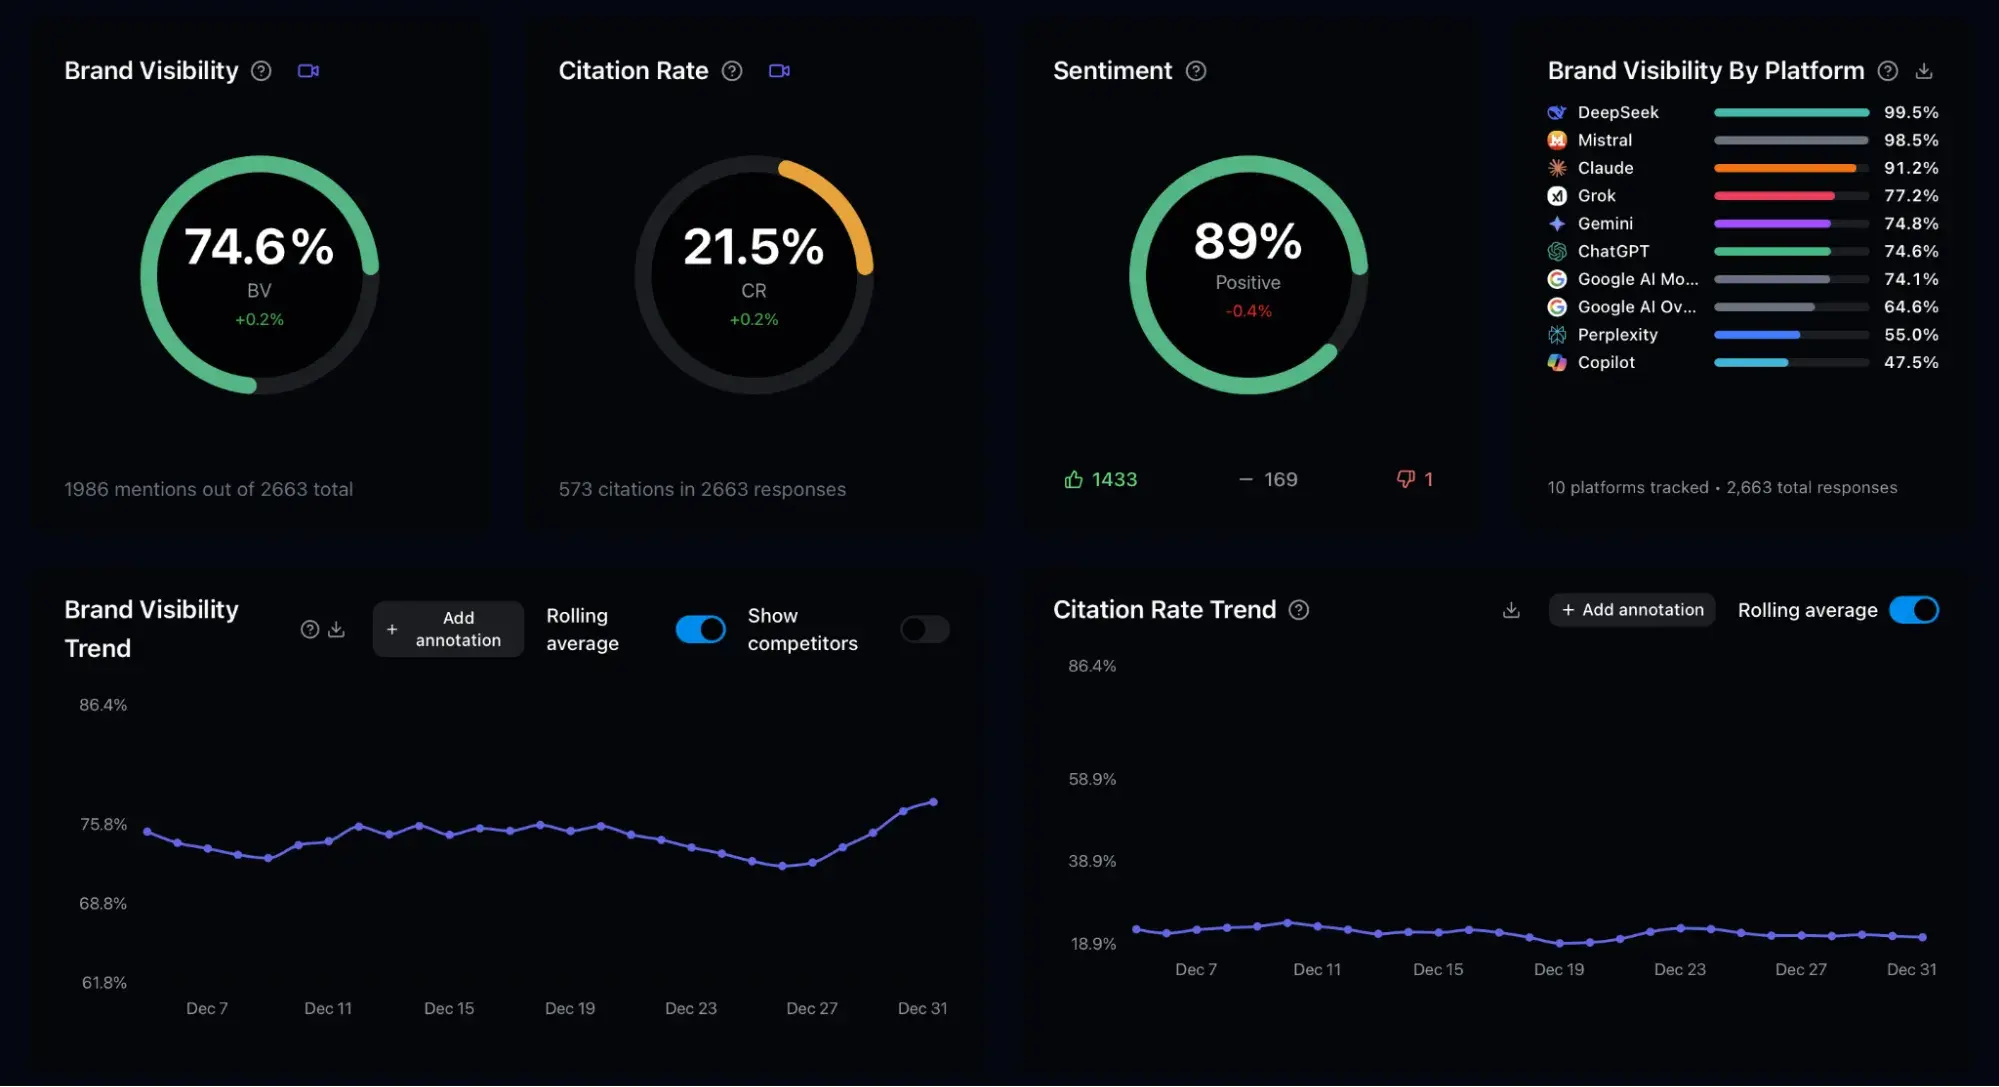
HubSpot AEO gives marketers a clear view of how their brand shows up across major answer engines like ChatGPT, Gemini, and Perplexity — along with a concrete plan to improve that visibility. It tracks share of voice at the prompt level, showing which buyer questions include a brand, where competitors are being recommended instead, and where a brand is not showing up at all. It also surfaces the sources and content types influencing AI answers, helping teams understand what actually drives inclusion.

Rather than stopping at reporting, the tool translates visibility data into prioritized, plain-language recommendations, making it easy to move from insight to action without deep AEO expertise.

Best for: Teams that want a fast, accessible way to understand and improve AI share of voice without committing to a full marketing platform.

What I like: Clear, actionable recommendations tied directly to visibility gaps — not just another dashboard.

HubSpot AEO in Marketing Hub

share of voice tools, hubspot 2

AEO in Marketing Hub Pro and Enterprise takes AI share of voice a step further by connecting visibility insights to HubSpot’s complete marketing suite. Teams can track how a brand appears across answer engines and tie that data to the CRM, so prompt suggestions and recommendations are based on actual customers, not generic keywords.

The key difference is execution: With AI visibility data sitting alongside campaign metrics, marketers can connect share of voice directly to demand generation.

Best for: Growth, demand gen, and RevOps teams that want to connect AI share of voice to pipeline and revenue.

What I like: Teams get AEO and SEO insights in the same platform.

Semrush AI Visibility (Enterprise AIO)

ai share of voice tools, semrush aio

Semrush has expanded significantly into AI visibility. Their Enterprise AIO feature monitors brand presence across ChatGPT, Google AI Mode, and Perplexity, includes share-of-voice analysis, and surfaces “Prompt Volume” data to help teams prioritize high-intent AI queries over high-volume informational ones.

Semrush customers should check what’s available in their plan before purchasing a standalone tool.

Best for: Teams already on Semrush who want AI SOV without adding another vendor.

What I like: Prompt Volume segmentation, which surfaces the difference between queries with high traffic and those with high commercial intent.

Ahrefs Brand Radar

ai share of voice tools, ahrefs brand radar

Ahrefs’ Brand Radar module tracks brand mentions across AI-generated answers and connects them to the backlink and authority signals that tend to drive AI citations.

Unlinked mention tracking across Reddit, TikTok, and YouTube is particularly valuable, since these “human-first” platforms heavily influence LLM training data.

Best for: Teams that want to understand why they’re getting cited (or not) in AI answers — not just whether they are.

What I like: The connection between link authority data and AI visibility, which makes prioritization decisions much clearer.

Otterly.AI

share of voice tools, otterly

Otterly.AI is a dedicated, purpose-built AI visibility platform that tracks brand mentions and share of voice across ChatGPT, Gemini, Perplexity, and other platforms. It offers prompt-level benchmarking and a free tier to get started.

Best for: Teams that want a dedicated AI SOV tool without the overhead of an enterprise SEO suite.

What I like: Free entry point and clean prompt-level reporting

Profound

ai share of voice tools, profound

Profound is an enterprise-grade AI visibility platform with deep citation tracking, brand sentiment analysis, and attribution from AI-generated traffic to the pipeline. Best for teams that need to connect AI SOV to revenue.

Best for: Mid-market to enterprise teams that need to demonstrate AI visibility ROI to leadership.

What I like: The attribution layer — most AI SOV tools tell teams where they’re visible; Profound helps them connect that visibility to business outcomes.

How to Use Share of Voice Tools for Social Media

Social media share of voice measures the share of brand mentions and conversation volume across selected social platforms. The formula:

Social SOV (%) = Your brand mentions ÷ Total market mentions × 100

For example, if there were 10,000 social mentions about a brand’s product category last month and it was mentioned 2,500 times, its social SOV is 25%.

What social SOV actually captures: Social SOV is highly responsive — it moves within days of a campaign launch, a PR event, or a product release. That makes it a useful short-term campaign measurement tool.

What it doesn’t capture well: Platform coverage gaps (a tool that monitors X, LinkedIn, and Facebook but not TikTok or Reddit will systematically undercount certain audiences), sentiment quality (volume isn’t value — a spike in negative mentions can inflate SOV while damaging brand equity), and owned versus earned distinction.

Fast Setup Workflow

  1. Define competitor set (3–6 competitors are manageable).
  2. Create query groups: branded terms, product category terms, campaign hashtags, and executive names.
  3. Set up sentiment filters and alerts for crisis thresholds.
  4. Establish a reporting cadence — weekly during active campaigns, monthly for always-on measurement.
  5. Segment SOV by platform to understand where each competitor wins and loses.

Social Media SOV Tools

Sprout Social

share of voice tools, sprout social

Sprout Social’s Listening capabilities offer social SOV tracking with sentiment analysis, influencer scoring, and trend detection. Its 2026 capabilities include brand health monitoring that helps teams track not just volume but also the trajectory of sentiment over time.

For more details on social analytics broadly, check out our guide to social media analytics tools.

Best for: Teams running active social campaigns who need near-real-time SOV tracking with strong reporting.

What I like: The sentiment matrix that shows whether SOV growth is coming from positive or negative conversations.

Brandwatch

social share of voice tools, brandwatch

Brandwatch provides advanced social and traditional media SOV tracking with AI-powered insights and custom dashboards. Strong for brands that want a single tool covering social media, news, and forums in one reporting layer.

Best for: Teams that want cross-channel social and PR SOV in one platform.

What I like: The demographic and geographic segmentation, which lets marketers see whether their SOV strength varies by region or audience segment.

Brand24

social share of voice tools, brand24

Brand24 offers real-time media monitoring across blogs, forums, news, and social channels with sentiment analysis and automated SOV reports. Pricing starts at $199/month for the Individual plan, with higher tiers for more mentions and advanced analytics.

Best for: Growing companies that want solid social and media SOV without enterprise pricing.

What I like: The influencer scoring feature, which helps marketers understand which voices are driving their category’s conversation.

Hootsuite Listening

share of voice tools, hootsuite

Hootsuite’s native social listening integrates directly with publishing and scheduling workflows, making it a strong choice for teams that manage social execution and measurement in one platform.

Best for: Teams already on Hootsuite for social publishing who want to add SOV without another tool.

What I like: The workflow integration — seeing SOV data alongside the publishing calendar changes how marketers plan content.

Which share of voice tools help with PR and media monitoring?

PR and media share of voice measures earned media visibility by outlet, geography, message, and sentiment. It answers the question: Out of all the coverage happening in a brand’s category, how much is about it — and how does that compare to competitors?

This type of SOV is, in my experience, the most underutilized by growth marketing teams.

Content, demand gen, and SEO teams often operate with no visibility into the earned media landscape, which means they miss a key signal: When a competitor is getting significant PR traction, it often precedes increases in branded search volume, domain authority from press links, and category awareness — all of which affect SEO and social SOV downstream.

Connecting PR SOV to traffic and demand: The workflow I recommend for growth teams is to use PR SOV data to identify when a competitor is getting outsized coverage on a specific topic, then run a branded search volume check in Google Trends or Search Console.

If their media traction is driving branded search, it’s often worth responding with content, commentary, or your own PR push — before it shows up in your SEO SOV numbers six months later.

PR/Media SOV Tools

Meltwater

share of voice tools for pr and media, meltwater

Meltwater is a leading media intelligence platform with SOV tracking by outlet, geography, and message. Its journalist-and-outlet relationship features make it useful for comms teams looking to pair measurement with outreach.

Best for: Comms-heavy teams that need both measurement and media relationship management.

What I like: The geographic SOV breakdown, which is particularly useful for brands with regional PR strategies.

Cision

share of voice tools for pr and media, cision

Cision offers comprehensive PR monitoring, SOV tracking, and sentiment analysis across print, broadcast, and digital media. Strong for enterprise comms teams that need regulatory-grade coverage.

Best for: Enterprise PR and comms teams with compliance requirements.

What I like: The breadth of outlet coverage, including broadcast and print, that competitors sometimes miss.

Brand24

share of voice tools for pr and media, brand24

Beyond social, Brand24’s media monitoring extends to news sites, blogs, and forums, giving it a solid PR SOV use case for teams that don’t need a full enterprise PR platform.

Best for: Growing companies that want PR + social SOV in a single, affordable tool.

What I like: The real-time alerting, which is excellent for catching coverage spikes before they pass.

Mention

share of voice tools for pr and media, mention

Mention provides real-time media monitoring across the web and social channels, with SOV tracking and competitor benchmarking — a more accessible price point than enterprise media monitoring platforms.

Best for: Startups and early-stage teams that need PR SOV without enterprise spend.

What I like: Clean, fast interface and alert system.

Share of Voice vs. Share of Market vs. Share of Search

These three metrics are frequently conflated. They are not the same thing, and treating them interchangeably leads to bad decisions.

  • Share of Voice (SOV) is the percentage of visibility a brand earns across a defined channel or market — measured in impressions, mentions, rankings, or citations. It measures presence, not revenue.
  • Share of Market (SOM) is the percentage of actual revenue or units sold that a brand captures within a defined market. It measures business outcomes, not visibility. Learn more about adjacent concepts in our guide to share of wallet.
  • Share of Search (SOS) is a specific variant of SEO share of voice that measures the relative volume of branded search queries for a brand versus competitors.

It’s a leading indicator of future market share, and research from companies like Kantar has shown a strong correlation between share of search and eventual market share shifts — often with a 6–12 month lead time.

HubSpot AEO and Marketing Hub AEO features complement traditional share of search analysis by showing not just how often a brand is searched, but how often it’s actually recommended in AI-generated answers — a critical layer as discovery shifts from search engines to answer engines.

A Simple Selection Framework

  • Use SOV when marketing teams need to measure campaign effectiveness, benchmark visibility, or track competitive positioning across a channel.
  • Use SOM when teams need to evaluate revenue performance or present business results to leadership.
  • Use SOS when teams want a leading indicator of brand momentum — it’s particularly useful for tracking whether a new campaign or content push is actually building category awareness.

Common Reporting Mix-ups and Fixes

The most common mistake I see: Using SOV as a proxy for SOM without accounting for the lag. SOV tends to lead SOM by several months in growing categories. If SOV is rising but SOM isn’t (yet), that’s not a failure — it’s a pipeline.

The fix is to track both metrics on a shared dashboard and set explicit expectations for when visibility gains are expected to convert to revenue.

How to Connect Share of Voice to Pipeline and Revenue

This is where most SOV measurement programs break down. Teams build solid channel-level SOV dashboards, present them in marketing reviews, and then wonder why leadership keeps asking “But what does this mean for the business?”

The answer lies in building a measurement framework that connects SOV to leading indicators, then to pipeline, then to revenue — and making that chain visible in the CRM. AEO features in Marketing Hub Pro and Enterprise connect AI visibility data directly to CRM records and attribution reporting, allowing teams to analyze how improvements in AI share of voice influence traffic, lead generation, and pipeline over time.

A Four-layer SOV-to-revenue Framework

  • Layer 1: Visibility (SOV). Track SOV by channel — SEO, social, PR, AI — against your defined competitor set. Set quarterly SOV targets by channel.
  • Layer 2: Leading indicators. Connect SOV shifts to branded search volume (via Google Search Console or Google Trends), direct traffic, and organic session growth. These are the signals that SOV gains are translating into awareness.
  • Layer 3: Pipeline inputs. Connect organic sessions and branded traffic to form fills, demo requests, and trial starts. If SEO SOV is growing but organic leads aren’t, a brand likely has a conversion problem — not a visibility problem.
  • Layer 4: Revenue. In the CRM, tag leads by acquisition channel and track them through to Closed Won. This is where marketing automation and attribution tools become essential. Without multi-touch attribution, marketers will struggle to accurately credit organic and earned channels.

Target-setting and review cadence: I recommend setting annual SOV targets by channel (e.g., “grow SEO SOV from 12% to 18% in our core keyword cluster”) and reviewing progress monthly. For AI SOV, quarterly reviews are more realistic given how rapidly the landscape is shifting. For social and PR SOV, weekly pulse checks during campaigns, monthly for always-on.

Pro tip: If a team is using HubSpot, they can build a SOV-to-revenue dashboard that pulls organic traffic data from their connected domain, CRM lead sources, and attribution reports — giving them a single view of the visibility-to-pipeline chain.

This eliminates the manual spreadsheet work that makes SOV reporting unsustainable for most growth teams.

How to Get Started and Improve Share of Voice

If a team is starting from zero, here’s how to operationalize SOV measurement without building a research program that collapses under its own complexity.

Quick-start SOV checklist:

  • Define your competitive set. Pick 3–6 direct competitors. Add more later if needed.
  • Pick one channel to start. For most growing companies, start with SEO as it’s the most actionable and most directly tied to content investment.
  • Build your keyword taxonomy. Group keywords by product line, persona, and funnel stage before starting to track. This will save enormous time when you need to explain which SOV is moving.
  • Choose your tool. Match the tool to your channel, budget, and growth stage (see the selection guidance throughout this guide). Don’t try to track every channel on day one.
  • Establish a baseline. Run the first measurement before any optimization work to have a true starting point.
  • Connect SOV to a business outcome. Even loosely — “We expect a 5-point increase in SEO SOV to generate X incremental organic leads per month.” This is what turns SOV from a vanity metric into a strategic one.
  • Set a review cadence and stick to it. Monthly for SEO and PR; weekly for social during campaigns; quarterly for AI SOV.
  • Build your AI SOV prompt set. Use the five-step process outlined earlier. Start with 50–100 prompts, run your baseline in HubSpot’s AEO Grader, then invest in a dedicated tool based on findings.

Teams can start with HubSpot AEO to benchmark and improve their AI visibility, then use AEO features in Marketing Hub to operationalize those insights — turning visibility gaps into content, campaigns, and measurable pipeline impact within a single platform.

Frequently Asked Questions About Share of Voice Tools

What is the difference between share of voice and share of market?

Share of voice measures a brand’s visibility within a channel or market — how often people see it relative to competitors. Share of market measures a brand’s portion of actual revenue within a defined category.

The two are related but distinct: Research consistently shows that brands with SOV above their share of market tend to grow (because they’re “over-investing” in visibility relative to their current size), while brands with SOV below their SOM tend to shrink. But the connection isn’t immediate — SOV typically leads SOM by months, not weeks.

How do I increase share of voice without overspending?

The highest-leverage, lowest-cost SOV channels are SEO and PR. A well-executed content program targeting high-intent keywords with genuine informational depth will compound over time, generating SEO SOV gains that don’t require continuous ad spend.

On the PR side, executive thought leadership (bylines, podcast appearances, speaking) earns media SOV at relatively low cost. For social, community building and consistent engagement outperform sporadic campaign pushes. The key is patience: Organic SOV channels take longer to move than paid, but the gains are more durable.

Do I need a SOV tool, or can I build this in a spreadsheet?

Marketers can approximate SEO SOV manually if they’re tracking a small keyword set (under 50 keywords) and only monitoring one or two competitors — though it’s time-intensive. For social, PR, or AI SOV, manual tracking isn’t realistic at any meaningful scale.

The better question is where to start with paid tools.

I’d recommend beginning with a free baseline (HubSpot’s AEO Grader for AI SOV, Google Search Console for organic visibility) before committing to a paid platform. Use the baseline to identify which channel has the most competitive gap, then invest there first.

How often should I refresh my AI SOV prompt set?

At minimum, quarterly. In practice, refresh triggers include: major AI platform updates (new model releases, changes to Google AI Overviews behavior), significant product launches or repositioning by you or a key competitor, and any time your AI SOV score shifts more than 10 points between reviews.

The rapid pace of AI model updates means that a prompt set built six months ago may no longer reflect how buyers are querying AI systems today.

Which share of voice tools fit startups vs. mid-market vs. enterprise?

Startups: Start free or near-free. Consider the following tech stack:

  • HubSpot’s AEO Grader for AI SOV baseline.
  • Google Search Console + Ahrefs Lite ($129/month) for SEO SOV.
  • Brand24 Individual ($199/month) for social + PR SOV.
  • Total: under $350/month to get meaningful signals.

Mid-market: Add dedicated channel depth. Consider the following tech stack:

  • Semrush Business ($449/month) for SEO + AI Overviews SOV.
  • HubSpot AEO ($50/month) for AI SOV.
  • Sprout Social for social SOV. Consider Meltwater or Mention for PR SOV.
  • Total: $800–$1,500/month, depending on channel coverage needs.

Enterprise: Platform consolidation and revenue attribution become the priority. Consider the following tech stack:

  • BrightEdge (enterprise pricing) for SEO + AI SOV with attribution.
  • HubSpot Marketing Hub Enterprise (contact for pricing) for AI SOV integrated with CRM and marketing software.
  • Prices vary based on enterprise size.

From Visibility to Revenue: Turning Share of Voice Into a Growth System

Share of voice is no longer a single-channel metric — it’s a multi-layered view of how a brand shows up across search, social, media, and increasingly, AI-driven discovery. As this guide has shown, the real value of SOV comes from consistency: defining a clear competitive set, standardizing measurement, and connecting visibility data to meaningful business outcomes like pipeline and revenue.

AI share of voice, in particular, is quickly becoming a critical addition to that measurement stack. Unlike traditional channels, where visibility is often tied to rankings or impressions, AI visibility reflects whether a brand is actively recommended in the moments that shape buyer decisions. That shift makes prompt strategy, content authority, and entity recognition just as important as keyword rankings.

Tools like HubSpot AEO make it easier to understand where a brand stands in this new landscape, while AEO features in Marketing Hub help teams act on those insights — connecting AI visibility directly to content execution, campaign performance, and CRM data. For growing companies, that combination turns share of voice from a static report into a system for continuous optimization.

The next step is simple: Pick one channel, establish a baseline, and start measuring. From there, layer in additional SOV types — including AI — and build toward a unified view of visibility and growth.

Categories B2B

AI citation tracking: How to track (and grow) AI engine citations

AI search engine citation tracking helps measure brand visibility and authority in AI-powered search results. As AI-powered search experiences reshape how people discover information, evaluate vendors, and build shortlists, visibility inside AI answers is no longer a vanity metric. If AI engines aren’t citing your brand, you’re missing influence at the exact moment buyers are forming opinions.

Get Started with HubSpot's AEO Tool

According to HubSpot’s State of Marketing Report, which surveyed more than 1,500 marketers, brand awareness is one of the top marketing priorities through 2026, alongside increasing conversion rates, closing more deals, driving revenue, and strengthening customer relationships.

In an AI-search world, those goals are more interconnected than ever. Why? Because a growing share of brand discovery now happens inside AEO tools and within Google’s AI Overviews (AIO). Users increasingly rely on AI-driven responses to answer informational queries, compare service providers, and explore products before they ever click through to a website.

AI citation tracking allows you to measure where, how, and why AI engines reference your brand, content, and expertise in generated answers so you can shape your AI strategy and turn AI visibility into growth. Tools like HubSpot AEO track brand visibility, citation frequency, and share of voice across major answer engines and then give teams the recommendations necessary to take action.

In this guide, I break down what AI citations actually are, how they differ from mentions, how to track them, and how to grow your presence inside AI-generated answers.

Table of Contents

What are AI citations?

An AI citation occurs when an AI engine explicitly references your website as a source for its response. That typically includes a link to your content on platforms such as ChatGPT, Perplexity AI, or Google AI Overviews (AIO).

There are two types of citations — those that appear in a sidebar and those within the response. Here’s what both types of AI citations look like in Google’s AIO:

how to track ai search engine citations using manual analysis. the screenshot from google’s ai overviews with an arrow pointing to two types of citations.

When AI cites your content, it signals that your website contributed directly to the answer it generated. That’s the clearest indicator of content authority within AI-generated search experiences.

What counts as an AI mention vs an AI citation?

An AI mention refers to a brand or piece of content referenced in an AI answer without a direct link. For example, an AI response might list your company among “top providers” or “recommended tools” in a category. Your brand appears in the narrative, but there’s no linked URL or formal source attribution. Here’s what AI mentions look like in ChatGPT:

how to track ai search engine citations using manual analysis. screenshot from chatgpt shows mentions of crm tools but no links, helping people see that mentions do not include links, unlike citations.

The main difference between mentions and citations: Mentions are conversational visibility. Citations are sourced authority.

Both mentions and citations are helpful, but they serve different strategic purposes. Mentions help you understand whether your brand is present in AI-driven discussions. Citations help you understand whether your content is influencing those discussions.

ai citation tracking, graphic that explains ai mentions vs ai citations

How to Track AI Engine Citations

The challenge with AI citations is measurement. AI visibility isn’t as straightforward as traditional SEO tracking, but there are some things you can do to get an idea about how your site is performing. Tracking AI citations requires logging citations and mentions by engine, keyword, and date. Here’s what you can do.

Manually search your most important keywords.

One of the simplest ways to start is to manually search for your priority keywords on AI-driven platforms like ChatGPT, Perplexity AI, and Google AI Overviews. Run informational queries, comparison-based searches, and “best of” prompts that mirror real buyer behavior. Check whether AI overviews:

  • Mention your brand
  • Cite your website as a source
  • Show competitors instead

Tip: If competitors appear where you think you should be, then you’ve identified a potential opportunity. You can then look at what competitors are doing and develop a plan to replace their citations with yours.

Although manual searches are easy, they are extremely limited. AI results are highly personalized based on user history, context, and even phrasing, so your own usage of the tool you’re searching in will influence output. Two users can see different answers to the same query; the results are not static.

Most importantly, you can’t realistically test every relevant query variation yourself. Manual searches are useful for directional insight, but they’re not scalable or reliable enough for comprehensive tracking.

Look for parameters in URLs.

When AI engines send traffic to your site, they often include identifiable referral parameters in the URL. These parameters don’t tell you how many times an AI engine cited your content, but they do confirm that a citation generated a click. For example, links generated by ChatGPT frequently include:

?utm_source=chatgpt.com

By monitoring these parameters in your analytics platform, like Google Analytics 4 (GA4), you can attribute visits to different types of AI agents. Here’s what a URL looks like if a user visits it from ChatGPT:

how to track ai search engine citations using url parameters. screenshot from a website cited by chatgpt shows how you can see evidence of chatgpt citations within the url parameter.

Source

Similarly, traffic from Google AI Overviews often includes a #text= fragment in the URL. That indicates the user clicked a cited source in an AI Overview, and Google is highlighting the specific passage it referenced. Here’s what the #text=fragment looks like:

how to track ai search engine citations using url parameters. screenshot from a website cited by google’s ai overviews shows how you can see evidence of google’s ai overviews citations within the url parameter.

Source

Track traffic using Google Analytics.

Inside Google Analytics 4 (GA4), you can monitor referral traffic from AI systems. Use GA4 and GSC to estimate AI-driven traffic using event parameters and CTR analysis. Here’s how to use GA4:

Reports → Acquisition → Traffic Acquisition

how to track ai search engine citations using google analytics 4. annotated screenshot shows the steps someone must take to identify ai traffic referrals.

From there, filter by:

  • Session source/medium
  • Referral domain (e.g., chatgpt.com, perplexity.ai)

You can also create comparison segments specifically for AI traffic sources. That allows you to analyze engagement metrics such as:

  • Engagement rate
  • Conversions
  • Assisted conversions
  • Revenue

While this approach won’t tell you how often AI responses cite your content, it does show whether citations are driving meaningful traffic. If referral visits from AI systems are increasing — especially for high-intent pages — it’s a strong indicator that your citation footprint is growing for commercially relevant queries.

Set up custom dashboards that isolate AI referral domains over time

For teams that need a scalable, client-ready way to monitor AI citation impact, a dedicated dashboard in Looker Studio is a practical option.

Here’s what mine looks like:

screenshot from my looker studio report showing how i track visits from ai citations

You can build a dashboard that includes:

  • Sessions from AI referral domains
  • Engagement rate
  • Conversions and revenue
  • Assisted conversions
  • Landing pages receiving AI traffic
  • Month-over-month AEO trend comparisons

Using regex filters on the Session source / medium dimension makes this easy to scale. Instead of manually checking GA4 each time, your dashboard becomes a live AI visibility panel that updates automatically.

This approach doesn’t measure raw citation frequency inside AI engines, but it does measure impact. If AI-driven sessions are increasing over time, particularly for high-intent or educational content, it’s a strong signal that your citation footprint is growing.

Pro Tip: Kyle Rushton McGregor, my favorite GA4 specialist, makes setting up custom AI Looker Studio dashboards really easy with his tutorial.

Free benchmarking tools: Use HubSpot AEO Grader for ad-hoc visibility checks.

If you want a quick, directional snapshot of how your brand (and competitor brands) are performing, HubSpot AEO Grader provides a baseline assessment of AI visibility and citation opportunities. It helps you evaluate how well your site is performing in AI systems.

Because it’s free, teams can evaluate competitor domains without adding software cost. That makes it useful for side-by-side comparisons, helping you identify structural or content gaps that may explain why competitors are earning more AI visibility than you.

However, it’s important to understand the limitations. AEO Grader does not track live AI citations the way dedicated tools like HubSpot AEO do (see the next section for more on these types of AEO tools). It doesn’t monitor citation frequency across queries, citation share over time, or alert you to citation errors. Instead, it provides a static evaluation based on your site’s current structure and content signals.

As a free tool, AEO Grader relies heavily on manual interpretation. The tool still requires manual interpretation of competitor scores, patterns, and likely performance implications. Here’s a view of what AEO Grader looks like:

how to track ai search engine citations using free aeo tools like aeo grader. screenshot from the ai search grader provides an idea of how brands are performing with ai citations.

Use tracking tools.

Manual checks and analytics give you partial visibility. Dedicated AI citation-tracking platforms provide a more systematic approach. Tools like HubSpot AEO are designed specifically to measure how often AI engines cite your content.

screenshot from hubspot aeo shows how graphs are tracking ai citations.

Rather than relying solely on referral traffic, they monitor AI responses at scale, track citation frequency across keywords, and benchmark your citation share against competitors.

That gives teams visibility into impression-level presence, not just clicks to the site. Visibility matters because many AI searches don’t result in clicks, so measuring clicks alone won’t give you the full picture of your influence. That provides clarity on:

  • Which pages are earning citations
  • Which queries trigger them
  • Where competitors are outperforming you
  • How your citation share changes over time

How to Close the Citation Gap With Your Content

Closing the mention-citation gap involves updating and optimizing content to earn more AI citations. Here are five AEO best practices for increasing your chances of earning a citation:

Create definitive, source-worthy content.

AI engines prioritize content written for Search Generative Experiences (SGE). That means the content appears authoritative, complete, and trustworthy. Pages that comprehensively answer a question (with clear structure and supporting evidence) are more likely to be cited as sources.

How to do it

  • Build in-depth guides that fully answer a query, not just skim it
  • Include original data, statistics, or expert commentary
  • Cite reputable third-party sources to strengthen credibility
  • Use clear headings that mirror common search phrasing
  • Keep content updated to maintain relevance

Creating the level of depth required to rank well and earn citations and mentions in AI likely requires more than just good writing. You need strong writing workflows, including research, editing, structured content systems, and well-placed product or service promotion.

Tools like Breeze accelerate research, surface related questions, and support content planning that’s extraction-friendly directly within your workflow.

Content Hub helps teams operationalize templates, briefs, and reusable content patterns that make answers clearer, more structured, and easier for AI systems to extract at scale.

Visibility doesn’t stop at publication. Marketing Hub allows teams to orchestrate cross-channel promotion and nurturing around answer-ready content. Its SEO tools help identify high-intent informational queries, content gaps, and structural optimizations that support both traditional SEO and AEO, which increasingly overlap.

Optimize for Informational Query Intent

AI citations most frequently appear in informational queries, such as “what is,” “how to,” “best,” “comparison,” and “why” searches, which help shape buyer education. Effective citation-focused content directly addresses these query types.

How to do it

  • Identify high-volume informational keywords or prompts in your category
  • Create dedicated pages that directly answer those questions
  • Structure content with concise, quotable definitions
  • Add comparison tables for “best” and “vs” queries
  • Ensure early paragraphs clearly summarize the answer

Improve content structure for AI parsing.

AI systems extract and synthesize content. Clear formatting and structure make it easier for models to understand and reference your page.

How to do it

  • Use descriptive H2 and H3 headings
  • Add FAQ sections with direct answers under each question
  • Use bullet points and numbered lists for clarity
  • Implement structured data (FAQ, HowTo, Article schema)
  • Keep paragraphs concise and focused

Build topical authority, not just isolated pages.

AI engines are more likely to cite brands that demonstrate depth across a topic cluster, not just a single well-written article.

How to do it

  • Create interconnected content hubs around core themes
  • Internally link related articles strategically
  • Publish supporting subtopics that reinforce expertise
  • Maintain consistent terminology across content
  • Update older posts to align with your authority narrative

Strengthen off-site signals & brand associations.

AI models learn associations from across the web. Strong third-party references increase the likelihood that your brand is surfaced or cited.

How to do it

  • Contribute thought leadership to reputable industry publications
  • Earn mentions in listicles and “top provider” roundups
  • Publish original research that others will reference
  • Encourage partners and customers to reference your brand publicly
  • Maintain consistent brand positioning across platforms

What are the best tools for tracking AI search citations?

AI citation tracking is still an emerging category, which means different tools serve different purposes. Some are purpose-built for AI citation monitoring. Others provide supporting signals. The right choice depends on your business size, reporting needs, and level of sophistication. Here are four strong options:

Xfunnel

screenshot from the xfunnel tool showing analytical graphs with “citation analysis” in the left-hand menu.

Source

Xfunnel is purpose-built for tracking AI engine citations at scale. It monitors how often your brand and URLs are cited across AI systems and benchmarks your citation share against competitors.

Unlike analytics-based tracking (which only shows traffic after a click), Xfunnel focuses on citation visibility itself, including:

  • Citation frequency across defined query sets
  • Competitive citation share
  • Displacement events
  • Trends over time

That makes it ideal for growth teams, B2B companies, and agencies that need structured reporting on AI visibility. If AI search is strategically important to your revenue model, this is the most complete solution in the market right now.

Best for: Dedicated AI citation tracking and competitive share

HubSpot AEO

aeo citation tracking, hubspot aeo tool

HubSpot AEO is purpose-built for tracking and improving how a brand appears across major answer engines, including ChatGPT, Perplexity, and Gemini. Unlike analytics-based tracking, HubSpot AEO monitors AI responses directly. It measures citation frequency, brand visibility, and competitive share of voice across a defined set of prompts.

HubSpot AEO centralizes AI citation tracking in a single dashboard so performance can be monitored consistently over time and connected to content strategy and business outcomes. It’s available within HubSpot Marketing Hub Pro and Enterprise, or can be purchased as a standalone tool without an existing HubSpot subscription.

Best for: Connecting AI citation tracking to content action

Semrush One

screenshot from semrush’s ai visibility overview.

Source

Semrush is one of the longest-standing SEO platforms in the industry and is well-placed for AI SEO tracking. While it’s not a pure AI-powered citation-tracking tool like Xfunnel, Semrush is increasingly incorporating AI search visibility insights into its broader platform. It allows you to:

  • Monitor keyword performance shifts that may correlate with AI Overviews
  • Track branded and non-branded visibility changes
  • Identify competitor content gaining traction
  • Analyze content gaps at scale

For mid-sized to enterprise teams already embedded in Semrush, it’s a practical way to layer AI search monitoring into existing workflows. It won’t give you granular citation frequency across AI engines, but it does provide broader visibility signals that help contextualize AI performance within your overall search strategy.

I’ve personally used Semrush for years across technical SEO, keyword research, competitor analysis, and content strategy. I started using the AI tools and found the recommendations were good and aligned with the ones I was giving my clients.

Best for: Established SEO teams expanding into AI tracking

AEO Grader

screenshot from aeo grader shows how easy it is to get started and grade your brand in ai search.

AEO Grader is a free tool that evaluates a site’s optimization for answer engines and AI-driven search environments.

It assesses structural and content factors that influence the likelihood of AI citation, such as clarity, schema usage, and answer formatting. Because it’s free, you can also run competitor domains through it for quick side-by-side comparisons.

That said, AEO Grader is not a tracking platform. It doesn’t monitor live citations or measure citation share over time. Instead, it provides a static snapshot of readiness.

I personally use AEO Grader as part of audit workflows and in pitch scenarios. It’s a fast way to assess how a prospect’s site is performing in AI visibility and to identify obvious optimization gaps.

Best for: Quick diagnostics and benchmarking

Frequently Asked Questions About Tracking AI Search Engine Citations

How often should we refresh AI citation and mention tracking?

At a minimum, review AI citation and mention tracking monthly. AI search environments evolve quickly: models update, competitors publish new content, and citation patterns shift as authority signals change. A monthly review helps you identify trends, displacement events, and emerging query opportunities before they affect the pipeline.

Should we separate AI-influenced traffic from organic in reports?

Yes, segment AI-influenced traffic from traditional organic search in your reporting. While some AI traffic may technically fall under organic channels, its user behavior, intent patterns, and conversion pathways can differ significantly from standard blue-link search traffic. For my clients, AI traffic converts at around 7% compared to around 1% of organic traffic.

What is the best way to prioritize content for citations vs mentions?

If your goal is authority and influence, prioritize citation-ready content first. Informational, high-trust assets, such as guides, definitions, comparisons, and research-backed articles, are more likely to earn citations because AI engines rely on them as sources.

Mentions, on the other hand, are often influenced by brand authority and third-party signals. If you’re earlier in your growth journey, investing in thought leadership, digital PR, and brand positioning can increase conversational visibility. Ideally, your strategy should balance both authoritative content to earn citations and brand-building efforts to expand mention presence.

How do we handle privacy and consent when adding tracking parameters?

If you’re using UTM parameters or tracking referral sources from AI systems, you’re typically working with standard analytics practices. However, you should ensure your cookie consent mechanisms and privacy policies clearly explain how tracking data is collected and processed.

AI Citation Tracking Is the New Frontline of Brand Visibility

AI citation tracking is a visibility metric for the AI-search era. Mentions show whether your brand is part of the conversation. Citations show whether your content is shaping it.

To track effectively, you need layered measurement: manual checks for context, analytics for traffic impact, dashboards for trend monitoring, and dedicated tools for citation share and competitive displacement.

Tools like HubSpot AEO can help teams connect AI visibility data to traffic, engagement, and reporting workflows. Integrating citation insights into a broader analytics stack makes them easier to act on.

In my experience, a monthly review cadence is the minimum required to keep AI visibility reporting useful. More frequent check-ins can help catch shifts earlier, but even a simple baseline from a free tool like AEO Grader can help brands increase AI-related citations and mentions.

I noticed that the Brief asks for factor-based H3s in this section, but the current structure is method-based. It works, but if stricter brief alignment is needed, the H3s could be reframed around inputs like query set coverage, referral visibility, analytics segmentation, dashboard reporting, and dedicated citation platforms.


Categories B2B

Generative engine optimization KPIs that actually matter for marketing teams

Generative AI is changing how people discover brands, products, and information. Because it disrupts the buyer journey, it requires new metrics, specifically GEO KPIs, that accurately reflect performance within these AI engines.

With Google AI Overviews appearing in over 20% of searches, marketing leaders are now being asked new questions by executives: Are we showing up in AI answers? Are we being cited? Or are AI engines recommending our competitors?

Get Started with HubSpot's AEO Tool

As search behavior shifts, traditional SEO KPIs alone can no longer explain visibility or downstream revenue impact.

This guide breaks down the GEO KPIs that actually matter, how to measure GEO success, and how to connect AI visibility to business outcomes using tools that marketing teams already trust, including HubSpot AEO.

Why GEO KPIs Matter Now

As generative AI becomes a primary decision layer in the buyer journey, generative engine optimization (GEO) KPIs become important performance indicators. According to OpenAI, nearly half of all ChatGPT usage falls into the “Asking” category, where users rely on AI for advice, evaluation, and guidance rather than simple task execution.

For many users — 61% of them — these “asks” are product recommendations. This means brand preference is influenced by AI-generated answers, often before a prospect visits a website.

Traditional marketing KPIs don’t capture this layer of visibility. Without understanding where and how often a brand appears in AI answers, it can be challenging to create a strategy to regain or maintain that influence.

From my experience, maintaining visibility inside AI-answers engines is fragile without a deliberate GEO strategy. After a targeted content update on my own site, I saw my content begin surfacing ahead of long-established industry publishers in AI-generated answers within 96 hours — without any corresponding jump in traditional search rankings.

If I had been tracking SEO metrics alone, I would have missed that change entirely. GEO KPIs exist to pinpoint these shifts before they translate into lost authority or, worse, downstream revenue impact.

Generative Engine Optimization KPIs to Track

The metrics below reflect how AI search behaves in the real world and give teams a clearer, more honest way to evaluate how their brands appear in AI-generated answers. Key metrics for measuring GEO success include AI citation frequency, answer inclusion rate, entity authority signals, AI referral traffic, AI share of voice, and AI-driven leads.

To understand which GEO KPIs and metrics actually hold up, I spoke with Kristina Frunze, founder of WebView SEO, in a recorded interview for the Found in AI podcast.

1. AI Citation Frequency

AI citation frequency tracks how often a brand is named directly in AI-generated answers across large language models (LLMs). Direct brand mentions are the most reliable signal that an AI engine recognizes and recalls a brand.

What the Experts Say: Frunze told me, “For the purpose of AI citations, at the moment, direct brand mentions are the best way to track it. The tools are evolving, and they’re not 100% accurate, but this is what we can rely on right now.”

How I use the metric: I use citation frequency as a baseline trust signal. If a brand isn’t being named at all, no amount of traffic or conversion optimization matters yet. But since I have a sense of where a brand should appear, I can track changes over time.

For a brand that already appears inside AI answers, I track changes in citations after content updates to see whether AI engines recognize the brand as a legitimate source or cite it more often.

How to track: Monitor direct mentions of a brand in AI-generated answers using tools like HubSpot AEO, XFunnel, Addlly AI, or Superlines. Track changes over time after content updates to see whether AI models increasingly recognize and cite the brand.

Pro tip: Use HubSpot SEO Marketing Software to align cited pages with topic clusters and internal linking. A strong topical structure increases the likelihood that AI systems will consistently associate your brand with specific subjects.

2. AI Answer Inclusion Rate

AI answer inclusion rate measures how often a brand appears anywhere in an AI-generated response, even when no direct citation or link is provided. This generative engine optimization metric captures presence and relevance, not attribution alone.

What the Experts Say: Frunze explained, “If you just look at your AI citations, you’re missing the bigger picture.” She explained that metrics, like AI answer inclusion rate, help brands understand “what their competitors are doing and how they stand against them in LLM search.”

How I use the metric: I use the inclusion rate to assess whether AI models consider a brand part of the conversation. Inclusion without citation often indicates early-stage authority, which can later translate into citations as content clarity improves.

How to track: Capture all instances where the brand appears in AI responses, whether or not it’s cited, using multi-platform monitoring tools. Compare inclusion trends over time and across competitors to understand early-stage visibility and relevance.

Pro Tip: HubSpot AEO‘s Brand Visibility Dashboard tracks how often your brand appears in AI-generated answers, including instances where the brand is present but not directly cited. Track inclusion trends alongside assisted conversions in HubSpot analytics to understand how early-stage AI presence is influencing downstream pipeline activity.


3. Entity Authority Signals

Entity authority signals measure how consistently AI engines associate a brand with specific topics, attributes, and use cases. These associations are reflected in underlying knowledge graphs and reinforced through:

  • Structured data
  • Third-party mentions
  • Consistent brand positioning across the web

What the Experts Say: “With AI SEO, links don’t matter as long as your brand is actually mentioned on communities, third-party websites, and directories,” Frunze said. “Getting your brand spoken about and getting it right is very important.”

How I use the metric: I treat entity authority as an off-site credibility layer. When I conduct AI visibility audits, I note where a brand is mentioned, whether the information is accurate, and whether AI-generated descriptions align with how the company positions itself.

This means I spend significant time measuring social KPIs and monitoring how users discuss a brand. One-off mentions on platforms like Reddit and Quora can appear in AI-generated answers, but it is important to understand where those comments come from and how they impact a brand’s perception.

How to track: Audit structured data, third-party mentions, and consistent brand positioning across web sources using social listening and entity-tracking tools. Measure how often AI associates the brand with specific topics, attributes, and use cases.

Pro tip: Use HubSpot’s Social Inbox to monitor brand mentions, conversations, and sentiment across social platforms in one place — and pair it with HubSpot AEO‘s Sentiment Analysis to see how those external signals are influencing how AI engines actually describe your brand. Keeping a close eye on where and how a brand is talked about helps reinforce consistent entity signals across the web.

4. AI Referral Traffic

AI referral traffic tracks sessions originating from AI platforms and passes referral data into analytics and CRM systems. While under-reported, this metric provides directional insight into how AI visibility translates into site engagement.

What the Experts Say: Frunze told me, “AI traffic is the easiest to track because it feels familiar, but there’s a lot of uncertainty because not all elements pass the proper parameters. You’re not always getting the full picture.”

How I use the metric: Direct referral traffic from AI platforms is relatively easy to spot when it’s clearly labeled as coming from tools like ChatGPT or Perplexity. In practice, though, not all AI-driven sessions provide clean referral data.

Because of that, I treat AI referral traffic as a supporting signal rather than a success metric in its own right. I look at it alongside assisted conversions and branded search lift to understand its true influence, rather than expecting clean last-click attribution.

How to track: Use CRM and analytics platforms (e.g., HubSpot, GA4) to identify sessions coming from AI tools like ChatGPT or Perplexity. Because not all AI traffic passes proper referral data, treat this as a directional metric alongside assisted conversions and branded search lift.

Pro tip: Create custom source groupings in HubSpot reporting to isolate known AI referrers and evaluate their influence across the full funnel. Pair this with HubSpot AEO’s Prompt Tracking to understand which prompts are driving citations. This gives teams a leading indicator of where AI referral traffic is likely to come from before it shows up in analytics.

5. AI Share of Voice (AI SoV)

AI Share of Voice measures how often a brand appears relative to competitors across a defined set of prompts. Marketing teams typically track this in two ways:

  • Entity-based share of voice. Measures whether a brand appears at all in an AI-generated answer.
  • Citation-based share of voice. Tracks how often a brand is explicitly cited or referenced.

Together, these views show which brands’ AI engines trust and rely on to generate an answer.

What the Experts Say: “AI share of voice shows how many times you come up versus your competitors for the prompts,” Frunze explained. “It helps put things in perspective.”

How I use the metric: This is the first GEO KPI I look at when diagnosing AI visibility. If competitors dominate AI responses to high-intent prompts, it usually indicates that the brand I’m working with has positioning or authority gaps.

How to track: Compare a brand’s presence versus competitors across a defined set of AI prompts using tools like XFunnel or Superlines. Track both entity-based and citation-based appearances to understand relative AI trust and authority.

Pro tip: Use XFunnel to measure AI visibility and share of voice across LLMs. Pair this data with KPI dashboards to contextualize AI exposure alongside pipeline and revenue metrics.

6. AI-Driven Leads

AI-driven leads measure conversions influenced by AI discovery, particularly for bottom-of-funnel queries such as competitor comparisons, alternatives, and integrations. This metric is most valuable for understanding how AI visibility appears in the pipeline, as these interactions typically come from buyers who are close to making a purchase decision.

What the Experts Say: Frunze mentioned, “The content that drives AI leads the most is bottom-of-funnel content. These prompts usually come from people already evaluating options and are past the awareness stage.”

How I use the metric: I use AI-driven leads to understand whether GEO work is contributing to revenue, not just visibility. I review form fills and deal creation alongside high-intent pages like comparisons, alternatives, and integrations.

Within those forms, I look for explicit references to ChatGPT, Perplexity, or Gemini. Sometimes, I ask customers where they first heard about the brand.

How to track: Connect AI referral data with lead tracking in the CRM to quantify conversions originating from AI interactions. Use UTM parameters or platform-specific identifiers to measure downstream impact on pipeline and revenue.

Pro tip: Track AI-influenced form fills and deal creation inside HubSpot CRM to understand how generative search contributes to the pipeline, even when attribution isn’t linear. Use HubSpot AEO’s Recommendations feature to prioritize which visibility gaps to close first. Each recommendation includes a full content brief tied to the bottom-of-funnel prompts most likely to drive AI-referred leads.

Quick Overview: SEO KPIs vs GEO KPIs

Best Tools to Monitor GEO KPIs Across AI Platforms

1. HubSpot AEO

geo kpis, hubspot aeo recommendations

HubSpot AEO tracks and improves how a brand appears across major answer engines, including ChatGPT, Perplexity, and Gemini. HubSpot AEO directly measures core GEO KPIs, from citation frequency and AI share of voice to prompt-level prominence and sentiment.

Unlike tools that focus on a single metric or require stitching together data from multiple sources, HubSpot AEO centralizes GEO measurement in a single dashboard. This makes it possible to track performance consistently over time and connect visibility shifts directly to content and strategy changes.

Key Features:

  • Brand visibility dashboard. Tracks answer inclusion rate across answer engines, showing how often the brand appears in AI-generated answers for priority prompts and how that score shifts over time
  • Competitor analysis. Powers AI share of voice measurement, showing relative presence versus competitors across the same prompt set, so teams can identify where they’re gaining or losing ground
  • Prompt tracking and suggestions. Monitors answer prominence and positioning at the prompt level, including which prompts cite the brand, which cite competitors instead, and where the brand is completely absent.
  • Citation analysis. Surfaces which domains, content types, and source channels AI engines are pulling from when answering prompts in the category
  • Sentiment analysis. Measures how positively or negatively the brand is described in AI-generated responses on a scale from -100% to +100%, giving teams an early signal of entity authority issues alongside visibility gaps
  • Recommendations. Turns visibility and citation data into a prioritized action plan, with full content briefs for each recommendation so teams know exactly what to create or change to move the needle on GEO KPIs

Best for:

  • Marketing teams that need a single dashboard to track GEO KPIs consistently over time
  • Brands that want to connect AI visibility to pipeline and revenue outcomes without managing multiple tools
  • Teams reporting AI performance to leadership who need clear, comparable data across answer engines

Pricing: Available in Marketing Hub Pro and Enterprise, or as a dedicated tool for $50/month without a HubSpot subscription.

What I like: Most GEO KPI tracking requires a combination of manual testing, spreadsheet tracking, and disconnected tools. HubSpot AEO brings the core metrics into one place so teams can monitor performance consistently rather than episodically. The centralized dashboard makes it significantly easier to show directional movement over time and connect AI visibility to pipeline outcomes.

2. XFunnel

best tools to measure generative engine optimization kpis: xfunnel

XFunnel measures how brands appear in AI-generated responses from large language models by analyzing AI share of voice, citations, and entity mentions. Instead of relying on traffic as a proxy, this shows how AI engines actually surface and describe brands in response to real user prompts. XFunnel helps teams answer questions traditional analytics can’t, like:

  • Which brands are being named most often for high-intent prompts?
  • Are we included at all, or consistently excluded?
  • When we do appear, are we cited, summarized, or just listed?

Most GEO KPIs require direct observation of AI responses. Xfunnel does that at scale. It gives marketing teams a way to move beyond anecdotal testing and understand competitive positioning inside AI search in a repeatable, measurable way.

Best for:

  • Marketing teams tracking AI share of voice and competitive visibility.
  • Brands operating in crowded categories where being “on the list” matters.
  • Leaders who need to explain AI performance without relying on traffic alone.

Pricing: Pricing varies based on usage, prompt volume, and reporting depth.

What I like: XFunnel focuses on answer-level visibility, not just referral traffic. That aligns with how generative search works today: influence often occurs without a click.

I also like that it separates entity-based visibility from citation-based visibility, which maps directly to the GEO KPIs teams need to report on.

Seeing how often competitors appear — and in what context — makes it easier to prioritize content updates and address authority gaps.

3. HubSpot’s AEO Grader

best tools to measure generative engine optimization kpis: hubspot aeo grader

HubSpot’s AEO Grader is a free tool that evaluates how well a site is structured for AI and answer engines. It focuses on foundational elements — such as schema implementation, page structure, and content clarity — that influence how AI systems interpret and surface information.

The AEO Grader helps surface structural gaps that directly affect GEO KPIs. For teams just getting started, it provides a fast way to identify technical and structural blockers before investing in deeper optimization work.

Best for:

  • Teams auditing AI readiness without committing to new tooling.
  • Marketers validating whether schema and structure are implemented correctly.
  • Organizations that want to identify technical and structural blockers before investing in deeper AEO optimization work.

4. HubSpot’s SEO Marketing Software

best tools to measure geo kpis: hubspot seo tools

HubSpot’s SEO Marketing Software helps teams plan and measure content performance through topic clustering, on-page recommendations, and integrated performance reporting.

While built for traditional search, the same signals matter for AI engines. Topic clusters reinforce entity authority by clarifying what a brand is about and which pages should be treated as primary sources, while on-page recommendations support clear structure and semantic alignment.

Best for:

  • Teams that want SEO and GEO measurement in one platform.
  • Marketing leaders who need to tie content performance to the pipeline and revenue.
  • Organizations standardizing content structure and topical authority across teams.

What I like: I like that HubSpot’s SEO Marketing Software doesn’t live in a vacuum. Instead of pulling SEO data from one tool, AI visibility from another, and revenue data from a third, HubSpot allows teams to connect content performance to pipeline outcomes in a single system.

I also find topic clustering especially useful for GEO because it forces teams to be explicit about core themes, which is what AI engines reward when deciding which sources to trust.

5. HubSpot’s Content Hub

best tools to measure geo kpis: hubspot content hub

HubSpot’s Content Hub is a CMS designed to help teams create, manage, and optimize content with built-in SEO guidance and support for structured, schema-ready publishing. It allows marketers to standardize how content is written, organized, and maintained across the site.

For GEO, structure matters as much as substance, because AI engines rely on clearly organized content to understand what a page is about and when it should be reused in an answer.

Content Hub supports this by encouraging clean page structure. Teams can implement the schema and structured data that help AI engines interpret key information more accurately.

What I like: Content Hub makes it easier to operationalize effective content writing habits at scale. Instead of relying on individual writers to remember schema rules or formatting best practices, the CMS itself nudges teams toward consistency.

Best for:

  • Teams publishing content for both humans and AI systems.
  • Organizations standardizing content structure across multiple contributors.
  • Marketers who want schema-ready content without custom development work.

6. Addlly AI

best tools to measure generative engine optimization kpis: addlly ai

Source

Addlly AI is a platform that combines GEO auditing with AI-driven optimization to show how brands appear in AI-generated responses across multiple large language models. It tracks citations, mentions, and AI share of voice, giving teams a clear view of where their content is being surfaced or ignored by generative engines.

Addlly AI GEO Agent goes beyond reporting by helping teams take action: It identifies visibility gaps, generates AI-optimized content, and structures information in a way that increases the likelihood of being cited by AI. Teams can see not just whether they appear, but how they appear — summarized, cited, or listed — across different AI platforms.

Best for:

  • Marketing teams that want end-to-end AI visibility tracking and optimization.
  • Brands operating in competitive categories where being cited or summarized matters.
  • Teams that want to move beyond traffic-based metrics to understand real AI-driven influence.

Pricing: Flexible, based on audit depth, prompt volume, and AI content generation usage.

What I like: Addlly integrates diagnostics and execution, so teams don’t just get a snapshot of visibility — they get the tools to improve it. It also separates entity mentions from citations, which aligns perfectly with the GEO KPIs teams need to measure. Seeing where competitors appear and in what context makes prioritizing content updates much more strategic.

7. Superlines

best tools to measure geo kpis: superlines

Superlines is an AI search intelligence platform that measures how brands appear in generative AI responses across platforms like ChatGPT, Perplexity, Gemini, Claude, and more. It focuses on answer-level visibility, tracking brand mentions, citations, sentiment, and competitive share of voice in real user-facing AI outputs.

Rather than relying on search traffic or generic rankings, Superlines gives teams direct observation of AI responses, showing exactly where and how a brand is included or excluded. This makes it possible to benchmark against competitors, identify content authority gaps, and prioritize updates strategically.

Best for:

  • Marketing teams tracking AI share of voice and multi-platform visibility.
  • Brands in highly competitive categories where answer-level inclusion matters.
  • Teams that need a measurable way to show AI influence without relying on clicks.

Pricing: Based on platform coverage, reporting frequency, and team scale.

What I like: Superlines emphasizes real, user-facing AI visibility instead of indirect metrics. It captures multi-platform AI outputs at scale, giving teams repeatable insights for competitive positioning. Its combination of citation and context tracking maps directly to GEO KPIs that matter for reporting.

Common GEO Measurement Challenges and How to Solve Them

As teams adopt generative engine optimization, they often run into measurement challenges that don’t exist in traditional SEO. Many of these issues stem from how AI platforms surface answers, limit attribution, and distribute influence across channels.

Below are the most common GEO measurement challenges, followed by practical ways to address them based on real-world experience.

1. Limited AI Referral Data

The challenge: Many AI platforms suppress or delay referral data, making it difficult to attribute website sessions or conversions to a specific AI source within analytics and CRM systems.

My experience: In analytics dashboards, I’ve repeatedly seen what appear to be “ghost” referrals — sessions that lead to sign-ups, form fills, or deals, but aren’t tied to a clear referring engine. The engagement is real, but the source attribution is incomplete.

How to solve it: The goal is to understand influence, not just clicks. Instead of relying solely on referral data, look for additional signals. That includes:

  • Reviewing form responses for mentions of ChatGPT, Perplexity, or Gemini.
  • Asking prospects directly how they first heard about the brand.
  • Monitoring citations or mentions in places that don’t surface cleanly in analytics.

2. KPI Overload

The challenge: GEO introduces a wide range of potential metrics, and tracking too many at once can create KPI reporting noise that obscures meaningful insights.

My experience: I’ve seen teams struggle when they try to monitor every possible GEO KPI simultaneously. Reporting becomes harder to explain, and optimization efforts lose focus.

How to solve it: I recommend choosing one or two KPIs that the team can actively influence in the near term. The remaining metrics can stay on the back burner. I’ve found that building a deep understanding of a small set of signals creates far more progress than shallow tracking across dozens of indicators.

3. Tool Fragmentation

The challenge: GEO data is often spread across SEO platforms, AI visibility tools, analytics software, and CRM systems, making it difficult to form a cohesive view of performance.

My experience: I’ve seen teams invest in GEO tools that don’t deliver actionable insights. Not every platform that claims to measure AI visibility is worth the investment.

How to solve it: The most effective approach is to combine answer-level visibility tools with centralized reporting. Xfunnel is useful here because it focuses on how brands appear inside AI-generated answers, rather than relying on traffic proxies. Pairing that insight with HubSpot reporting reduces fragmentation and increases confidence in the data.

4. Executive Skepticism

The challenge: Leadership teams may question GEO metrics because they lack familiar benchmarks and long-established reporting standards.

My experience: As a fractional content strategist working with C-suite leaders, I’ve encountered skepticism around whether GEO is worth the effort. Some leaders lean heavily on the idea that “good SEO is good GEO,” and many leaders are hesitant to adjust existing processes.

How to solve it: Competitive framing helps. Tracking AI share of voice for a short period and comparing it against competitors quickly shows where influence is being gained or lost inside AI-generated answers. Once leaders see that gap, the value of GEO metrics becomes much easier to justify.

5. Measuring Influence Without Clicks

The challenge: AI-generated answers don’t always result in immediate website visits, making traditional traffic-based performance indicators incomplete.

My experience: I’ve seen GEO improvements show up well before any noticeable lift in sessions or before traditional ranking catches up. If teams rely only on clicks, they risk missing early indicators of impact.

How to solve it: Look beyond last-click attribution and monitor branded search lift, assisted conversions, and downstream deal creation over time. GEO influence often appears later in the funnel, not always at the moment of discovery.

Frequently Asked Questions About GEO KPIs

How often should you report GEO KPIs to executives?

Monthly reporting works best for GEO KPIs because it allows teams to identify directional trends without overreacting to short-term volatility in AI-generated answers. AI visibility can fluctuate week to week as models refresh, prompts shift, or competitors publish new content, so a monthly cadence helps smooth out noise and surface meaningful movement.

Quarterly reviews are where GEO KPIs should be tied back to pipeline, revenue, and competitive positioning. Framing GEO performance alongside existing business reviews helps normalize it within the growth conversation rather than treating it as a standalone experiment.

What is the simplest way to tag AI-referral traffic in analytics and CRM?

The simplest approach is to start with custom source groupings inside HubSpot that capture known AI referrers such as ChatGPT, Perplexity, and Gemini. While not all AI platforms pass clean referral data, grouping what is visible creates a baseline signal.

From there, campaign parameters and CRM fields can help fill in gaps. For example, adding a short “How did you hear about us?” field to high-intent forms often surfaces AI discovery even when analytics does not. Over time, these signals combine to form a clearer picture of AI influence across the funnel.

How do you prioritize content updates to improve GEO KPIs?

The highest-impact updates usually start with prompt-level visibility, not page-level performance. Prioritize content tied to prompts where competitors already appear in AI-generated answers, especially for comparison, alternative, or evaluation-style queries.

From there, look for gaps, such as unclear positioning, outdated language, weak structure, or missing context that would help an AI engine understand why the brand belongs in the answer. Updating those pages with stronger differentiation and better structure tends to produce faster GEO gains than publishing entirely new content from scratch.

When should you consider new GEO KPIs versus optimizing existing ones?

New GEO KPIs should only be introduced when existing metrics no longer explain what’s happening. If current KPIs still help answer questions about visibility, competition, and revenue influence, adding more metrics usually creates confusion rather than clarity.

New KPIs should serve strategy, not expand dashboards.

Turning GEO KPIs Into a Competitive Advantage

Generative engine optimization KPIs give marketing teams visibility into a part of the buyer journey that traditional analytics can’t fully explain. By tracking citations, entity authority, prompt inclusion, and AI-driven influence, teams gain a clearer picture of how their brand performs inside modern search experiences.

From what I’ve seen, the teams that win with GEO measurement are the ones that integrate AI visibility into existing systems, rather than treating it as a side experiment. Tools such as HubSpot AEO enable that integration without adding unnecessary complexity.

As AI-powered discovery becomes the default, GEO KPIs won’t be optional. They’ll be how confident marketing leaders explain performance, defend strategy, and prove impact, even when the click never comes.

Editor’s note: This post was originally published in January 2025 and has been updated for comprehensiveness.