Over the past two years, we’ve seen a shift in the way brands promote their products or services on social media.
And, as social media popularity continues to grow — we reached over 3.7 billion social media users globally in 2021 — brands aren’t just wondering how they’ll engage huge social media audiences next year. They’re also asking, “What social media trends should I expect in this constantly changing landscape?”
To learn more about what brands can expect in 2022 and beyond, HubSpot’s Blog surveyed over 1,000 marketing professionals to learn which trends B2B and B2C businesses will leverage in 2022. Additionally, I spoke with social media experts and dug through HubSpot and Talkwalker’s 2022 Social Media Trends Report to uncover unique perspectives on the upcoming year.
Below, I’ve compiled ten expert or research-backed trends social media marketers should watch and leverage in 2022. Let’s dive in.
![Download Now: Social Media Trends in 2022 [Free Report]](https://i4lead.com/wp-content/uploads/2021/12/3dc1dfd9-2cb4-4498-8c57-19dbb5671820.png)
Trends to Watch in 2022
1. TikTok will dominate the social media space.
During the pandemic, I began hearing about one new commonality among most of my colleagues and friends: TikTok.
TikTok has seen undeniably fast growth. In fact, the term ‘TikTok’ saw a 61% increase in mentions year-over-year during the beginning of 2021, and was the first non-Facebook app to reach 3 million global downloads.
With fast growth, it’s easy to assume it’s a passing fad — but that doesn’t seem to be the case here. HubSpot’s social team believes TikTok offers unique opportunities to engage directly with consumers, and major brands such as the NBA and Dunkin’ are leveraging the app to reach new audiences.
Additionally, Ben Jeffries, CEO of Influencer.com, says that “in 2020, TikTok was the world’s most downloaded app and with more and more consumers choosing to use the creative and humorous entertainment platform, brands are waking up to the opportunity to capture a new audience and showcase their brand personality.”
Jeffries adds, “This popularity has also encouraged the more established social media platforms, including Instagram and YouTube, to experiment with new content forms that will grab the attention of the TikTok generation.”
Other social media businesses have used TikTok’s popularity as inspiration to alter their own platform’s features. For instance, Instagram employed TikTok lookalike features in its own version, called Reels, and Reddit just announced a similar short-form video feature on its own platform.
Elena Melnikova, CMO at Talkwalker, told me, “When the pandemic forced us online, social media became our lifeline — for shopping, communication, and work. Looking for entertainment, TikTok became the go-to channel. It made us smile. It made us laugh. It relieved the boredom of being stuck at home. We were eager to join the party.
Melnikova adds, “Lockdown supercharged TikTok. Having grown so quickly, brands can’t afford to ignore the platform’s potential. With an audience dominated by Millennials and Gen Z — tech-savvy generations, demanding innovation, creativity, personalization, and transparency — TikTok will help connect brands to a younger, more creative demographic.”
In 2022, we’ll continue to see the rise of TikTok as more brands explore how they can leverage the app’s popularity to expand brand awareness and reach new audiences. Additionally, we’ll watch TikTok’s ripple effect on the social media landscape at-large, as other platforms alter their features to expand emphasis on short-form, “snackable” content.
2. Reaching new audiences will become the number one social media goal for businesses.
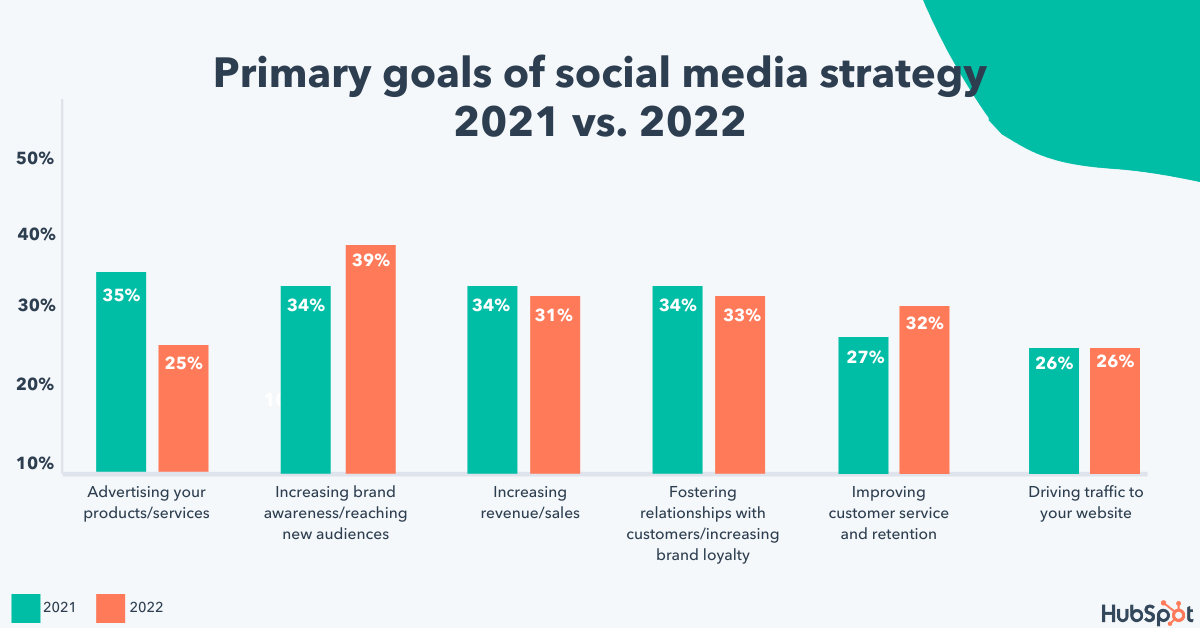
In 2021, HubSpot’s Blog Research found the primary goals of most marketers’ social media strategies were:
- Advertising products/services (35%)
- Increasing brand awareness/reaching new audiences (34%)
- Increasing revenue/sales (34%)
*(Select up to three.)
However, 76% of marketers say their goals will change in 2022.
As we enter 2022, most marketers primary goals include:
- Increasing brand awareness/reaching new audiences (39%)
- Fostering relationships with customers/increasing brand loyalty (33%)
- Improving customer service and retention (32%)
During the pandemic, most consumers needed to shift to an online-first purchasing experience.
As we head into 2022, then, it makes sense that brands are contemplating how they can reach new audiences through social media, foster deeper relationships with existing audiences, and improve customer service to ensure long-term customer loyalty.
To increase your social media presence, it’s critical you stay active and consistent in your posting, leverage trends and buzzy content, and invest in high-quality creative assets.
Additionally, to foster deeper relationships with your existing audiences, you’ll want to engage with your followers through interactive elements such as polls, Q&As, and live videos.
3. Companies will make more dedicated social media hires.
Social media is an undeniably powerful strategy for your business.
And social media isn’t just for brand awareness, either. It’s also an effective tool for generating revenue. In fact, 79% of people say that user-generated content on social media significantly impacts their purchasing decisions.
Which is why you’ll see more companies making dedicated social media hires in 2022, rather than tasking a busy marketing team with social media as a side project.
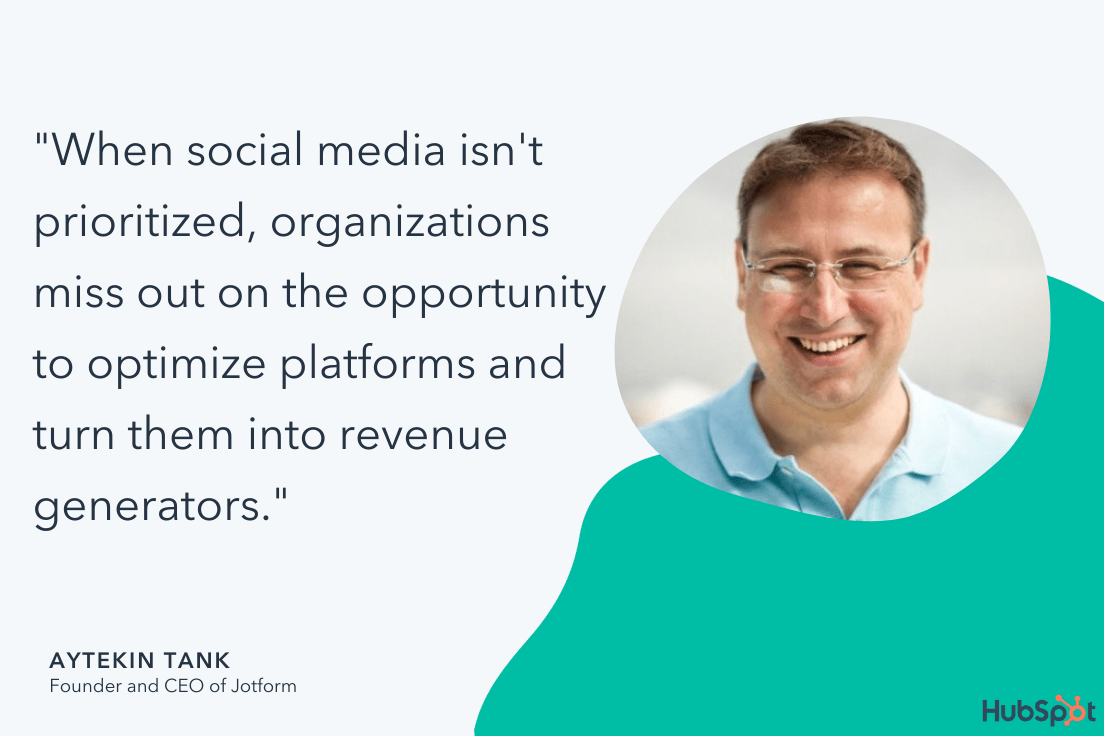
As Founder and CEO of Jotform, Aytekin Tank, told me, “One big trend for social media marketing in 2022 is to make a dedicated hire. Companies frequently manage social media by committee or pass it off to a marketing generalist. But the problem is when social media isn’t prioritized, organizations miss out on the opportunity to optimize platforms and turn them into revenue generators.”
“A dedicated social media hire can solve this problem and help organizations grow platforms, keep tabs on social analytics, be part of industry-specific conversations, experiment with new platforms and trends, and more — all of which contributes to a stronger brand and more leads for your company. We’ve done it at Jotform, and it’s worth it.”
If you haven’t already, consider hiring a social media community manager to build and engage with your online audiences. These managers are the tone, voice, and conversations behind your brand — so it’s worth it if your audience is eager to engage with your brand through social media.
4. Augmented Reality will become consumers’ preferred way to try-on products and interact with brands.
Augmented Reality (AR) has been around for a few years now, and it’s becoming increasingly common for brands to use AR to enable consumers’ to test products before purchase.
AR has proven effective for a business’ bottom line, as well. In fact, AR can improve click-through rates to purchase by upwards of 33%.
Carolina Arguelles Navas, Snap Inc.’s Head of AR Product Strategy and Product Marketing, told me she believes augmented reality (AR) will become consumers’ preferred option when trying on products in 2022.
As Navas puts it, “For brands, AR is the most personal way to reach people and is more effective at driving results compared to other forms of advertising and marketing.”
Navas says, “We’ve seen interest and engagement with AR explode over the last two years, and have over 200 million Snapchatters engaging with augmented reality every day. The trend is here to stay, and it’s only going to continue growing.”
If you think AR could be a good fit for your brand, Snapchat is an effective platform to test it — the social platform reaches over 90% of 13-24 year olds, and over 75% of 13-34 year olds in the U.S., including nearly one of every two smartphone users, so it’s a good opportunity to get your products in front of a large audience.
5. Businesses in the B2B space will increase their investments in Instagram and Twitter.
Instagram and Twitter aren’t new to the social scene, but many marketers are still seeing increases in ROI across both.
For instance, Twitter reached almost 200 million monetizable daily active users in Q3 of 2020, up 29% YoY.
Instagram, on the other hand, experienced a nearly 14% jump between 2019 and 2020 in its users’ time spent on the app, to an average of 30 minutes per day. This was higher engagement growth than all other social platforms.

As Twitter and Instagram continue to succeed, we’ll see more marketers invest in both platforms in 2022. HubSpot’s Blog found 70% of marketing professionals plan to invest more heavily in Twitter in 2022, and 63% plan to invest more heavily in Instagram.
In 2022, consider where you might increase your own investments to find more ROI from the platform(s) that are already serving your audiences.
6. Influencer marketing will mature in 2022.
The pandemic undoubtedly sped up the rise of “unfiltered” (or less scripted) content, as well as “everyday influencers” — such as micro-influencers and nano-influencers.
Many people trusted influencers more than brands during the pandemic. Which is why influencer marketing is a strong avenue to explore in 2022.
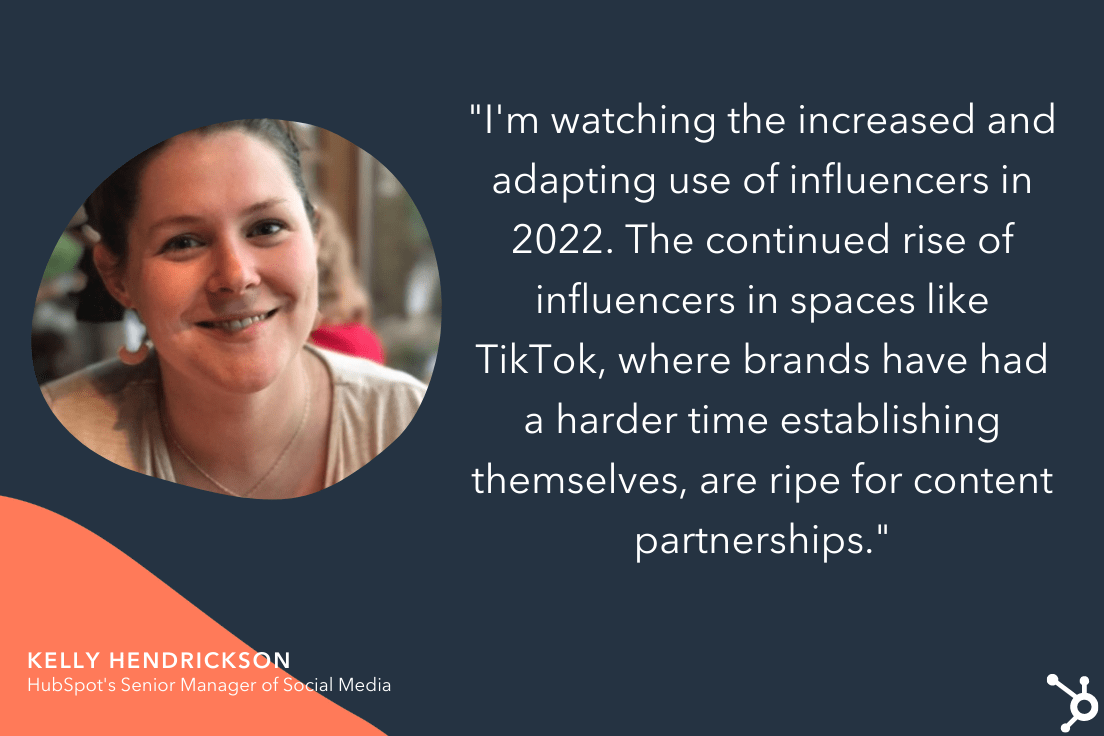
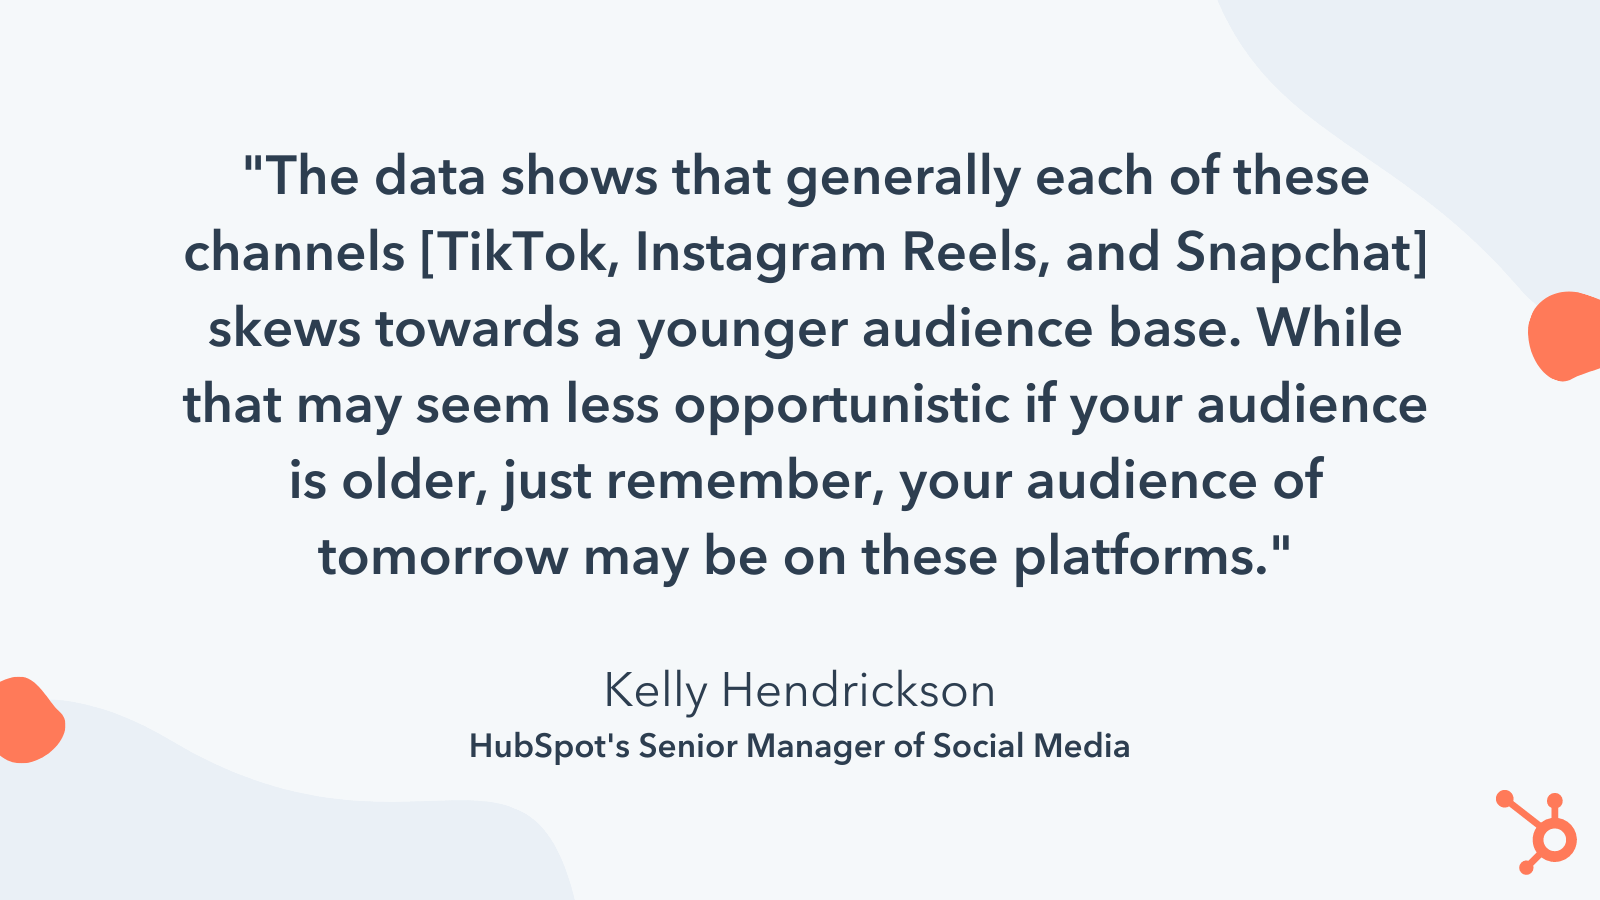
When asked which trend she’s watching in 2022, HubSpot’s Senior Manager of Social Media Kelly Hendrickson told me, “I’m watching the increased and adapting use of influencers in 2022. The continued rise of influencers in spaces like TikTok, where brands have had a harder time establishing themselves, are ripe for content partnerships.”
As alignment between social media and e-commerce strengthens, we’ll see more influencer partnerships used to increase businesses’ sales.
However, it will be important in 2022 to align with the influencers that make the most sense for your brand. This will include influencers with potentially smaller but more engaged audiences, as well as influencers who specialize in more niche topics that make the most sense for your brand.
Gaurav Sharma, founder and CEO of Attrock, adds, “To see great results, you can run an impact-oriented influencer marketing campaign with 10-30 micro-influencers for at least 6-12 months. If you get it right, you could skyrocket your business growth quickly.”
“[And] to get a higher ROI on social media marketing, I would suggest marketers leverage influencer marketing platforms to collaborate with the micro-influencers.”
7. Social advertising will become more sophisticated.
As Google plans to phase out cookie tracking by 2023, you’ll begin to see “the death of the third party cookie” happen in the upcoming year — which means many marketers will need to pivot their existing strategies as social advertising evolves.
Fortunately, there are plenty of highly effective advertising options that don’t require third-party cookies. To name a few: User-generated content, targeted and personalized ads across social media platforms, email marketing, and search engine retargeting campaigns.
Rather than using third-party cookies to define your advertising playbook, this is a good opportunity to develop a data-driven strategy using metrics to understand your users’ interests and preferences on a deeper and more personal level.
8. Businesses will invest in more long-form and short-form content, as well as live audio chat rooms.
It’s no surprise that video is an increasingly popular format across social channels, particularly with the rise of video-focused platforms like TikTok.
The HubSpot Blog found 64% of marketers plan to leverage more short-form videos in 2022. Snackable content has been proven effective, so these short-form videos will likely be brief, engaging, digestible pieces of content that span across social channels.
Additionally, 89% of marketers who leverage long-form videos plan to increase their investment or continue investing the same amount in 2022, according to HubSpot Blog Research.
All of which is to say: If you haven’t already invested in short or long-form video, try testing both as we enter the new year to determine which option your audience prefers.
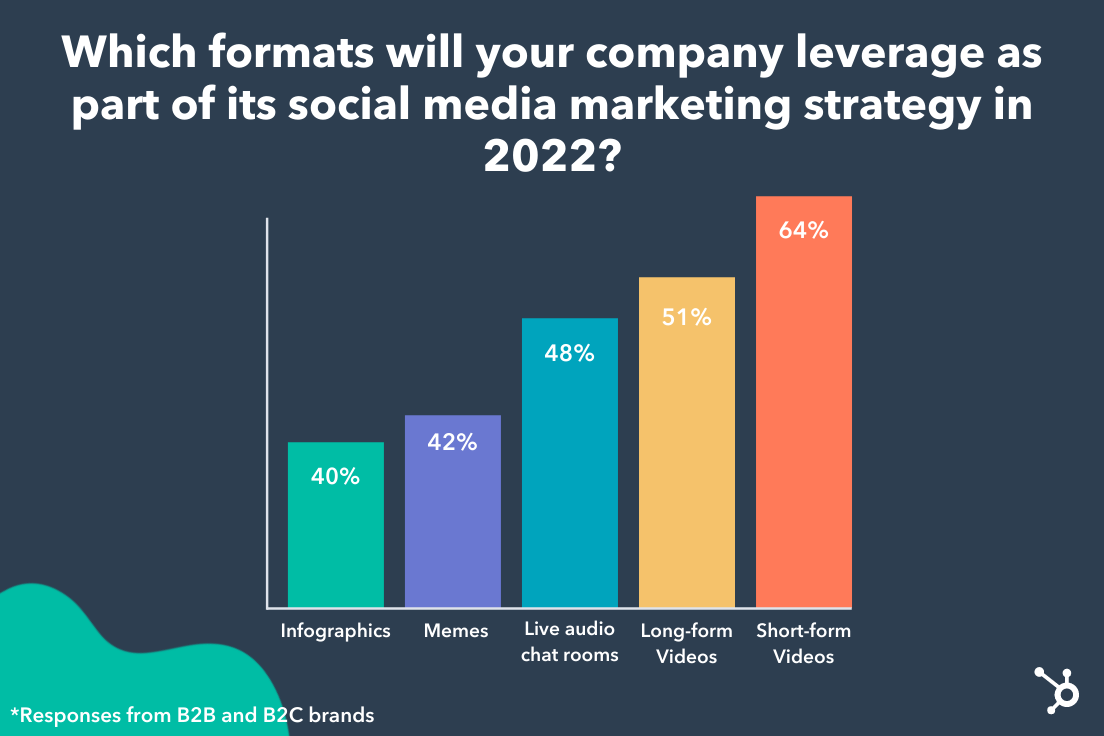
Additionally, roughly half of marketers plan to invest more in live audio chat rooms such as Clubhouse or Twitter Spaces in 2022.
Consider how you might leverage alternative forms of content in 2022. Beyond visual elements like videos and posts, test out audio content to see if there’s an interest from your buyer persona.
9. Social selling demands will grow.
Over the past few years, social platforms have worked hard to create native shopping experiences so users can purchase products without ever leaving their sites.
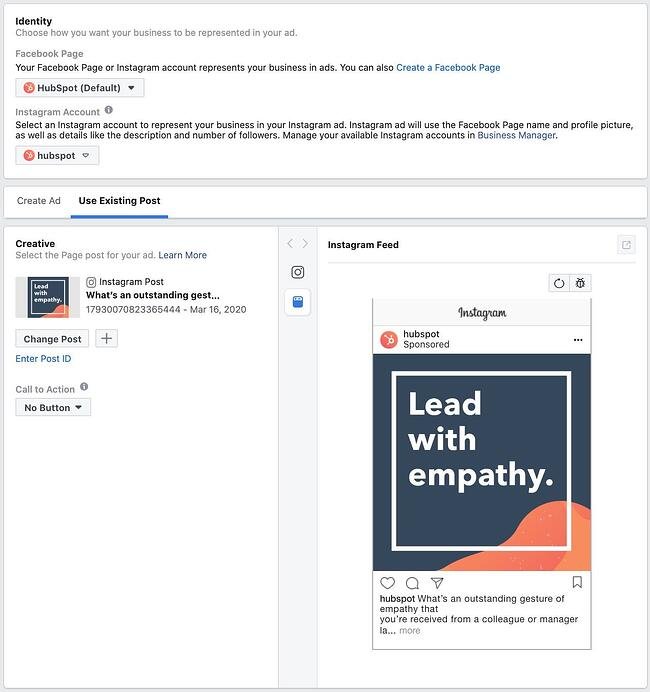
Consider, for instance, Instagram’s Shoppable Stories, where you can tap on a product sticker to purchase without leaving the app.
Other platforms have invested in native advertising to ensure a more seamless experience for users. TikTok, for instance, created an advertising format called Spark Ads, which allows brands to boost the profile of existing organic content.
As we enter 2022, we’ll see more brands leverage social selling to reach users whenever — and wherever — they’re ready to buy. If your users prefer purchasing your products from Instagram, why not let them?
10. Consumers will crave snackable content.
In 2020, we saw the rise of TikTok and Instagram Reels, continued engagement on Stories content from Facebook, Instagram, and Snapchat, and brands creating other short-form or “snackable” pieces of content to educate consumers about their brand.
As social media attention spans continue to shrink and more people scroll endlessly through feeds while bored at home, don’t expect snackable content to lose steam anytime soon.
To learn more about four types of snackable content your brand should leverage next year, check out this helpful post.
Which Trends are Losing Steam?
Now that we’ve covered a few trends that will take off in 2022, let’s explore a few trends that seem to be losing steam.
1. Ephemeral Content
HubSpot Blog Research found that 67% of B2B and 41% of B2C marketers say they’ll stop using ephemeral content (i.e. disappearing content, such as Instagram Stories) in 2022.
It’s difficult to create high-quality, engaging content, so some marketers might find it’s not worth the effort to create content that will disappear in 24 hours. If you find your ROI isn’t high enough for ephemeral content, consider testing out longer-term types of content, like videos or posts.
2. Interviews and Expert Discussions
Finally, HubSpot Blog Research found 48% of B2B and 56% of B2C marketers say they’ll stop conducting interviews, podcasts, or expert discussions.
Interviews, podcasts, and expert discussions can be incredibly effective for increasing brand awareness or reaching new audiences — but it’s also time-consuming, and it can be difficult to track metrics related to sales.
Some marketers may have decided that the cost for production wasn’t worth it for their businesses, particularly if their specific audience isn’t interested in listening to long-form audio content.
Starting a podcast makes a lot of sense for some brands, but others might find better ROI with other marketing strategies, such as video or email marketing. Ultimately, you’ll want to do what’s best for your audience.
How to Capitalize on 2022 Social Media Marketing Trends
Now that we’ve covered some of the most popular social media trends you’ll see in 2022, let’s recap steps you can take to leverage these trends to boost your own social activity.
Here are a few steps your social team can take to leverage these trends, attract new audiences, and build a larger following:
- Leverage video whenever possible. People love video right now, especially live video content, which feels especially authentic. Test out live video channels like IGTV or Facebook Live to see how they perform.
- Create relatable content. Don’t be afraid to show a different side to your brand. Highlight customer stories; talk about your company’s larger mission or purpose; give us a ‘day in the life’ of one of your employees. Go beyond your product or service to create a deeper connection with your audience.
- Use a conversational tone. Create social media captions like you’re speaking to a friend. Of course, you’ll want to stick to your brand’s voice, but play around with how you might converse with your audience through social channels. Consider asking your followers questions or telling stories to increase engagement levels.
- Use design elements for snackable content. Test out memes, gifs, short videos, quick quizzes, fun infographics, etc. to figure out how you might attract, and hold, an audience’s attention even when they’re scrolling quickly through their feeds.
- Quality over quantity. No need to post once a day. Audiences appreciate quality over quantity — consider how you might set up a schedule so you’re regularly posting content but not overposting. Use analytics to determine the right cadence for your own brand.
Finally, consider exploring new or unexpected social platforms to reach new audiences.
As HubSpot’s Senior Manager of Brand Social Kelly Hendrickson told me, “I expect we’ll see brands further exploring channels outside of the pay-to-play kingpins: Facebook and Instagram. With ongoing public scrutiny, a lengthy outage, and increased concern around data privacy when it comes to Facebook, brands may turn to channels that their audience trusts — channels like Reddit, Pinterest, and Discord.”
Navigating Social Media in 2022
Today, the world around us is constantly changing. And, although we think we know what to expect with social media, this list of trends is likely not exhaustive of what we’ll see in 2022.
As a social media marketer, the best thing you can do is to continue to research trends, online consumer behaviors, and your team’s social media data to determine which trends or strategies to lean into or how to navigate unprecedented online scenarios.
One great place to start doing this research could be our HubSpot and Talkwalker’s recent Social Media Trends Report.
Along with insights and quotes from social media experts, our Social Media Trends Report walks through all the major 2022 trend predictions to know about, and how your brand can keep up. To see the free report, click here or the banner below.

![]()
![→ Download Now: How to Advertise on Instagram [Free Guide]](https://i4lead.com/wp-content/uploads/2021/12/4ecf258d-99a6-4eba-a07e-2303e54678ce.png)
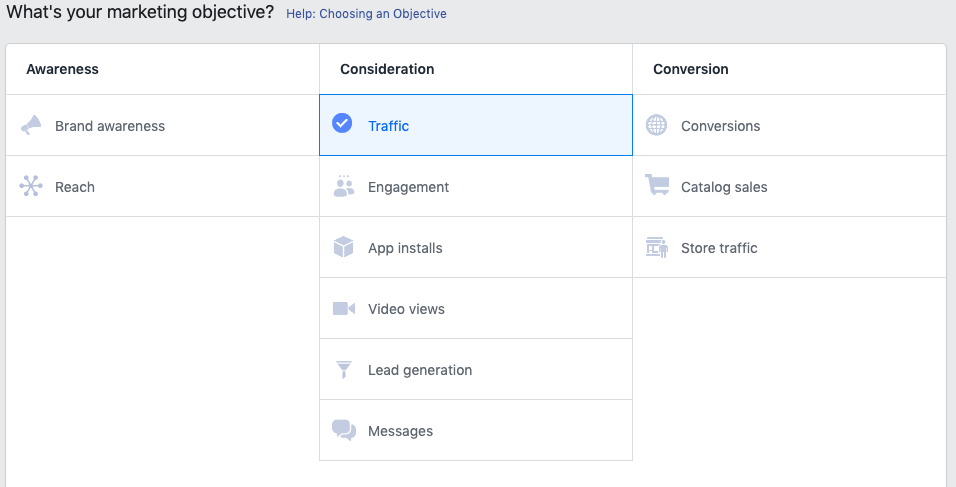 For this article, we’re going to select: “Traffic.”


![Download Now: Social Media Trends in 2022 [Free Report]](https://i4lead.com/wp-content/uploads/2021/11/3dc1dfd9-2cb4-4498-8c57-19dbb5671820-3.png)

![Download Now: State of Marketing Report [2021 Version]](https://i4lead.com/wp-content/uploads/2021/11/6baeae42-e710-4ecd-beb9-ceb2fb9f0877.png)
![→ Download Now: Free Product Marketing Kit [Free Templates]](https://i4lead.com/wp-content/uploads/2021/11/08b5e1f4-5d26-405b-b986-29c99bd0cb14.png)
![Sign up for HubSpot Academy's Ads Training Course [Free Online Course]](https://i4lead.com/wp-content/uploads/2021/11/44eb98e8-e59a-4d8a-9c15-c8e0187a878a.png)


![→ Click here to access 5 free cover letter templates [Free Download]](https://i4lead.com/wp-content/uploads/2021/11/3f347702-d7e9-4e59-9fe4-be4cd7bad191.png)

![→ Access Now: 8 Business Flowchart Templates [Free Tool]](https://i4lead.com/wp-content/uploads/2021/11/46d3b1c7-3e3b-4386-b78e-8b57f6d95750.png)


![→ Download Now: SEO Starter Pack [Free Kit]](https://i4lead.com/wp-content/uploads/2021/11/1d7211ac-7b1b-4405-b940-54b8acedb26e-3.png)
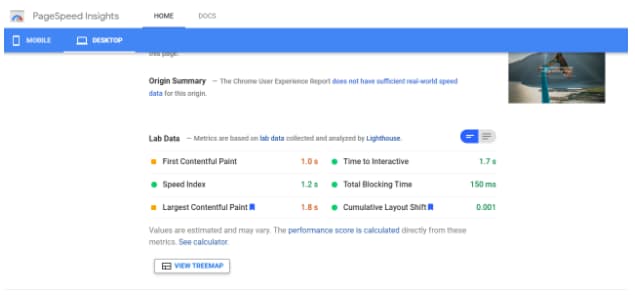 To analyze performance using Lighthouse tools:
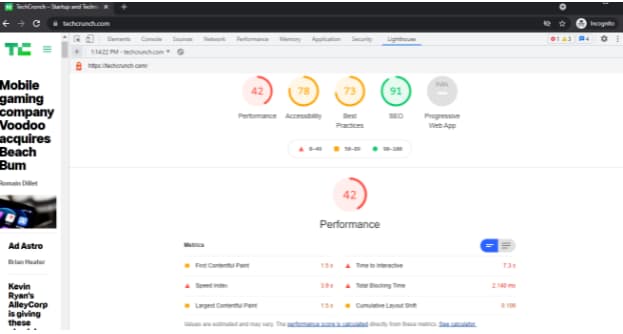 Lighthouse provides a detailed audit of what contributed to that score. To review the audit, scroll down and choose “Show audits relevant to CLS.”