Categories B2B

How to Run a Marketing Campaign on a Tight Budget [Expert Tips & Free Tools]

Many of us have been there with the cup of noodles diet when money is tight. 

Sometimes, marketing teams also run into tight budgets. But that doesn’t mean you should stop your operations. There are still clever ways to run lean marketing campaigns.

In this post, we’ll highlight budget-friendly marketing campaign tips straight from experts.

Sign Up to Try HubSpot's AI Tools

Low-Budget Marketing Campaign Tips

Media Campaigns

Be Realistic

When you have few resources, one of the worst things you can do is have unachievable expectations. You’ll have to scale them down and be realistic.

“If you’re working with a tight budget, make sure that you have clear measurable KPIs and stop yourself from thinking of ways to grow the product from a paid perspective outside of the budget you have to spend,” says Dréa Hudson, Head of New Media Growth at HubSpot.

She adds that this can be challenging if you’re an ideas-first person, but also a lesson in prioritizing time, resources, energy, and budget. 

“Get creative with your earned and owned media, pull together a clear, concise value proposition that’s easy to share, highlighting what you’re able to offer any partner that can help you reach your goals,” Hudson explains.

Focus on Targeted Advertising

When you can’t afford an ineffective campaign, it’s crucial to ensure that your advertising efforts are reaching the right audience. 

Instead of casting a wide net, focus on targeted advertising to maximize your budget. 

Use platforms like Facebook Ads or Google AdWords, which offer robust targeting options based on demographics, interests, and behavior. This way, you can ensure that your ads are shown to people who are most likely to engage with your brand.

Pitch to the Press

Getting press coverage for product releases and campaign launches is a good way to generate buzz at no cost. 

Drafting a succinct press release and keeping media contacts organized is a good start to garnering coverage.

Use Free Promotional Channels

Social media

Source

Social media marketing and email marketing are both powerful ways to reach audiences on a tight budget. 

Editorial Campaigns

Embrace Collaboration

No one should operate in a silo — it takes teamwork to run a successful campaign. 

“Identify teams you’d like to work with within your company, then brainstorm or pitch mutually beneficial collaborations that can align your work around a unified goal.” says Pam Bump, Content Growth Team Manager at HubSpot. “If your team creates text-based blog content or marketing emails, but you need videos for your campaign to work, offer the video team content promotion in your text-based content if they create media related to your campaign topic.”

She adds that cross-team collaboration is beneficial for all parties involved.

“This way, you get the content you need to drive time on page or video search, and they benefit from the views, awareness, and potential channel subscriptions that come with promotion in your content,” Bump concludes.

Leverage User-Generated Content

Encourage your customers to create and share content related to your brand. 

User-generated content not only promotes your brand but also builds trust and credibility. 

Tory Bullock, YouTube Marketing Manager at HubSpot, says, “As brands look for new ways to extend their reach in a rapidly growing digital space, UGC is becoming a more viable and cost effective marketing strategy than ever…People trust people.” 

Run contests, social media challenges, or ask for testimonials and reviews to encourage user-generated content creation. This approach isn’t only cost-effective, but also helps in building a strong community around your brand.

Brand Campaigns

Outsmart, Not Outspend

When you’re on a budget, your best bet is to outsmart the competition. 

“Look for creative efficiencies by producing assets in waves or batches. And for brand media, find ways to outsmart, not outspend, your competition with memorable, contextual ad placements to drive outsized impact,” says Callie Wilkinson, Principal Brand Marketing Manager at HubSpot.

Use Affordable Tools to Streamline or Optimize Campaign Work

HubSpot Campaign Assistant

Get started with HubSpot’s Campaign Assistant

Software comes in handy when you’re running campaigns on a tight budget. Tools like HubSpot’s Campaign Assistant can help you generate content for campaigns ranging from emails to landing pages.

HubSpot Campaign Assistant

For example, I took on the role of owner at a costume store and created a landing page for a Halloween sale. 

Campaign Assistant prompted me to summarize the campaign, list key factors people should know about, decide a call to action, and choose a writing style. In seconds, I got ready-to-use landing page copy.

If you’re looking for another tool, HubSpot’s AI Content Writer can help you generate copy in a pinch. While Campaign Assistant is designed specifically for campaigns, AI Content Writer casts a wider net. You can play around with both tools.

AI software are not the only tools at your disposal. You can also leverage HubSpot’s Branding Kit that contains free templates.

Embrace Virtual Events

In-person events are often costly. Virtual events, on the other hand, are a smart and cost-effective way to get people to interact with your brand on a personal level.

“The dirty little secret of in-person events is you’re all competing for the biggest number — but the bigger the number, the worse the experience for the attendees,” said Bob Bejan, Microsoft’s VP of Global Events in a past interview with HubSpot. 

“The power and effectiveness of virtual events is just so convincing from a data perspective that it’s hard to imagine they’re ever going away,” Bejan explained.  “Virtual events at every dimension are so much more effective than in-person events.”

Get Started With Marketing Campaigns

You don’t need to be extremely well-funded to run a successful marketing campaign. All you need is creativity, understanding of your audience, and the right tools.

Tools like HubSpot’s Campaign Assistant can help you generate content for your campaign. 

campaign-assistant

Categories B2B

How Private AI Tools Will Help You Supercharge Your Advertising Strategy, According to Experts at Mekansim

While AI is a hot topic as of late, it’s been around for a long time.

At our agency, Mekanism, we are seeing beyond the hype and exploring how AI will impact all aspects of marketing, including research, strategy, creativity, and performance. 

And one area poised for disruption? Advertising. 

Here, let’s explore how private AI tools can transform your advertising strategy.

Free Report: The State of Artificial Intelligence in 2023 

An AI Tool is Only as Powerful As the Data You Provide

Through our adoption of AI tools there’s one common trait we’ve noticed in our evaluations: There’s nothing inherently special about many of the AI tools out there. What’s special is the inputs we put into them, and the data we provide each tool.

Like many people will tell you with AI: It’s garbage in, garbage out. You want to make sure that the dataset you are using with any AI tool is the best you can provide.

This means collecting whatever first-party data you can to make your outputs from AI as productive and personalized as possible.

For instance, to receive a powerful AI-generated marketing plan, you’ll want to incorporate client expectations, first-party data around the consumers you’re trying to reach, past examples of campaigns and their performance, etc. 

Our thesis for the solution to this problem: The future of AI in advertising will be setting up bespoke internal AI tools that safeguard clients’ data, and providing personalized marketing.

The Five Elements You’ll Need to Incorporate Into Your AI Tools for Stronger Advertising

There are a few key elements that a corporate AI tool will need to be successful when it comes to advertising. Let’s jump into those, now.

1. A shared prompt library. 

A shared prompt library is a collective resource across your organization that allows for anyone to share their best prompts for completing work. By sharing this information, you help onboard your team members to better leverage AI.

Consolidating and protecting your prompt libraries also address privacy concerns. Prompt libraries help centralize the knowledge around AI, and reduce any loss of productivity when people leave the organization.

2. A document library. 

A document library inside of an internal AI tool is the personalized training that you bring to any LLM (large language models). This library is the “brain” of your organization’s AI and should include any relevant documentation that can train the AI to provide more personalized results.

The library can include a brand’s past campaigns, competitors’ campaigns, results of campaigns, data around your consumer, and results from past brainstorms.

3. Brand tone and voice guidelines.

As part of that library, there should be a Brand Tone and Voice Guideline document that clearly states what would and wouldn’t be in any communications from your brand. This document should be weighted heavier than others in training to help maintain your brand in any generated content.

4. Approval flows. 

An internal AI tool should also include an approval flow that allows any generated content from the AI to be audited and checked for things like hallucinations and biases before being used outside of the tool.

As part of this approval process, other things can be checked by AI, such as any claims being made with citation or any regulatory issues that certain brands may encounter within the used language. This approval flow is key to keeping the work human. By applying the good taste that only a human can harness, we can avoid work that feels robotic.

5. Security. 

Lastly, and most importantly, these tools should include a robust suite of security measures to make sure that all generations remain private before they receive approval to become public. This security should also keep the document library secure, and perhaps offline, to better protect any first-party data provided to the LLM.

What Personalized Results Look Like with Private AI Tools

With significant first-party data added into a private AI tool, a company could expect results that are both personalized as well as potentially predictive in performance. It’s a tall order to place on generative AI, but with enough past performance information, AI could produce responses that mimic the best practices of top performers from the past.

Asking a simple question like, “create 10 ads about going back to school” would yield results not only with more brand-appropriate responses using private AI, but also with predicted results alongside each response.

These tools could also plug directly into the API’s of e-commerce platforms, as well as social platforms, to track organic and paid content performance to optimize its generations in real time.

Private AI Tools That Continue To Learn

If our private AI tools are learning from qualitative data points such as click-throughs, likes and shares, why not qualitative, as well? That’s truly the power of LLM tools, the ability to manipulate and compute the written word just like numbers. These tools will be able to also take into account consumer sentiment via comments and reviews to create better generative outputs for brands.

One area Mekanism is currently exploring is collecting and measuring the rich conversation with TikTok comments to better understand what consumers are thinking. With the waning usefulness of social listening from platforms like Twitter, comments in videos are becoming increasingly more important.

A common workflow for our social strategy team whenever they are researching a brand or topic is to pull the comments of the top videos in that space and then run those conversations through an LLM like ChatGPT’s Code Interrupter to better understand topics of conversation. After this data is entered into ChatGPT, our strategies can then have a “conversation” with these consumers and ask them more questions based on this data to better craft their understanding of the brand or topic.

What’s Next

So many organizations are currently looking around and asking how they will use AI, and many are running into the same issues around copyright and security. Our hope is that we’ve provided a framework on how the advertising and marketing industry can move forward with adoption of these tools by investing in private AI.

If we want AI tools to meet our expectations of the future, we’ll need to provide more useful data. And, in order for everyone to feel safe doing so, developers of these tools will need to provide options for organizations to run these tools on-site, off the cloud, or with strict security options.

It’s a pretty exciting time out there for humans and AI.

New Call-to-action

Categories B2B

How to Create a Landing Page: The Ultimate Guide

As a marketer, I understand the importance of landing pages. A landing page can be the designated page visitors are taken to when they click on an ad.

It can also be the page that follows a call-to-action button or serve as the homepage of a website.

Regardless of how my audience “lands” on a landing page, it encourages them to convert to a lead or customer. Hence, landing pages are uniquely powerful components of a business’s digital marketing strategy.

What is a landing page?

A landing page is a website page with a specific purpose — the objective of a landing page is to convert visitors into leads. While there are many landing pages, the intent is the same — get more leads.

Landing pages contain lead forms that ask visitors for their contact information in exchange for something of value, otherwise known as an offer.

The video below will help drive that definition home.

Now, think about how protective you are of your personal information. What would make a person want to give up their contact information over the internet?

Well, that’s where landing page best practices come in. A targeted, well-crafted landing page with a solid format and sound copy will get almost anyone to submit their information.

Use HubSpot's AI Campaign Assistant to Generate Landing Page Copy

Why do you need a landing page?

Why would you create a unique page for people to complete a form? Why not just use your homepage or About page? Great questions.

After reading this article, you’ll likely be able to answer those questions yourself.

Still, the short answer is this: A landing page eliminates distractions by removing navigation, competing links, and alternate options so you capture your visitor’s undivided attention.

Complete attention means you can guide your visitors where you’d like them to go, i.e., to your lead form. In sum, landing pages are specifically designed to create conversions.

Now that you understand their importance, let’s cover landing page best practices to ensure your pages are set up to convert.

Was that a lot? I’ll break down these landing page best practices below.

1. Craft a benefit-focused headline.

Over the years, I’ve learned that for every 10 people visiting a landing page, at least seven will bounce off the page. To keep that number low, visitors must understand what’s in it for them within seconds of arriving.

My headline is the first thing they’ll read, and it should clearly and concisely communicate the value of my landing page and offer. The same goes for your own landing page, so craft a clear, direct, and engaging headline.

2. Choose an image that illustrates the offer.

I always include images in my landing pages. The purpose of an image is to convey a feeling — it should illustrate how visitors will feel once they receive the offer.

Specific images may work better than others, so you should always split-test your options (which we’ll cover below).

3. Write compelling copy.

An engaging headline and image can be crucial, but experience has shown me that it can fall flat without well-crafted copy. Your copy must be clear and concise and guide your visitors to the action you want them to complete.

Compelling copy also speaks directly to the visitor using “you” and “your” to engage them. We’ll go more in-depth on copy tips below.

Pro tip: Speed up the writing process by using generative AI to create a rough draft of your landing page copy and refine it to match your brand voice and tone.

With Campaign Assistant, HubSpot users can plug in their main points, features, and CTA and generate a first draft in seconds.

4. Include the lead form above the fold.

Your lead form needs to be readily accessible should your prospect want to convert immediately — you don’t want them searching and scanning your landing page to find your offer.

“Above the fold” means visitors don’t have to scroll to get to the form — it’s in view when someone hits the page.

This could be a form or an anchor link to the form. Even better: Design your layout to scroll with the user as they move down the page.

5. Add a clear and standout call-to-action.

The call-to-action (CTA) is arguably the most crucial element on your landing page — it’s one of many elements that encourage conversion. The CTA button must stand out, meaning you should use a color contrasting with other elements on the page.

Be clear about what you want visitors to do; that is, use an action verb that spells it out for them, like “submit,” “download,” or “get it now.” More on CTA best practices below.

6. Give away a relevant offer.

Think of your landing page as part of your lead’s journey to your ultimate offer — your product or service. Your offer is the thing you give in exchange for your lead’s personal information.

Not only should it be compelling enough for your visitor to provide their contact info, but it should also be relevant to your business. Say you sell horseshoes.

Your offer might be something like “10 Simple Ways to Size Your Horse’s Hooves” because, ultimately, you will ask that lead to buy your horseshoes.

You wouldn’t hook them with an offer about organic farming because that puts them on a different path.

We’ll talk more about how compelling offers are below.

7. Only ask for what you need.

You want to gather as much information as possible about your lead, but how much you ask for depends on several factors: how well-acquainted they are with you, where they are in their buyer’s journey, and how much they trust you.

Ask for as little info as you need in your lead form to create a low barrier to entry. A name and an email are more than sufficient to nurture a new lead.

8. Remove all navigation.

Your landing page has one objective and one objective only: to convert visitors into leads. Any competing links — including internal links to other pages on your website — will distract from that goal.

Remove other links on your page to draw your visitors’ attention to your call to action.

9. Make your page responsive.

Like every other page on your website, your landing pages must be responsive to accommodate every viewing experience. The last thing you need is for your form to fall out of view on mobile devices.

Give your visitors every possible opportunity to convert, no matter how they view your page.

You can use tools to help accomplish this. For example, HubSpot’s drag-and-drop landing page editor, available in Marketing Hub Starter, makes creating mobile-optimized landing pages and forms effortlessly easy.

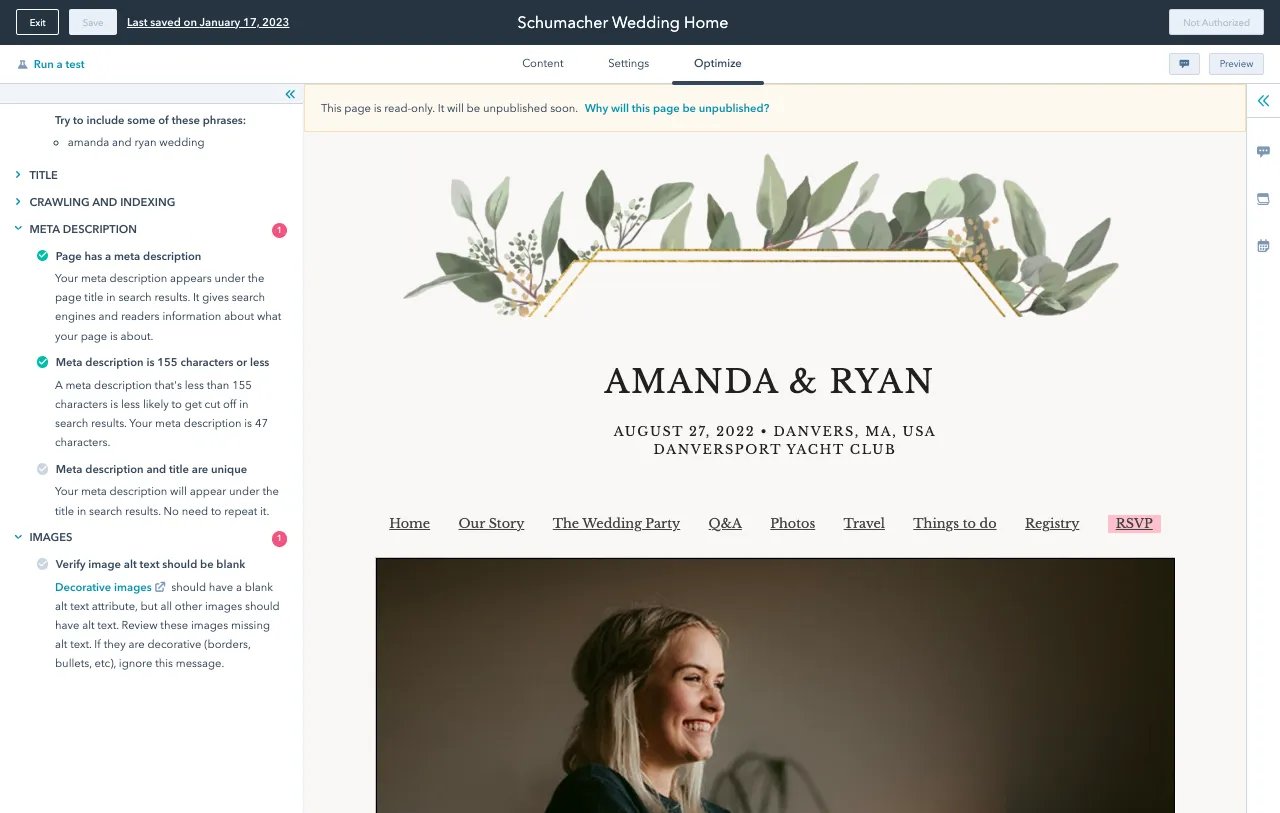
10. Optimize for search.

Sure, you’ll be driving visitors to your landing page through email blasts, social posts, and other marketing methods, but your page should also be optimized with target keywords for your paid campaigns and organic search.

When someone searches for your key phrase, they should find your landing page. Similarly, when you target a keyword with paid ads, those words should exist on your landing page.

11. Remember to use a thank you page.

A thank you page is where you send leads once they’ve completed your form. Now, you could just show a thank you message on the same page or ditch the thank you altogether, but there are many reasons why that’s not the best option.

A thank you page serves three essential purposes:

  • It delivers the offer that you promised (usually in the form of an instant download)
  • It allows you to interest your new lead in additional relevant content
  • It serves as a chance to thank them for their interest, which goes a long way in promoting them to a customer.

How to Design Your Landing Page

Often, design means creativity, colors, and pretty pictures. We take design a step further for a landing page to mean functional, direction-oriented, and practical.

So, to craft a well-designed landing page, you’ll have to tap into both your right and left brain.

But don’t get me wrong — you still need fantastic imagery and attractive colors to convert your visitors. We’ll touch on how to incorporate all of this below.

Landing Page Structure

The good news is you don’t need to get too creative here. I’ve found that most landing pages follow a very similar structure because it’s been proven to work.

You can infuse your creativity through branded elements and images, but stick to a landing page format people are used to seeing.

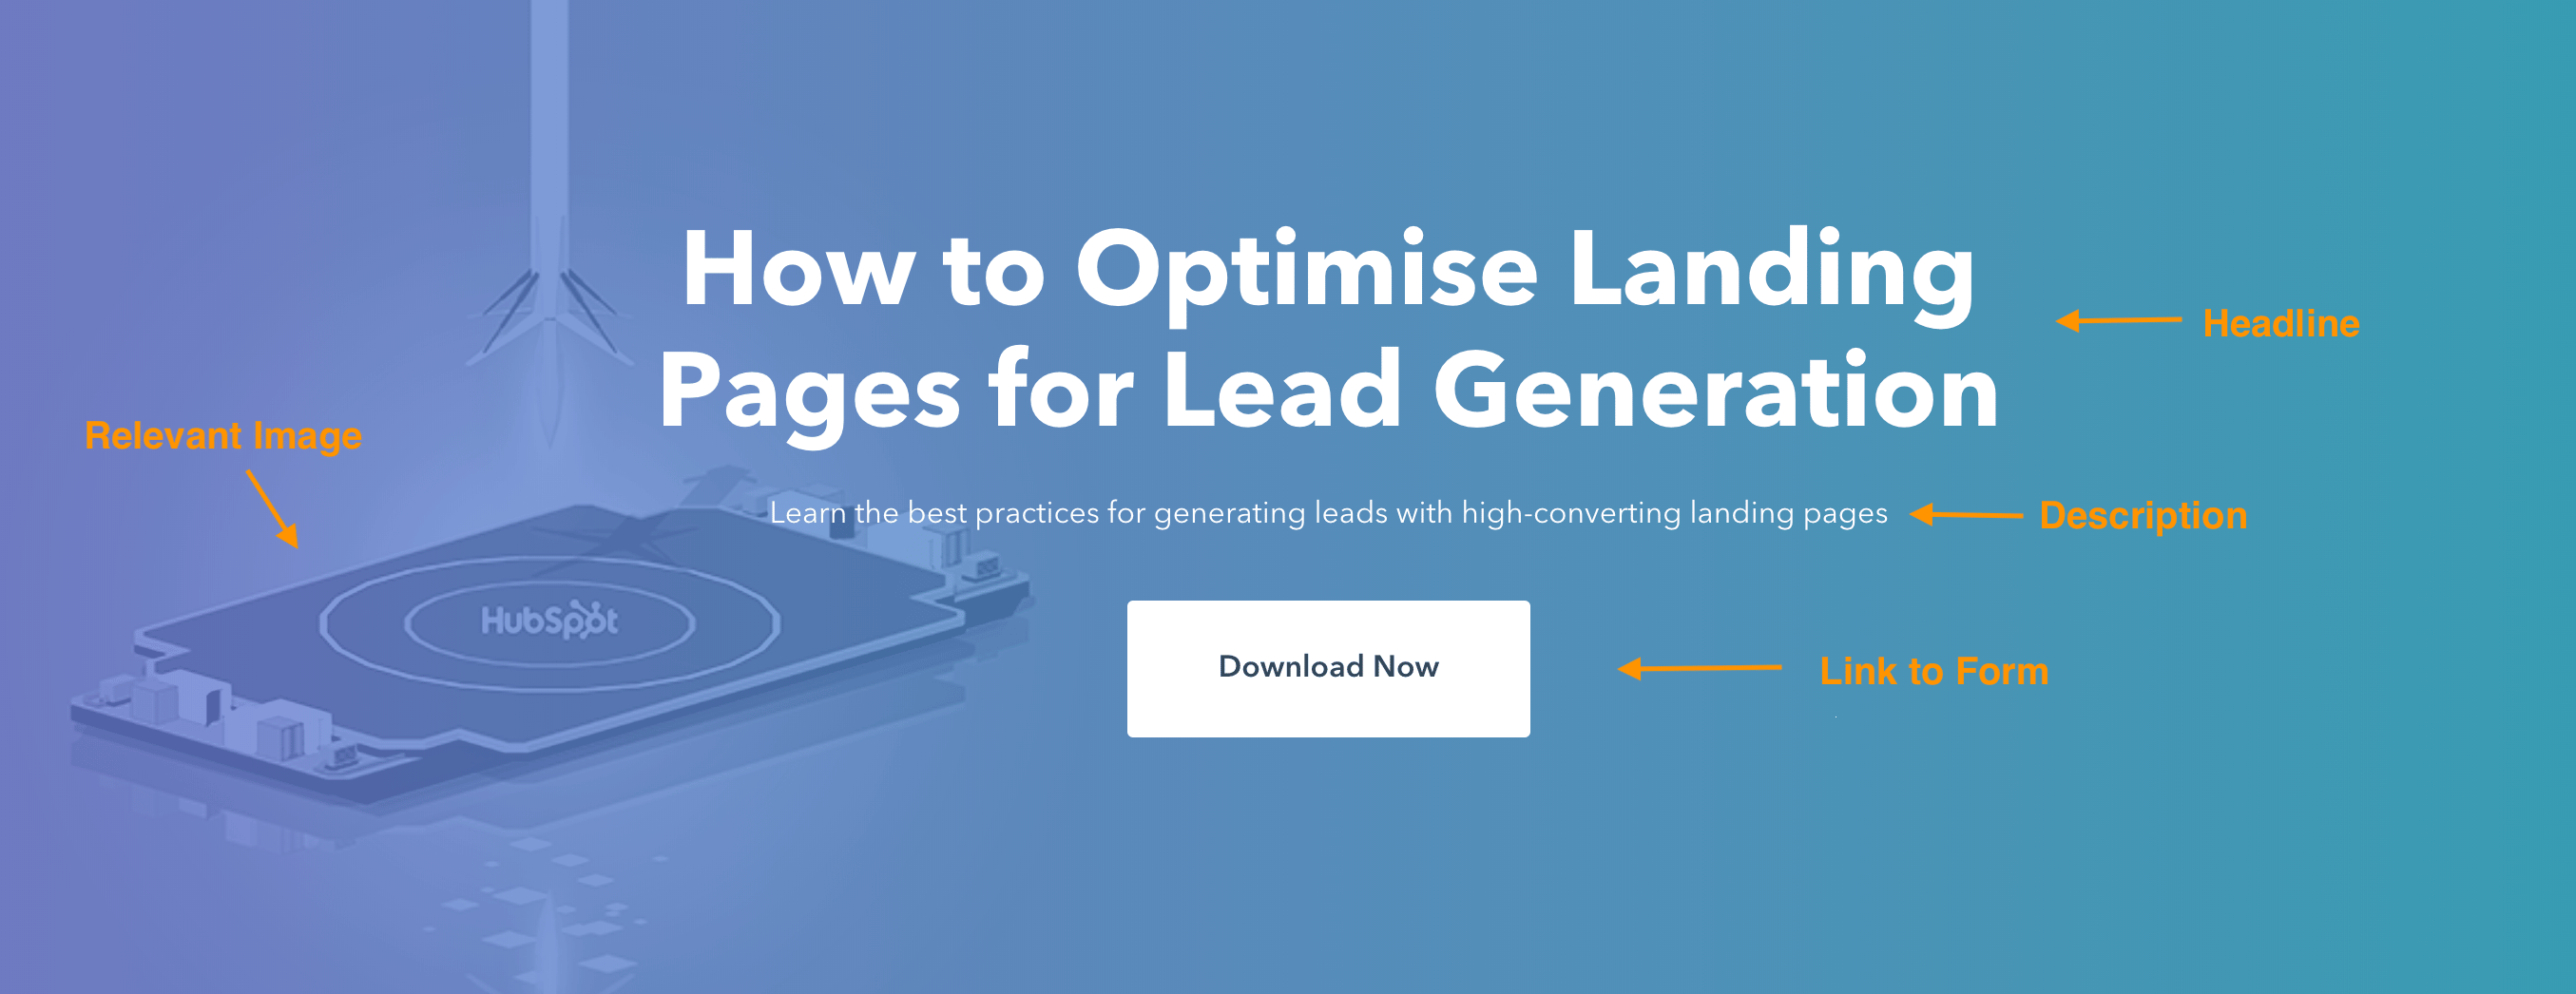
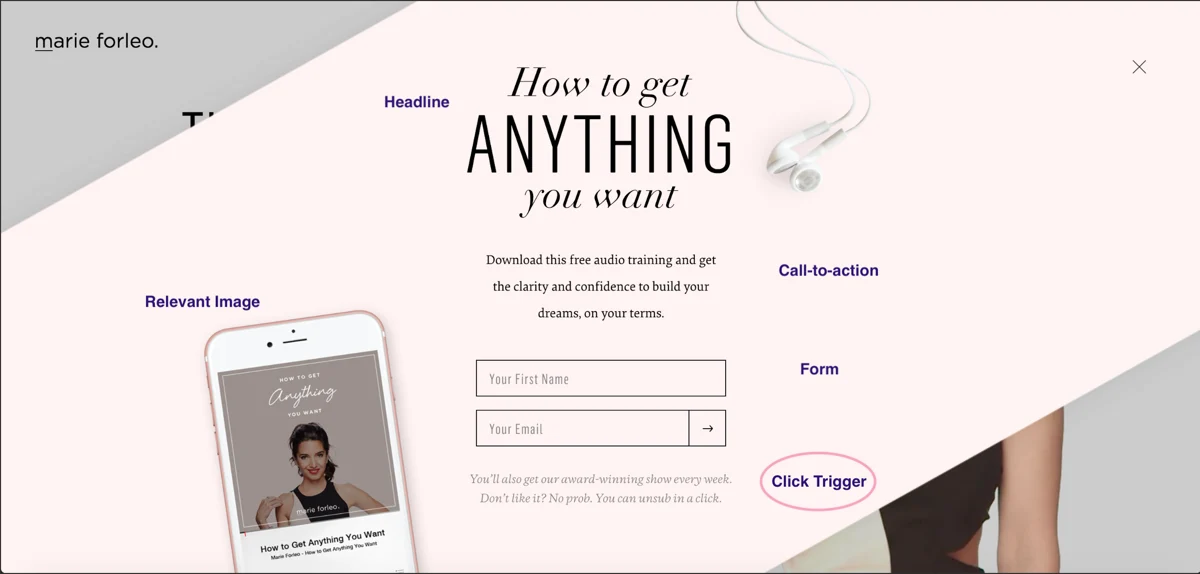
A good landing page has five elements (check out the landing page example below to see these elements in practice):

  1. Headline that grabs the visitors’ attention
  2. Relevant image that is relevant to your audience
  3. Lead form that sits above the fold to capture visitors’ information
  4. CTA that is action-oriented and compelling
  5. Copy and description that informs and entices your visitor to complete your form

Source

Can your landing page include more than this? Absolutely. (Think of social share buttons visitors can use to spread the word about your offer). This is simply the bare minimum.

You need to know your audience, where they are coming from, and where they are in their buyer’s journey to understand how much you need to include. The rule of thumb is to have as much information as you need to get people to convert.

Landing Page Layout

Trust me when I say most people don’t read every word of your cleverly crafted copy. Instead, they skim through and pull out the most important tidbits. Your job is to make those tidbits stand out so your visitor doesn’t miss anything important.

That means a few things …

  • Keep the most important information above the fold so your visitor doesn’t need to scroll to get to it.
  • Perform a blink test on your page, meaning a visitor should be able to gather the main message in less time than it takes them to blink, i.e., less than five seconds.
  • Use white (or unfavorable) space to keep your visitors engaged and focused and to help them comprehend your message.
  • Write with bullets and short paragraphs to make your copy easy to digest.

Try to work the critical copy into an F-pattern, which is the direction that most people scan a page online. Work with the flow of visual patterns to drive people to the key points that will get them to convert.

Landing Page Colors

The design of your landing page — including the colors you use — should reflect that of your website.

You’re aiming to form a long-term relationship with the people who visit your landing page, which means they need to become familiar with your branding colors and unique style.

The more they recognize your brand, the more they trust you (and the more they trust you, the easier it is to get them to do what you want them to do).

The areas where you should consider using alternate colors are on the elements of your page that need to stand out — ahem, your CTA button.

Contrast is the name of the game here. Say your branded colors are primarily green; you’ll want to choose a color that can draw users’ attention, say purple.

What colors perform well? We did a little research for you to determine which colors convert best.

Landing Page Images

The image on your landing page is one the first things people see, and since people process visuals far quicker than text, it sets the tone for their entire experience.

But how can you choose between millions of stock photos and that company photo shoot that’s taking up all the space on your computer?

Let’s narrow down the selection with a few essential questions:

Who is my target audience?

What does your persona look like? How old are they? How do they dress? What are they interested in? The answers to these questions are important in determining what image you will place front and center on your landing page.

If it will appeal to your audience, it needs to represent them somehow.

Where on my landing page do I want them to look?

This might seem odd, but it’s based on the idea that people follow directional cues, like where someone is looking or pointing. If you want visitors to fill out a form, consider an image that drives their attention toward that form.

Will this image reinforce my message?

Every element on your landing page serves an essential purpose. Since your image is one of the first things people see, it should help clarify what visitors can expect from your page. Make sure that your image adds value.

Here are other important things to consider when creating excellent landing page images.

Call-to-Action (CTA)

We’ve discussed your CTA a few times, but since it’s the most crucial part of your landing page, it’s worth mentioning again. When it comes to the design of your CTA, there are a few tricks that will make it so alluring that visitors feel compelled to click.

To clarify, your CTA includes the button and the copy you use to draw attention to it; these tips cover both.

  • Give your CTA a vibrant and contrasting color
  • Focus your CTA copy on the benefit to your visitor
  • Get to the point — try using no more than five words
  • Tell your visitor what you want them to do using action verbs, e.g., Get, Download, Click
  • Make your button large enough to stand out on the page
  • Give it some negative space — don’t crowd the area around your CTA
  • Follow the flow of the page and place your CTA where your readers’ eyes will go, such as to the right of or below the copy
  • Test your button shape, test your copy … as a matter of fact, test everything (we’ll cover how to do this below)

Source

Mobile Landing Page

More than half of website traffic comes from mobile devices; therefore, the user experience should be the same regardless of the device visitors use. By making your landing page responsive, you give them every opportunity to view and convert, whether on a desktop, phone, tablet, or otherwise.

Landing Page Copywriting Tips

After design comes excellent copy; your objective is to be compelling, instructive, likable, concise, effective, trustworthy, and informative. How? Keep reading.

1. Cover the main points.

No matter how you position it, there are a few main points that you need to hit with your copy.

Those main points are your persona’s pain point, the solution to that pain point, how your solution works (features), how your solution will improve their situation (benefits), and verification that it works (social proof).

Most of what you write needs to address how you can help your prospect, not how awesome you are (because that’s implied). Let’s go more in-depth on these points.

The Pain Point

The pain point that you focus on should be the one that your offer solves. Not to sound negative, but it’s important to touch on the problem your persona is facing so they know you understand what they’re going through.

Empathy is an effective way to build trust. And if they know you get their problem, they’re more likely to trust your solution.

Your Solution

The solution to their pain point is what you’re offering in exchange for their information. Illustrate a clear path between their problem and how your solution is the remedy they need.

Features

Knowing your solution may not be enough to convert leads, so you need to mention what’s included in that solution. If it’s an ebook, what are the subjects you cover?

If you’re promoting a webinar, how will it work, and what will you teach?

If it’s a service, what can they expect? Give your potential lead all the information they need to make a decision.

Benefits

Your copy should be heavy with benefits to the user because that’s what they care about — what’s in it for them. While features list what your offer has, benefits tell visitors how their situation will be improved.

Using your solution paints a vivid picture of how much better their life could be.

Social Proof

Studies show that social proof is adequate for persuading people to take a desired action.

Social proof comes in the form of logos of brands you’ve worked with, testimonials from previous clients, reviews of your product, or confirmation that others have purchased your service.

In essence, people also want to know that others have used and benefited from your solution. You validate your offer without saying anything by including social proof on your landing page.

Source

Touching on each of these points will provide you with well-rounded copy that answers all of your visitors’ questions … which brings me to my next point.

2. Preemptively respond to objections.

A key part of writing persuasive copy (copy that gets people to convert) is dismantling objections before they even come up. Now, this takes some skill … or at least some help from a friend.

Once you’ve laid your foundation by addressing all the main points, put yourself in your prospect’s mind and think about where they might protest or challenge you as they read.

For instance, if you say, “We’ve helped Fortune 500 companies bring in customers,” your reader might scoff or doubt it unless you follow that statement with social proof.

Do this exercise for every section of your page (or ask an unbiased friend to help) until you’ve covered every possible objection. When you get questions from people visiting your landing page, use that as feedback to further sharpen your copy.

To ensure your landing page meets every need, seek constructive criticism from your first few converted leads.

3. Build trust with your prospect.

You read a sales page, and the company wrote, “Our product has helped 100 people, and it might work for you, too!” Meh. I’d probably pass and find a company with a solution that can work for me.

Your goal is to build trust with your visitor, and the way to do that is to come across as an authority.

Besides using social proof, some other ways to build trust are:

  • Write how you speak and address your prospects like a live customer.
  • Cite statistics that support your message.
  • Use case studies that highlight customers similar to your target.
  • Be relatable. Show your audience that you’re human by admitting failures, opening up about doubts you’ve had, and being honest. The caveat is you should only share what is relevant to their struggle; don’t just divulge anything.

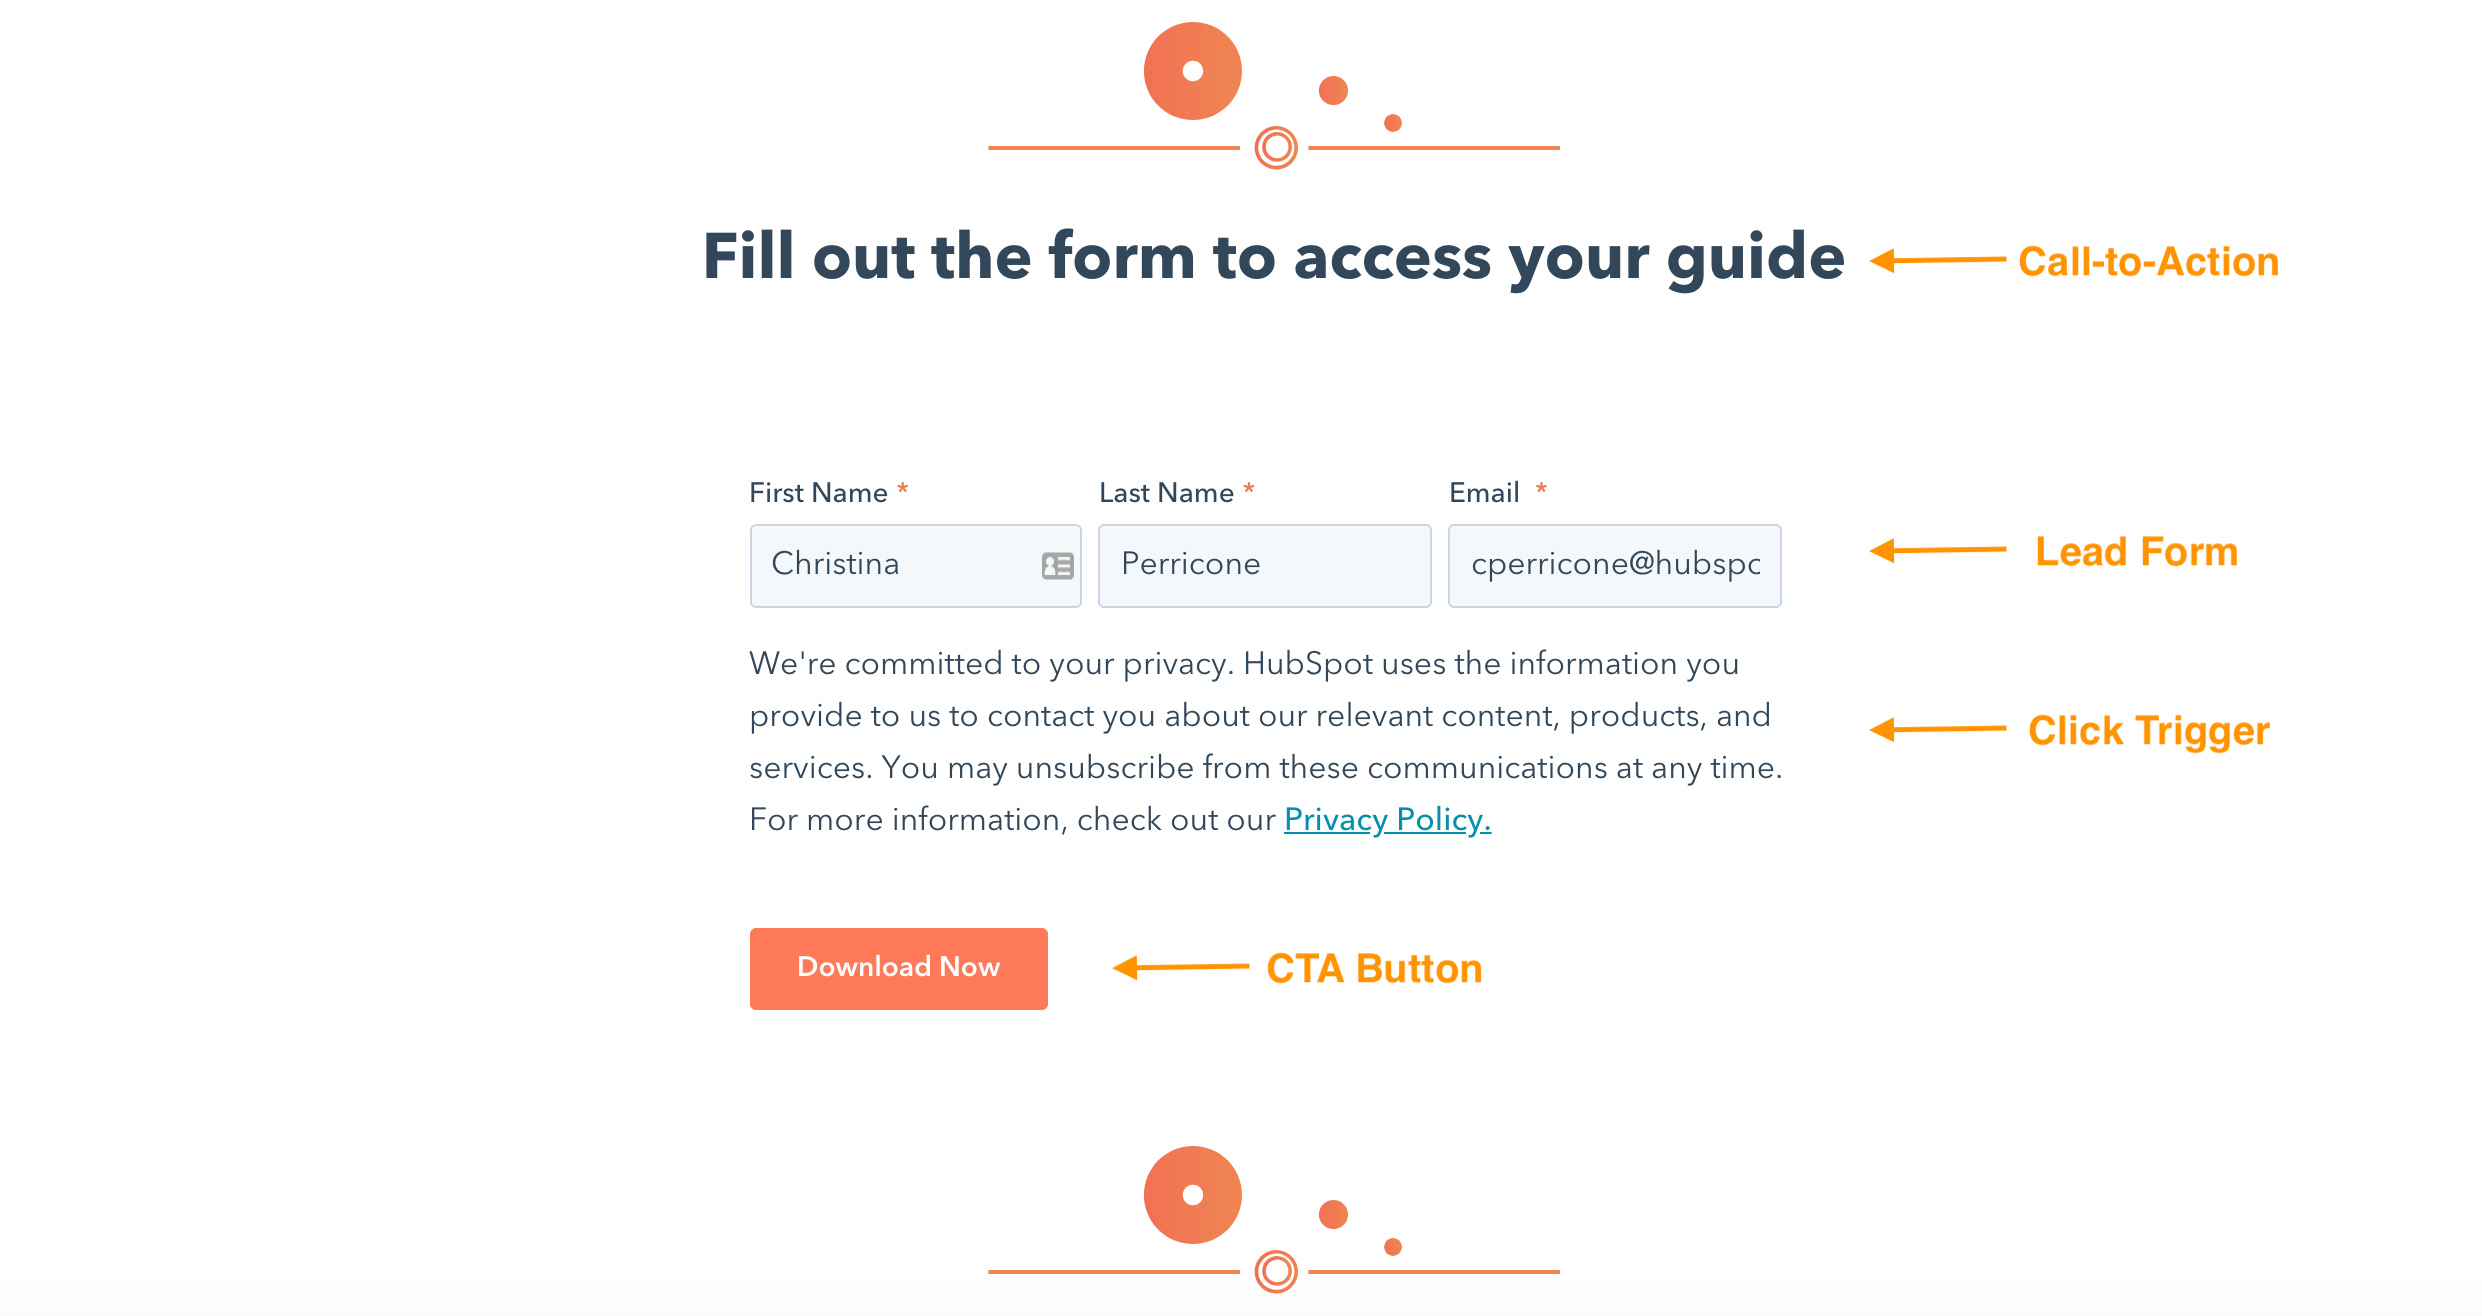
4. Use click triggers.

Click triggers eliminate that last bit of doubt before a visitor converts. You can think of them as lick Probability Enhancers (yes, I made up that term).

They are copy-positioned next to your CTA, which pushes your prospect over the edge by easing their mind and mitigating the risk of converting.

Below are some practical ways to employ click triggers:

  • Money-back guarantee
  • Easy unsubscribe
  • Quote from a successful or happy customer
  • Blurb on “what to expect”
  • Price slashing
  • Privacy policy
  • Some other creative method

Source

Whatever you choose, click triggers will give your conversions the boost they need.

A/B Testing Your Landing Page

Everything we’ve discussed until this point is great … in theory. However, your business differs from others, and your target audience is unique. How do you know if the copy you chose is working?

Or if your CTA placement is correct? Or what colors perform best?

Or which image to choose?

You test it. That’s how. Split testing (or A/B testing) is probably nothing new to you as a marketer, and split testing your landing page is just one more experiment to add to your list.

Let’s briefly go over how to best A/B test your landing pages.

What is A/B testing?

A/B testing simply splits your traffic into two (or more) page variations to see which performs better.

While you could do this manually by launching one take for some time, then another for the same amount of time, it’s far more efficient to use software that allows you to split test and track your results.

The main components of an A/B test are variants, or the two versions of the page, the champion, or the original page, and the challenger, or the page you modified to test against the original.

How to A/B Test

The most essential trick to split testing is minor tweaks with each experiment.

For instance, you don’t want to split-test your headline and image simultaneously because you won’t know which element garnered the results.

For this reason, stick to testing one element at a time. If the “winner” becomes your champion, you can create a new challenger to test the next element.

You repeat this cycle until you reach a conversion rate that you’re happy with (and that falls within realistic expectations, which we’ll cover below).

What should you test?

You can test virtually anything on your landing page. But while that’s possible, you may want to limit your test to a few of the most impactful elements of your page, like:

  • Headline copy
  • Image
  • CTA color
  • Click triggers
  • Copy on the page
  • Lead form length and fields

These tests will have the most significant impact on your conversion rates. Try starting with the simplest change, like a headline or CTA color, then work your way to the more significant undertakings, like your page copy.

Landing Page Metrics to Track

Metrics will tell you everything you need to know about how well your landing page is performing and give you some insight on improving it. It’s hard to know exactly what will work when you launch a page.

Measure and track meticulously in the beginning until you reach a relatively good conversion rate; then, you can track your metrics less frequently.

Page Visits

How many visits are you getting on your landing page? The more visits, the more you increase your probability of conversions. Adjust your paid strategy or redefine your keywords to drive more traffic to your page.

You can also inform your current followers about your offer through emails, social media, and your website.

Traffic Source

Knowing where your traffic is coming from will let you know where to double down or ditch your efforts.

Submission Rate

This is the number of people who complete your lead form and land on your thank you page. You can tweak your page to increase this number, but make sure to A/B test so you know what’s working.

Contacts

Contacts refer to the number of leads that you generate from your form. This differs from submissions because duplicate contacts are only counted once, meaning if a current lead fills out your form to get your offer, they don’t affect the count.

Heat Mapping

This is more of an observation of how people interact with your page than a metric. Heat mapping can show where people scroll, what they read, and how they engage with your page. This is all valuable data when thinking about your page layout and structure.

Bounce Rate

If visitors are coming to your page and leaving immediately, you must examine whether the content aligns with the offer. Does your copy capture visitors’ attention, and do visitors automatically know what to do when they land on your page?

Is your page a reflection of the copy you used to get people to visit it?

Form Abandonment

This metric tells how many people start filling out your form but don’t complete it. If this number is particularly high, some adjustments to consider are introducing new click triggers, shortening your form, or making it more transparent what you want your visitor to do.

Benchmarks

You must judge your landing page against industry norms and across a similar audience to know if it’s performing as expected. Check out some industry benchmarks to set as your baseline, but don’t be discouraged by other company’s results.

No matter what’s going on, diagnosing and healing your landing pages is possible if you pay attention to the metrics.

How to Make Your Landing Pages More Effective

There are always tweaks you can make to boost landing page performance. Below are a few great tips to get your landing pages leveled up.

Optimize your landing page.

Optimize is such a confusing word, isn’t it? Are we talking about imagery, copy, keywords, or UI? The answer is yes — we’re talking about all of it. Optimize just means to make your landing page the best it can be, and that can include a myriad of modifications.

You’ll need a pretty expansive guide if you want to know everything you can do to optimize your landing page. And, guess what, we have one here.

Present an outstanding offer.

You could argue that anything free qualifies as “good,” but that isn’t exactly true. Not only should your offer be free (we’re not talking sales pages here), but it must also be good enough to warrant a stranger giving you their personal information.

Let’s face it — many companies are competing for your audience’s attention, asking for their information and soliciting them via email. So, what’s going to make you stand out from the pack? An outstanding offer, that’s what.

Here are a few questions to determine if you have a compelling offer or not:

  • Does my offer solve a pain point for my target audience?
  • Is there a clear benefit that a lead can gain from this offer?
  • Can my offer rival the competition?

Decrease page load time.

A single-second delay in page load time means 7% fewer conversions and 11% fewer page views. Slow page load times can also result in customer dissatisfaction and frustration.

Landing page load time is a metric to take seriously. If you need some tips, check out this resource on decreasing page load time.

Keep the buyer’s journey in mind.

Since you’re driving traffic to your landing page, you should know where your visitors are in their buyer’s journey. That means you’ll see if they’re trying to diagnose a problem (awareness), looking for a solution to their problem (consideration), or are ready to close (decision).

Your copy and offer should reflect this if you want to convert. It’s no different from other marketing materials — meet your visitors where they are.

Create a seamless experience.

No one should be surprised when they arrive on your landing page. It should be exactly as advertised, meaning it should be consistent with your copy.

Use the exact words on your landing page that you used to get people to arrive there, whether it was a paid ad, social post, blog CTA, or email. If you want people to stick around, you must avoid the bait and switch at all costs.

Create a clear path to conversion.

There should be no guesswork involved in navigating your landing page. Once someone arrives on your page, what you want them to do should be clear — submit their info to your lead form. Your goal is to guide visitors to your form using creative directional cues.

Here are some ways to point your visitor to a conversion:

  • Choose an image of a person that is either gazing in the direction of or meaning to your form
  • Make your CTA a contrasting color to draw attention to it
  • Use arrows that point to your lead form
  • Insert anchor text that brings people back to the form when clicked
  • Give your CTA some negative space on the page
  • Frame your lead form with a bold color or outline

Add scarcity to your offer.

Few emotional marketing tactics work as well as fear and the fear of missing out (more formally known as FOMO). Consumers don’t like to lose their ability to choose, and once you make it clear that your offer is in high demand and/or short supply, they’re going to clamber to get it.

The other reason this technique works is that people want things that are hard to obtain — that signifies value and exclusivity.

To show scarcity, mention how little of your offer is left, include a countdown timer, and use words like “ends soon” or “last chance.” We want you to be genuine, so only employ actual tactics for your business.

Bottom line: there are many ways to use and benefit from this technique.

Use video.

Video marketing is becoming increasingly popular for good reason. Not only do customers prefer to see videos from companies, but 88% of video marketers say that video gives them positive ROI.

The key is to create a compelling video that doesn’t distract visitors from your ultimate goal: the call to action.

If you’re on the fence about using video, here are some reasons that might push you over the ledge:

  • Increases conversion rates
  • It is a more personable way to share a message and connect with prospects
  • It can be more engaging than an image and will get visitors in the habit of clicking (and converting)
  • Can reduce the number of support calls or tickets you receive
  • It is processed 60,000 times faster than text

If you plan to employ this tactic, VidYard has some helpful landing page video guidelines to follow.

Are you excited yet about how you can improve your landing pages? Sure, there are quite a few, but that just means that a poor-performing landing page doesn’t have to stay that way. Take it one tactic at a time and build as needed.

What to Do Post-Conversion: Lead Nurturing

So, you have an optimized landing page that converts like a charm. Now what? You don’t want to leave those leads hanging. Instead, you want to nurture them into becoming customers, then nurture them more. Here’s how.

Optimize your thank you page.

I hope you’re not tired of optimizing yet. Your thank you page is the first thing someone sees after they convert, so it is an excellent opportunity to delight your new lead even more than you already have.

Your objective is twofold: deliver your promised offer and get them interested in something else on your site.

Your thank you page should:

  • Thank your new lead (go figure)
  • Provide links to relevant content on your site
  • Invite your lead to follow you on social media
  • Ask your lead to subscribe to your blog
  • Automate a follow-up email with the offer

Guide them along their buyer’s journey.

Your new lead will make their way to the decision stage with or without you. You want to be the one to help them get there. You’ve gathered valuable information about your lead to anticipate what they need next.

Provide content or resources to bring them to the subsequent stage of their journey; you might just be their option for the decision stage. After all, we know that prospects buy from companies that they know, like, and trust.

Form a relationship.

Once someone signs up to receive information from you, they become a potential customer with whom you should work hard to build a relationship and connection.

The good thing is you already know what they’re interested in and their pain points so you can target them with additional, helpful content and personalized marketing.

If you’re still stuck, get some inspiration from some of the best landing pages we could find.

Grow Better with Landing Pages

Landing pages will account for most of your new leads, demanding your attention. With the many tweaks, additions, and variations you can implement, there’s no reason you can’t have a landing page that converts well.

As long as you follow the best practices we covered above, you’ll be on your way to a high-performing landing page.

Editor’s note: This post was originally published in August 2019 and has been updated for comprehensiveness.

New Call-to-action

Categories B2B

11 Website Page Load Time Statistics [+ How to Increase Conversion Rate]

Page load time is a critical metric that influences your entire site’s performance.

Even a few milliseconds can significantly impact the user experience (UX), conversion rates, and, ultimately, revenue that your site drives.

Speed Up Your Website with HubSpot's Built-In CDN

In this post, you’ll learn why your page load speed is important, how it affects your business, and some quick and easy tips to improve your performance.

Table of Contents

What is website load time?

Website load time — or page load time — refers to how long it takes for a website, or web page, to fully load and appear ‘on-screen’ when a user requests to visit that site.

Or, simply put, it is how quickly the content of a web page is displayed when a user clicks on the site.

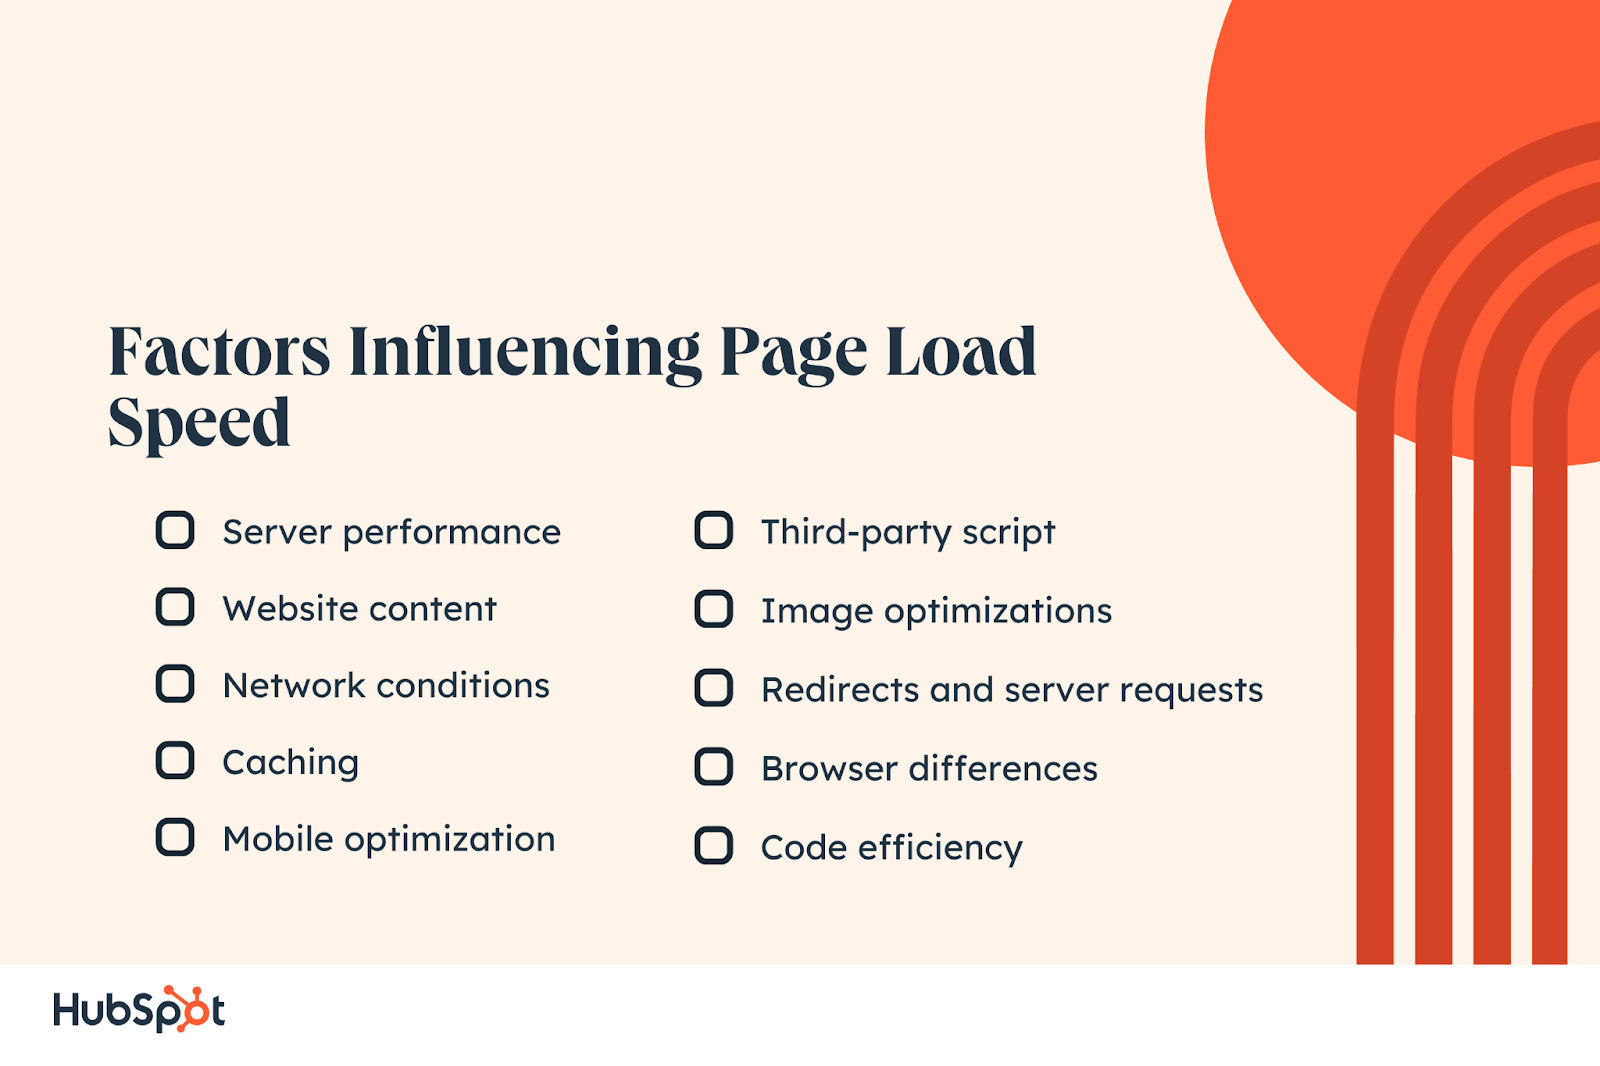
Factors That Influence Website Load Time

Website or page speed depends on a wide range of factors.

“Internal” factors such as page elements, file sizes, code efficiency, plugins/widgets, etc can all impact page speed.

Similarly, “external” factors, such as server/host response times, network connections, etc., can significantly impact how quickly a page loads.

But even aside from these, the type of device a user accesses a site from can also determine how quickly the site loads.

According to Jillian Streit, a website strategist at Blue Frog, “Unfortunately, most mobile pages take much longer to load than their desktop counterparts, and mobile users expect pages to load much faster on their mobile devices.”

So, it is essential to carefully consider and optimize all these factors (internal and external) to ensure that your site loads quickly and efficiently.

For step-by-step instructions on how to do this, check out this guide that walks you through measuring and improving page speed and this post that shares 19 actionable website optimization strategies.

What is the average page load time?

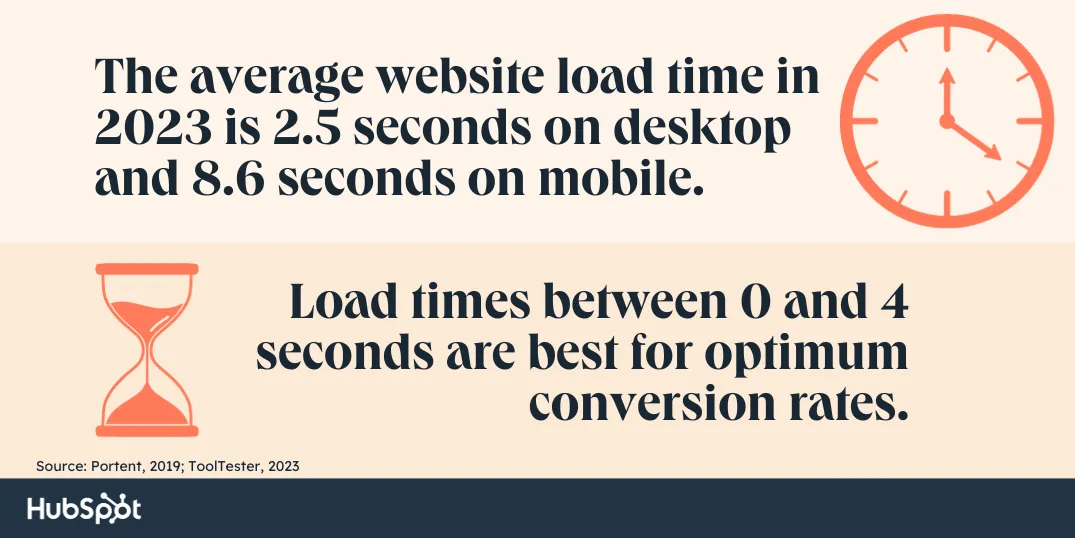
The average website load time in 2023 is 2.5 seconds on desktop and 8.6 seconds on mobile, according to a recent report that analyzed over 4 billion web visits.

What is a good page load time?

Although the 2023 study is one of the more recent page load time studies, several older studies have found that much lower page speeds are required to be truly competitive.

For example, a study by Portent found that a load time between 0-4 seconds is best for optimum conversion rates.

For this reason, simply consider the average speed from the 2023 Website Loading Times Report mentioned above as a benchmark or reference point to measure and compare your current performance against the general average across an extensive range of sites.

Case in point, the study also found that only 34% of the top 100 websites (which formed a significant basis of the analyses in the study) passed their Core Web Vitals.

11 Page Load Time Statistics

Here are 11 statistics that will give you a better understanding of how your website load time could impact your site’s performance, specifically conversion rates.

Let’s get started.

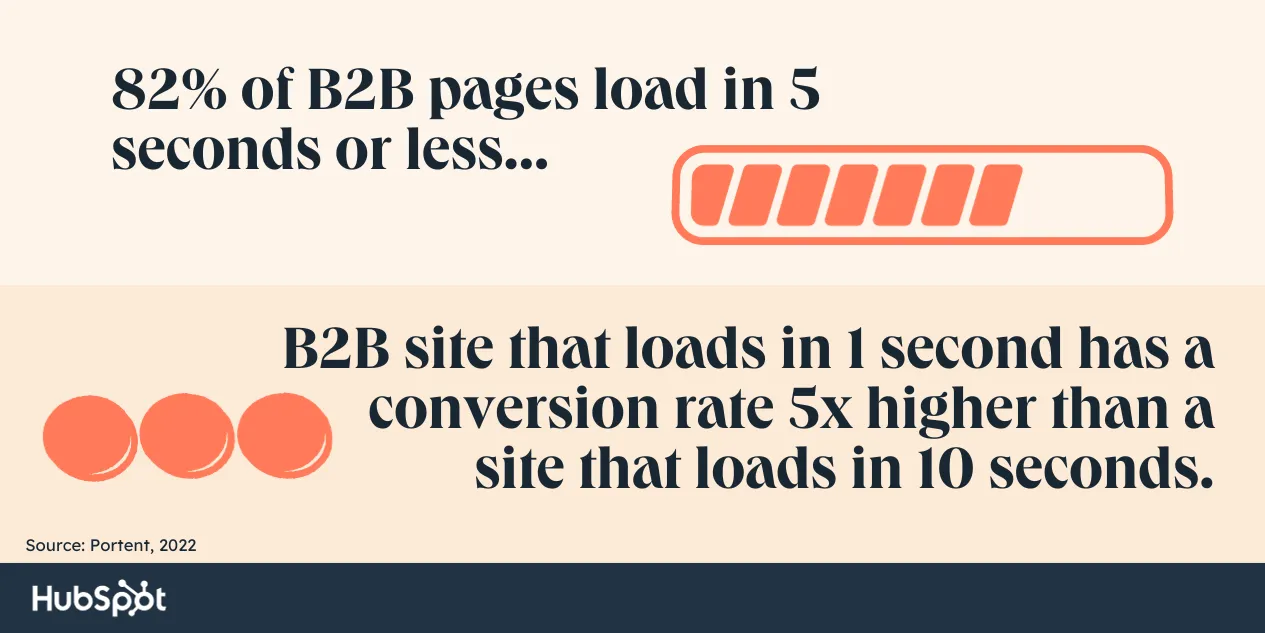
  • The average page load speed of B2B sites hasn’t improved over the last four years, according to a 2022 study by Portent.

  • However, simply being within the industry benchmarks might not be enough. The Portent study also found a significant correlation between load speeds and conversions. According to the findings of that study, a B2B site that loads in 1 second has a conversion rate 3x higher than a site that loads in 5 seconds.
  • And this impact becomes even more pronounced when the difference is further exaggerated. The study found that a B2B site that loads in 1 second has a conversion rate 5x higher than a site that loads in 10 seconds.
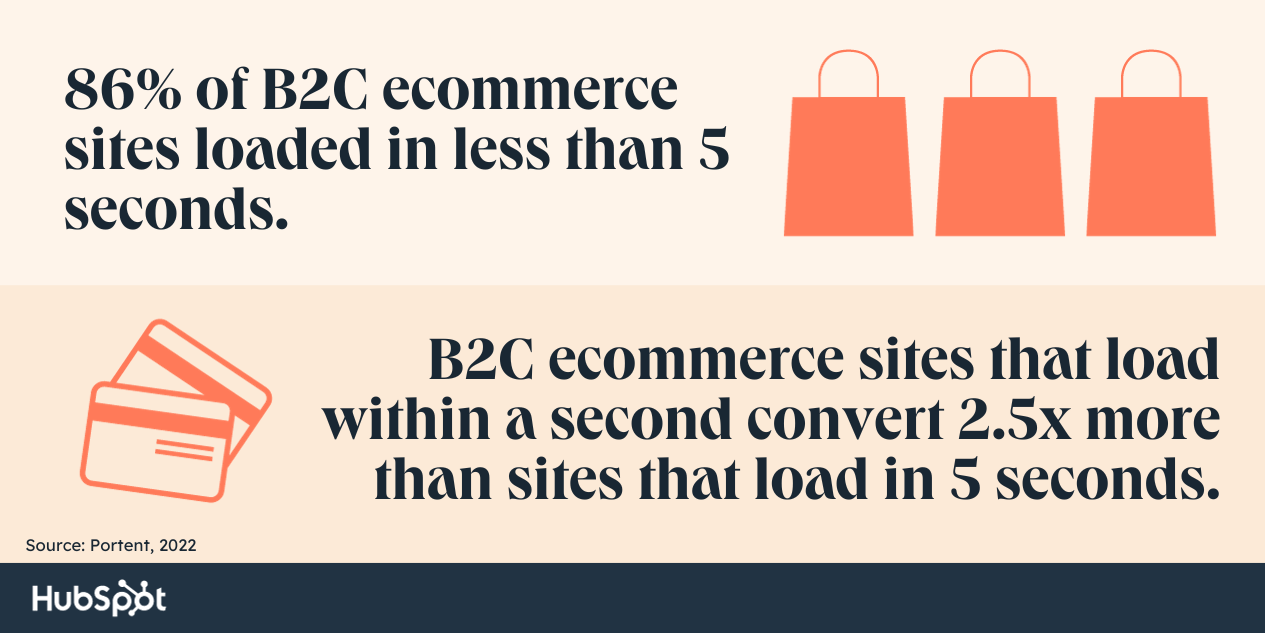
  • But even more interesting is that B2C eCommerce might potentially be even more unforgiving regarding website load times. In 2019, 81% of B2C ecommerce sites loaded in less than 5 seconds — similar to the number of B2B sites today. However, in 2023, that number has jumped up to 86%.

  • Interestingly, the performance difference for sites that load within this 5-second bracket is similar to that observed in B2B sites. An ecommerce site that loads within a second converts 2.5x more visitors than a site that loads in 5 seconds.
  • But what exactly do these “improvements” look like in the real world? Vodafone recently conducted an A/B test to measure the impact of optimized Web Vitals. The results showed that a 31% improvement in LCP (which measures the loading performance of a page) led to a 15% improvement in their lead-to-visit rate, an 11% improvement in their cart-to-visit rate, and 8% more sales.
  • So, how can you improve your page load times and potentially generate similar results? Well, a quick and easy win is simply optimizing your website for mobile devices. Although mobile currently accounts for more than half of the web traffic worldwide, several studies have found that mobile page load speeds are still significantly worse, on average, than desktop.
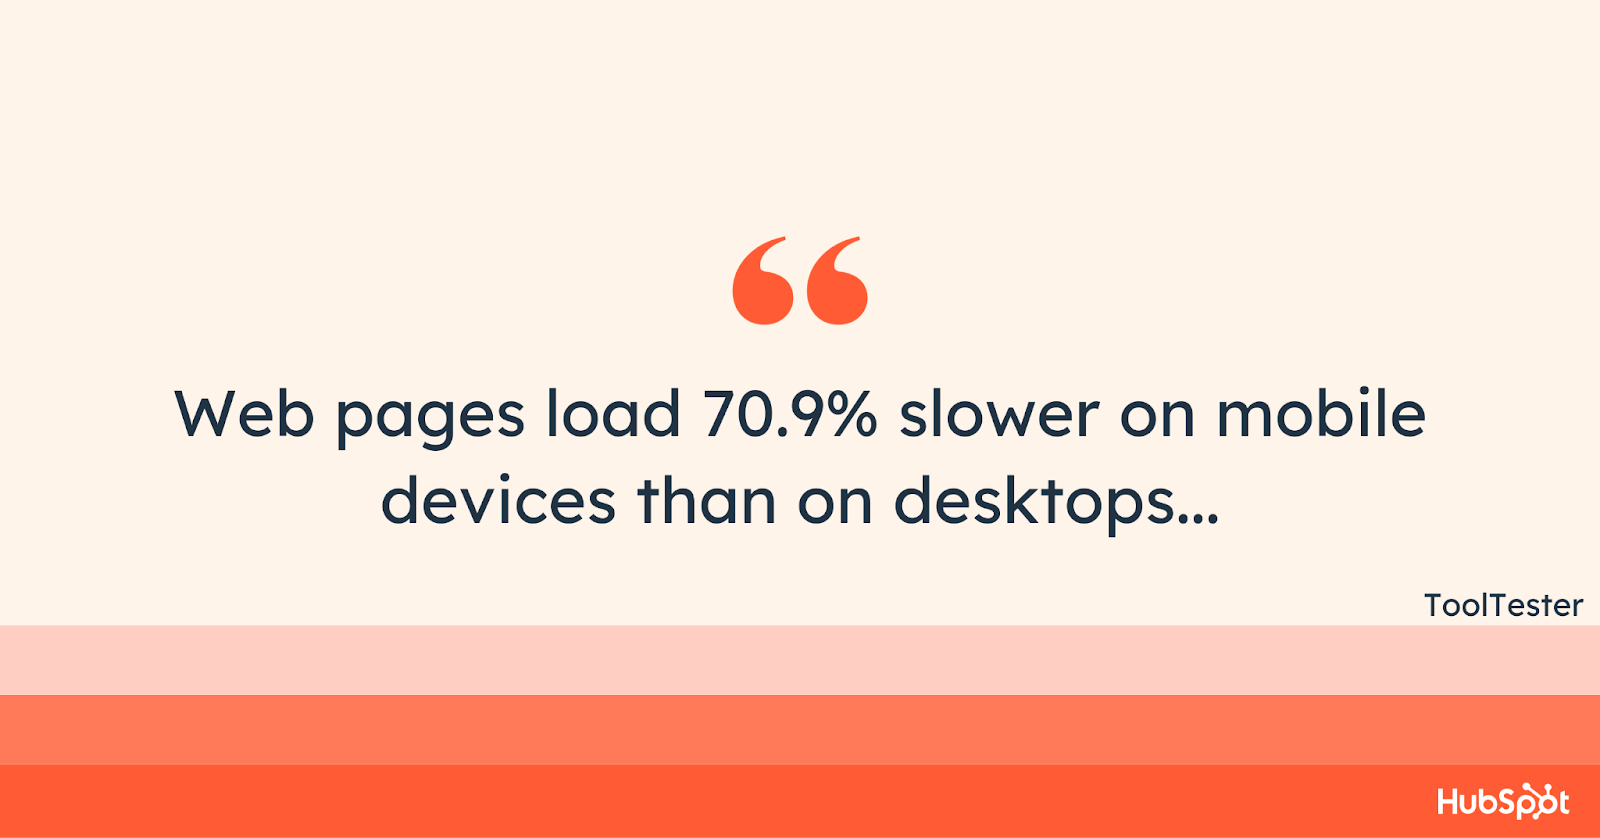
  • A 2023 report found that web pages load 70.9% slower on mobile devices than on desktops. Interestingly, this study also found that mobile site performance was significantly worse across every website-building platform analyzed.

  • And, on website builders, another easy but significant page speed boost could be found by changing your current provider. One study analyzed 400 websites built by the top 12 website builders. This research found an almost 2-second difference in average page load times between the top and worst-performing platforms.
  • And keep in mind that these numbers were for desktop sites. According to this report, load speeds for mobile pages dropped drastically to an average of 6.40 seconds for even the best performer, Godaddy, while the worst performer had an average load speed of 15.26 seconds.
  • Finally, as you begin to optimize your website, you should initially direct your focus to pages that attract high-intent traffic. The Portent Page Speed Study report also found that faster speeds on checkout pages, login pages, etc, made the most impact.

Other than these, several strategies can help you significantly improve your page load speeds. So, make sure to check out the guides recommended in the previous sections of this post.

Page Load Time Takeaways for Marketers

Optimizing your page load speed is integral to boosting conversion rates and sales revenue.

While a few extra seconds may not seem like a big deal, statistics show that as each second passes, the potential to lose out on prospective customers increases.

If you’re concerned your website’s page load speed could be hindering your company’s growth, there are a few solutions to decrease the time it takes for your website to load.

Online tools like Pingdom Website Speed Test, GTmetrix, and Google PageSpeed Insights allow you to time and test your website’s page speed. You can also cache your website or enable browser caching to speed up your page load time.

Ensuring your load time is as efficient as possible doesn’t necessarily take a long time or significant effort, but it requires some thought.

So, start thinking about optimizing your web page speed — and you’ll see an improvement in your UX, conversions, time-on-page, and revenue in no time.

Editor’s note: This post was originally published in March 2017 and has been updated for comprehensiveness.

New Call-to-action

Categories B2B

14 Essential Design Tips for Beginners: Transform Your Skills and Create Stunning Graphics

From logos, posters, magazines, product packaging, and ads, we see graphic design at work every day.

It’s an industry that’s always in demand. Why? Because brands always need designers, whether it’s to create branding assets or design an upcoming event flyer.

Take our free Graphic Design Essentials Course on HubSpot Academy to learn  design fundamentals and how to create simple designs.

If it’s an industry you’re interested in, discover the tips you can use today as you start your career.

There isn’t one way to become a graphic designer, but there are some tips that can lead you in the right direction to improve your skills and set yourself up for success.

1. Learn fundamental design principles.

Graphic design is a visual communication tool that combines graphics, typography, color, and illustration to communicate a message.

And while there are endless ways to communicate a message (that’s where the creative part comes into play), there are fundamental principles that every graphic designer must follow:

  • Hierarchy
  • Alignment
  • Contrast
  • Space
  • Color
  • Proximity
  • Repetition
  • Balance

These fundamental concepts ensure a design is cohesive, impactful, and clear.

In addition to these principles, other elements come into play, such as typography and color theory.

2. Enroll in a graphic design course.

Contrary to popular belief, having an eye for design isn’t an innate trait – it’s a learned skill.

Courses can teach you about the history of graphic design, the various subdivisions within the discipline, the psychology behind design principles, and the tools you’ll need.

Here are the top online resources for graphic design courses:

Then, of course, there’s always YouTube University. The best thing about this university is that it’s 100% free. Though, it‘s not guaranteed that you’ll receive the same depth in the material on YouTube, and you won’t have the support of a professor. However, it can be an excellent place to start if you’re on a budget or learning on your own time.

3. Master a design program of your choosing.

It’s hard to think of graphic design without immediately considering the tools they use.

So much of graphic design work relies on using tools like Adobe Illustrator, Adobe InDesign, Adobe Photoshop, and Sketch.

These are all powerful software that allows you to create everything from logos and illustrations to website designs.

While they aren’t accessible to use, consider them investments in your career, as you will likely use them for every project you take on.

4. Network with fellow designers.

In addition to the knowledge you’ll gain from your courses, it’s essential to speak with designers who are currently working in the field. This will help you get a 360-view of what it’s like working as a graphic designer and what it takes to succeed in your role.

Start on social networks like Facebook and LinkedIn. You’ll find plenty of design communities and groups that share information and opportunities.

You can also use sites like MeetUp to find designers in your area who are interested in meeting up, as well as Eventbrite, to find fun events you can join.

Networking across is as important as networking up. Make sure you lean on your community for support and advice as you develop your skills as a graphic designer.

5. Practice, then practice some more.

When learning anything new, practicing is key. It’s not enough to take in the knowledge — you have to use it and learn how it works in real-time. Search for graphic design exercises online to further hone in your skill.

For instance, Type Connection and  KernType allow you to test your typography skills. You can also use sites like Sharpen to find design prompts to work on. They have prompts in various categories, from branding to marketing and user experience (UX).

Once you feel confident in your ability, consider taking on a design project of your own. It could be a passion project you give yourself or seek out. Getting real-world experience in what it takes to take a project from start to finish, and all of the non-design implications, are important to consider.

6. Follow design influencers and industry leaders.

There‘s much to learn from influencers or leaders in the field of graphic design. They’re highly knowledgeable in their niche and are often willing to share the secrets to their success in their content.

If you seek out their content regularly, you’ll become more familiar with the graphic design world, discover more tips from industry leaders, become comfortable with relevant terminology, and stay on top of trends.

Wondering how to engage? Turn to YouTube, X (Twitter), Instagram, and even Tiktok.

And don’t be afraid to reach out to them. You never know who might respond to your questions – and any positive connection you make will only help you move further along in your journey.

What I Recommend

  • Build a X List of influential designers, so you can follow their daily insights without picking out their tweets from a sea of friends, coworkers, and news sources on your timeline.
  • Have a mix of well-known designers who inspire you and those whose work you do not enjoy. That last point may seem counterintuitive, but consistently observing the work of that group can help you understand why you don’t like it, which is a crucial part of understanding design.

7. Build an inspiration catalog.

Start building a catalog of work that is successful.

That can be as simple as bookmarking images in your web browser, making a Pinterest board, or saving items to a folder on your computer.

Sifting through a catalog of inspiring work will help you to identify trends – both past and present – and can inform your style.

What I Recommend

  • Get acquainted with leading designer portfolio sites like Dribbble and Behance. These platforms showcase an abundance of high-quality work from leading designers across the spectrum – everyone from web and UX designers, to graphic designers and typographers.
  • Set aside time in your day to review these sites and use apps like Panda to make the collection process easier.

8. Dissect the process.

Dissect designs you admire to understand the steps and techniques involved.

One of the most pivotal moments in my design journey was when I recognized that every single illustration, infographic, and icon I had ever ogled over was the product of someone mastering how to combine shapes and lines.

Analyzing the process behind a design will allow you to understand the steps required to produce a piece of work. Depending on your current skill level, you may have a leg up in knowing which tools were used, or which aspect was created first. But if you‘re a beginner, don’t let that stop you – examining the construction of a design will let you flex your creative muscle.

What I Recommend

  • Download a free vector or PSD design resource, and dig through the layers to see how the designer constructed the object. You can find a number of those files here.
  • Once you pick your file, open it in Photoshop, then open the Layers Panel (which you can learn to use here) and un-collapse some of the folders, so that you can see the layers contained within them.

By simply changing the visibility of the layers, you can begin to see how the designer used each shape to build upon one another. You can also begin to understand how to use Photoshop Effects, like drop shadows and strokes.

9. Get specific with your online search queries.

As you begin creating your own designs, you’ll likely hit an obstacle where you think to yourself, “Hmm, how the heck do I do that?

Chances are, others have wondered the same thing.

Like many self-taught disciplines these days, the majority of my own technical design knowledge was gained by watching a YouTube tutorial while I actively followed along.

The key is to be really specific with your searches, so you can find a highly relevant tutorial.

Searching for something like “How to Create an Icon” might deliver really broad search results. Instead, type in exactly what you want to learn, like, “How to Create a Flat Icon with a Long Shadow.” Boom.

What I Recommend

Browse a design terminology glossary to find the specific terms for techniques you‘re trying to learn. That can help you find what you’re looking for online much more easily, in addition to helping you familiarize yourself with the language.

10. Replicate your favorite work for learning purposes.

Let me be clear: Under no circumstances should you infringe on anyone‘s copyrighted work. Never reproduce someone else’s work and try to pass it off as your own.

That said, re-creating a design you like is helpful to gain a deeper understanding of design techniques.

You‘ll have to get creative with the method you choose to recreate the design. Don’t get frustrated if you can’t duplicate a design exactly – remember, the process is more important than the result.

What I Recommend

  • Find a design piece you think is successful, which should be easy if you’ve created an inspiration catalog.
  • Open up your go-to design software to recreate it.
  • Start dissecting the design and recreating it using your own process.
  • If you get stuck, use specific search queries and lean on your design community.

11. Embrace negative space.

Beginner and advanced designers alike often overlook the proper use of negative space.

What is negative space, or white space? It‘s the space in your design that’s not occupied by any visual or written element. A design piece that doesn’t incorporate enough negative space is like a sentence with no spaces: itisdifficulttocomprehend.

What I Recommend

Remember, there’s no hard-and-fast rule to using white space. It takes practice. Eventually, exercises in resizing elements of your composition and changing the layout will lead to a natural understanding of the amount of breathing room required.

12. Seek constructive feedback.

On some level, everyone is afraid of criticism. Learning to accept constructive criticism is no easy task, but it’s key to becoming a better designer.

Paul Arden, who was the creative force behind Saatchi & Saatchi at the pinnacle of its success, wrote this in his best-selling book, It‘s Not How Good You Are, It’s How Good You Want to Be:

“If, instead of seeking approval, you ask, ‘What’s wrong with it? How can I improve it?’ you are more likely to get a truthful, critical answer. You may even get an improvement on your idea. And you are still in a position to reject the criticism if you think it is wrong. Can you find fault with this?”

Design critics allow us to incorporate others‘ viewpoints into our work and improve our ideas. You always have the option to reject the feedback, but considering it in the first place is what’s important.

What I Recommend

  • Have a one-on-one conversation with an experienced designer. If you don’t know anyone in the design world, join an online community of designers.
  • Post on Reddit’s Design Critiques.
  • Publish your work on social media and ask for feedback from fellow designers.

13. Undertake a passion project.

Engage in design projects that align with your interests and passions. These projects will motivate you to push through challenges and provide direction during the early stages of your learning journey.

What I Recommend

  • Align your interests or current situation with your projects. If you’re a blogger, try creating the header image for your next post. V
  • Voice your willingness to work on an offer with your content team.

There are several ways to work design into your day, but it’s up to you to pick something that matters to you. And if you’re trying to market your work to the world from a personal portfolio or website, use HubSpot’s SEO Marketing Software.

content-management-seo tool

Present your hard work in a format where professionals can see it clearly, and let the tool do the heavy lifting for you, generating copy and meta descriptions that target the niche your work caters to.

14. Just start.

It’s easy to be intimidated by the sheer amount of learning associated with graphic design, but remember that even the most talented designers were newbies once, too.

What makes the creative field so special is that everyone‘s journey is unique – there’s no one way to approach DIY design. You’ll find your own means to discern what you want and need to learn.

Furthermore, design is an iterative process, so keep reworking your ideas and projects.

Grow Your Career in Graphic Design

As you progress, you‘ll develop your own workflow, and one day, that design that took you all day will only take you a mere fraction of time. Trust me, I’m living proof.

Editor’s Note: This post was originally published in June 2017 and has since been updated for comprehensiveness.

New Call-to-action

Categories B2B

Why Intent Data Should Be An Essential Part Of Sales Enablement

In a previous post, we covered how to get the sales handoff right and why first-party and validated buyer data is essential in this process

It’s important to realize that although intent data has played a major role in discovering and nurturing leads before being handed over to sales, its job isn’t finished at that handover. There is still work that intent data can do.

Here’s a look at sales enablement and why intent data should play a part in this vital part of the sales process. 

Luna is hard at work on her flux capacitor, fusing intent data into her sales approach. [Image via ChatGPT]

How does intent data support the sales enablement process?

Let’s start off with a quick definition, as Oracle defines it:

Sales enablement is the set of tools and content provided to your sales teams to help them sell smarter and sell more.

Sales enablement also includes the processes that marketers undertake to help sales reps sell. This encompasses everything that’s done to generate leads, manage those leads and then hand those leads over to the sales team.

According to Gartner, sales enablement is owned by both sales and marketing, with marketing being responsible for creating resources, including content, messaging, and training. In fact, sales enablement is the top sales activity that marketing is actively involved in

But where does intent data fit into the equation? If you are unsure what intent data is, have a look at our post on buyer-level intent for a detailed exploration of this crucial form of data.

Intent data, especially at the buyer level, reveals the interests and behaviors of your target buyers. 

Think of intent data as the digital footprints left by your prospects, revealing insights into what they are searching for, the content they engage with, and the online behavior that points towards their readiness to purchase. 

This game-changing intelligence is key for sale enablement as it arms sales teams with valuable information about their buyers: They know who the buyer is and what their needs are. 

This, in turn, permits sales to custom-fit their outreach and messaging so that it’s meaningful, personalized, and relevant

Additionally, buyer-level intent data allows sales teams to discern between lukewarm leads and those showing high engagement and interest. Being able to prioritize allows sales teams to concentrate their efforts more efficiently and funnel their attention to those leads that are most likely to convert. 

What are the benefits of incorporating intent data into sales enablement initiatives?

We have already covered how intent data supports sales enablement by providing sales teams with useful and relevant data about buyers, but what are the tangible benefits of integrating intent data into your sales enablement initiatives? Let’s have a look.

Improved lead quality:
This benefit starts well before a buyer appears on sales’ radar. Buyer-level intent data ensures better quality leads are being passed from marketing to sales because marketing is able to see what a buyer is engaging with, why they are doing so, and, most importantly, who that buyer is.

When that lead is handed over to sales, they already know who they are engaging and their pain points. They also know that the buyer is in the late stage of their journey and ready to make a purchase decision.

More efficient sales processes:
Sales can be tricky business, especially if you don’t really know who you are selling to. If you are relying solely on account-level intent data, you’ll have some inkling into the account but you don’t know
who you are selling to.

Not knowing the who can often feel like you’re wasting time and resources on chasing an account and never getting to a person. However, with buyer-level intent data, sales processes are more efficient because you have access to the who but also the why and when.

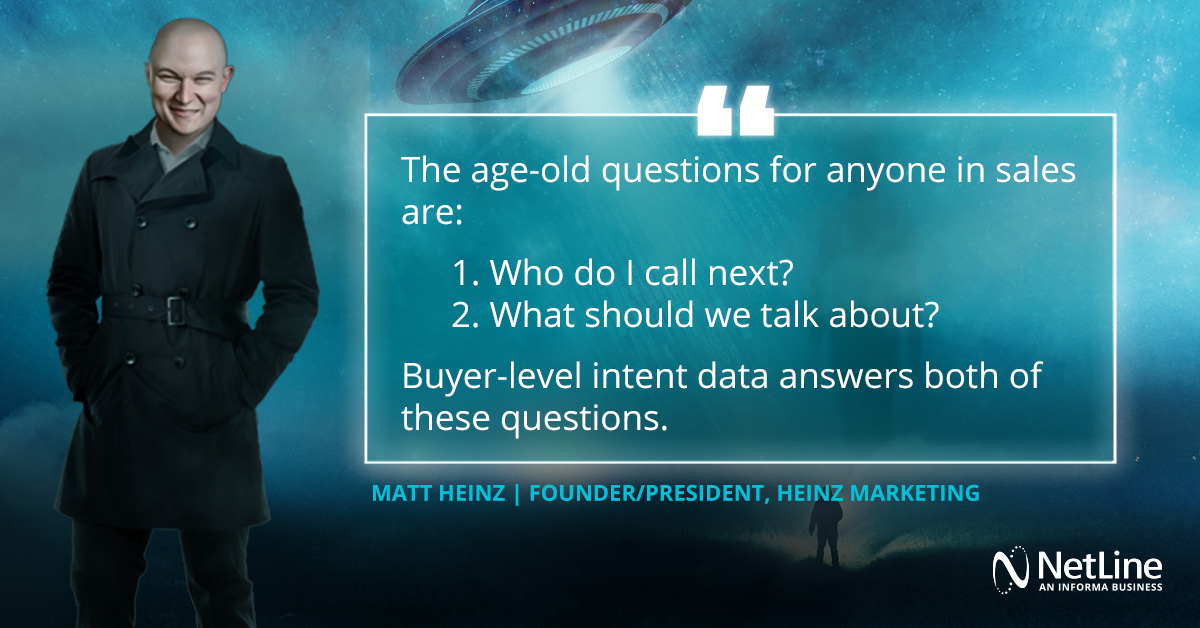
As Matt Heinz, Founder/President of Heinz Marketing, explains in NetLine’s The Proof is Out There report: 

Buyer-level intent data answers both of these questions. It’s not just about ‘who’ to call. When you add ‘why’ and ‘when,’ it’s like adding rocket fuel to your sales engagement, productivity and conversion metrics.

Matt Heinz, Founder/President of Heinz Marketing, from NetLine’s The Proof is Out There eBook.

Increased conversion rates:
We saved the best for last because the ultimate goal in sales is to convert a prospect into a customer. It’s not always an easy task, but understanding a buyer’s needs and preferences is half the battle won.

By using customer intent data, sales teams are able to tailor their messaging and outreach in a way that resonates with the buyer’s interests and solves their pain points, leading to higher engagement and, subsequently, higher conversion rates.

How can sales teams use intent data to improve their understanding of buyer needs and preferences?

So, how can sales teams use intent data to improve their understanding of buyer needs and preferences?

We already know that buyer-level intent data reveals who the buyer is. If you have the right technology, you can also answer the all-important questions of what, when, and where.

What actions is the buyer taking? When are these actions taking place? And, where did the actions occur? 

With this information, sales can hold much more efficient discovery calls because they already have answers to many of the basic questions.

They are aware of the topics the buyer has been exploring and, therefore, have a much firmer grasp of the buyer’s pain points and the problems they are trying to solve. This enables sales to style their outreach in a more personalized and precise way. 

Moreover, with improved lead quality, sales will only be approaching buyers who are in-market and receptive to what’s on offer. No more wasting time and effort on prospects who aren’t ready to buy or aren’t showing interest in your product or service. 

Finally, because sales know who the buyers are, they are able to identify the most important decision-makers and influencers within the target account. Again, this knowledge enables sales to focus their efforts on those individuals who have a say in buying decisions and can provide them with messaging and content that is relevant to their role. 

How can intent data be used to create more effective sales collateral and resources?

Beyond informing outreach, intent data can be used to create more compelling sales collateral and resources. With the insights gained from intent data, sales teams can identify the themes that are most important to their target buyers. This information can then be used to develop engaging and relevant content that effectively addresses the needs of your audience.

Furthermore, intent data can shed light on the preferred formats and channels for content consumption. With this knowledge, sales teams can create resources that not only resonate with the target audience but are also delivered via the channels they’re most comfortable with.

When you enable your sales team with intent data, the space you can dominate is boundless. [Image via ChattGPT]

In the fast-paced, highly competitive world of B2B sales, buyer-level intent data provides the edge you need. The trail of useful data that your prospective buyers leave behind is waiting to be explored—don’t miss out on the insights it holds.

Categories B2B

How to Use Excel Like a Pro: 29 Easy Excel Tips, Tricks, & Shortcuts

Sometimes, Excel seems too good to be true. All I have to do is enter a formula, and pretty much anything I’d ever need to do manually can be done automatically.

Need to merge two sheets with similar data? Excel can do it.

Need to do simple math? Excel can do it.

Need to combine information in multiple cells? Excel can do it.

In this post, I’ll go over the best tips, tricks, and shortcuts you can use right now to take your Excel game to the next level. No advanced Excel knowledge required.

Download 10 Excel Templates for Marketers [Free Kit]

What is Excel?

Microsoft Excel is powerful data visualization and analysis software, which uses spreadsheets to store, organize, and track data sets with formulas and functions. Excel is used by marketers, accountants, data analysts, and other professionals. It’s part of the Microsoft Office suite of products. Alternatives include Google Sheets and Numbers.

Find more Excel alternatives here.

Excel is primarily used for creating financial documents because of its strong computational powers. You’ll often find the software in accounting offices and teams because it allows accountants to automatically see sums, averages, and totals. With Excel, they can easily make sense of their business’ data.

While Excel is primarily known as an accounting tool, professionals in any field can use its features and formulas — especially marketers — because it can be used for tracking any type of data. It removes the need to spend hours and hours counting cells or copying and pasting performance numbers. Excel typically has a shortcut or quick fix that speeds up the process.

You can also download Excel templates below for all of your marketing needs.

After you download the templates, it’s time to start using the software. Let’s cover the basics first.

Excel Basics

If you’re just starting out with Excel, there are a few basic commands that we suggest you become familiar with. These are things like:

  • Creating a new spreadsheet from scratch.
  • Executing basic computations like adding, subtracting, multiplying, and dividing.
  • Writing and formatting column text and titles.
  • Using Excel’s auto-fill features.
  • Adding or deleting single columns, rows, and spreadsheets. (Below, we’ll get into how to add things like multiple columns and rows.)
  • Keeping column and row titles visible as you scroll past them in a spreadsheet, so that you know what data you’re filling as you move further down the document.
  • Sorting your data in alphabetical order.

Let’s explore a few of these more in-depth.

For instance, why does auto-fill matter?

If you have any basic Excel knowledge, it’s likely you already know this quick trick. But to cover our bases, allow me to show you the glory of autofill. This lets you quickly fill adjacent cells with several types of data, including values, series, and formulas.

There are multiple ways to deploy this feature, but the fill handle is among the easiest. Select the cells you want to be the source, locate the fill handle in the lower-right corner of the cell, and either drag the fill handle to cover cells you want to fill or just double click:
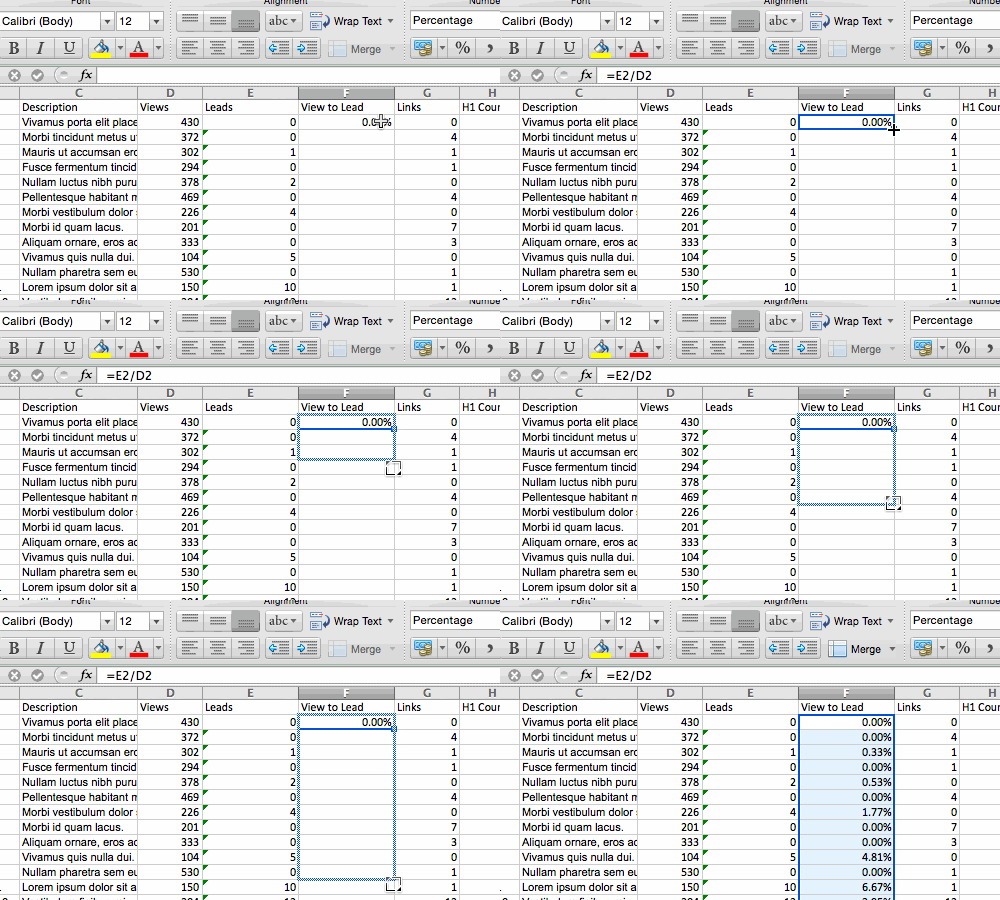
excel autofillSimilarly, sorting is an important feature you’ll want to know when organizing your data in Excel.

Sometimes you may have a list of data that has no organization whatsoever. Maybe you exported a list of your marketing contacts or blog posts. Whatever the case may be, Excel’s sort feature will help you alphabetize any list.

Click on the data in the column you want to sort. Then click on the “Data” tab in your toolbar and look for the “Sort” option on the left. If the “A” is on top of the “Z,” you can just click on that button once. If the “Z” is on top of the “A,” click on the button twice. When the “A” is on top of the “Z,” that means your list will be sorted in alphabetical order. However, when the “Z” is on top of the “A,” that means your list will be sorted in reverse alphabetical order.

Let’s explore more of the basics of Excel (along with advanced features) next.

How to Use Excel

To use Excel, you only need to input the data into the rows and columns. And then you’ll use formulas and functions to turn that data into insights.

We‘re going to go over the best formulas and functions you need to know. But first, let’s take a look at the types of documents you can create using the software. That way, you have an overarching understanding of how you can use Excel in your day-to-day.

Documents You Can Create in Excel

Not sure how you can actually use Excel in your team? Here is a list of documents you can create:

  • Income Statements: You can use an Excel spreadsheet to track a company’s sales activity and financial health.
  • Balance Sheets: Balance sheets are among the most common types of documents you can create with Excel. It allows you to get a holistic view of a company’s financial standing.
  • Calendar: You can easily create a spreadsheet monthly calendar to track events or other date-sensitive information.

Here are some documents you can create specifically for marketers.

This is only a small sampling of the types of marketing and business documents you can create in Excel. We’ve created an extensive list of Excel templates you can use right now for marketing, invoicing, project management, budgeting, and more.

In the spirit of working more efficiently and avoiding tedious, manual work, here are a few Excel formulas and functions you’ll need to know.

Excel Formulas

It’s easy to get overwhelmed by the wide range of Excel formulas that you can use to make sense out of your data. If you’re just getting started using Excel, you can rely on the following formulas to carry out some complex functions — without adding to the complexity of your learning path.

  • Equal sign: Before creating any formula, you’ll need to write an equal sign (=) in the cell where you want the result to appear.
  • Addition: To add the values of two or more cells, use the + sign. Example: =C5+D3.
  • Subtraction: To subtract the values of two or more cells, use the sign. Example: =C5-D3.
  • Multiplication: To multiply the values of two or more cells, use the * sign. Example: =C5*D3.
  • Division: To divide the values of two or more cells, use the / sign. Example: =C5/D3.

Putting all of these together, you can create a formula that adds, subtracts, multiplies, and divides all in one cell. Example: =(C5-D3)/((A5+B6)*3).

For more complex formulas, you’ll need to use parentheses around the expressions to avoid accidentally using the PEMDAS order of operations. Keep in mind that you can use plain numbers in your formulas.

Excel Functions

Excel functions automate some of the tasks you would use in a typical formula. For instance, instead of using the + sign to add up a range of cells, you’d use the SUM function. Let’s look at a few more functions that will help automate calculations and tasks.

  • SUM: The SUM function automatically adds up a range of cells or numbers. To complete a sum, you would input the starting cell and the final cell with a colon in between. Here’s what that looks like: SUM(Cell1:Cell2). Example: =SUM(C5:C30).
  • AVERAGE: The AVERAGE function averages out the values of a range of cells. The syntax is the same as the SUM function: AVERAGE(Cell1:Cell2). Example: =AVERAGE(C5:C30).
  • IF: The IF function allows you to return values based on a logical test. The syntax is as follows: IF(logical_test, value_if_true, [value_if_false]). Example: =IF(A2>B2,“Over Budget”,“OK”).
  • VLOOKUP: The VLOOKUP function helps you search for anything on your sheet’s rows. The syntax is: VLOOKUP(lookup value, table array, column number, Approximate match (TRUE) or Exact match (FALSE)). Example: =VLOOKUP([@Attorney],tbl_Attorneys,4,FALSE).
  • INDEX: The INDEX function returns a value from within a range. The syntax is as follows: INDEX(array, row_num, [column_num]).
  • MATCH: The MATCH function looks for a certain item in a range of cells and returns the position of that item. It can be used in tandem with the INDEX function. The syntax is: MATCH(lookup_value, lookup_array, [match_type]).
  • COUNTIF: The COUNTIF function returns the number of cells that meet a certain criteria or have a certain value. The syntax is: COUNTIF(range, criteria). Example: =COUNTIF(A2:A5,“London”).

Okay, ready to get into the nitty-gritty? Let‘s get to it. (And to all the Harry Potter fans out there … you’re welcome in advance.)

Note: Some of the GIFs and visuals are from a previous version of Excel. When applicable, the copy has been updated to provide instruction for users of both newer and older Excel versions.

1. Use Pivot tables to recognize and make sense of data.

Pivot tables are used to reorganize data in a spreadsheet. They won‘t change the data that you have, but they can sum up values and compare different information in your spreadsheet, depending on what you’d like them to do.

Let‘s take a look at an example. Let’s say I want to take a look at how many people are in each house at Hogwarts. You may be thinking that I don’t have too much data, but for longer data sets, this will come in handy.

To create the Pivot Table, I go to Data > Pivot Table. If you’re using the most recent version of Excel, you’d go to Insert > Pivot Table. Excel will automatically populate your Pivot Table, but you can always change around the order of the data. Then, you have four options to choose from.

  • Report Filter: This allows you to only look at certain rows in your dataset. For example, if I wanted to create a filter by house, I could choose to only include students in Gryffindor instead of all students.
  • Column Labels: These would be your headers in the dataset.
  • Row Labels: These could be your rows in the dataset. Both Row and Column labels can contain data from your columns (e.g. First Name can be dragged to either the Row or Column label — it just depends on how you want to see the data.)
  • Value: This section allows you to look at your data differently. Instead of just pulling in any numeric value, you can sum, count, average, max, min, count numbers, or do a few other manipulations with your data. In fact, by default, when you drag a field to Value, it always does a count.

Since I want to count the number of students in each house, I’ll go to the Pivot table builder and drag the House column to both the Row Labels and the Values. This will sum up the number of students associated with each house.
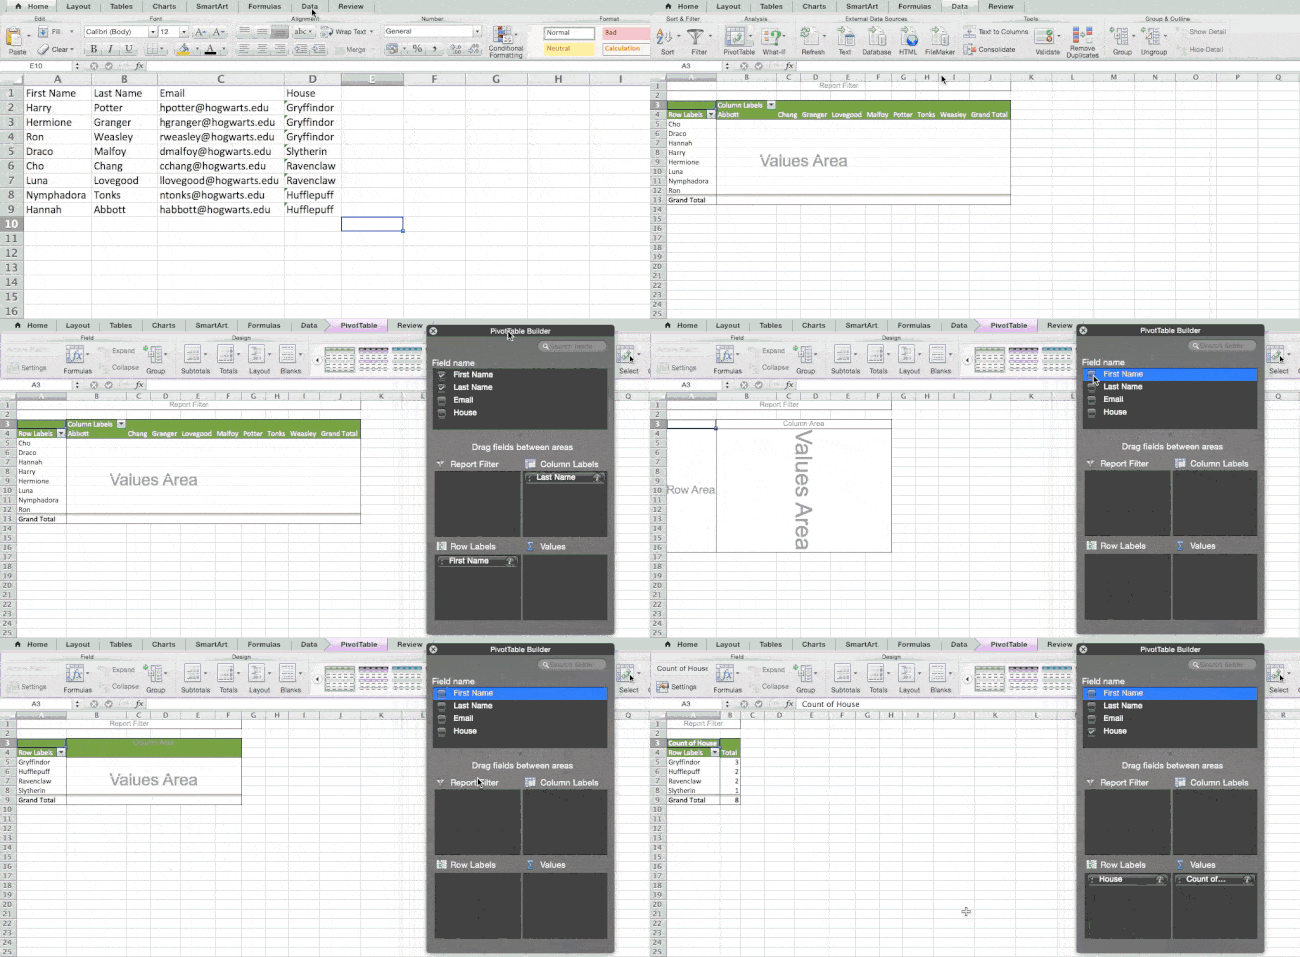
excel pivot table creation

2. Add more than one row or column.

As you play around with your data, you might find you‘re constantly needing to add more rows and columns. Sometimes, you may even need to add hundreds of rows. Doing this one-by-one would be super tedious. Luckily, there’s always an easier way.

To add multiple rows or columns in a spreadsheet, highlight the same number of preexisting rows or columns that you want to add. Then, right-click and select “Insert.”

In the example below, I want to add an additional three rows. By highlighting three rows and then clicking insert, I’m able to add an additional three blank rows into my spreadsheet quickly and easily.
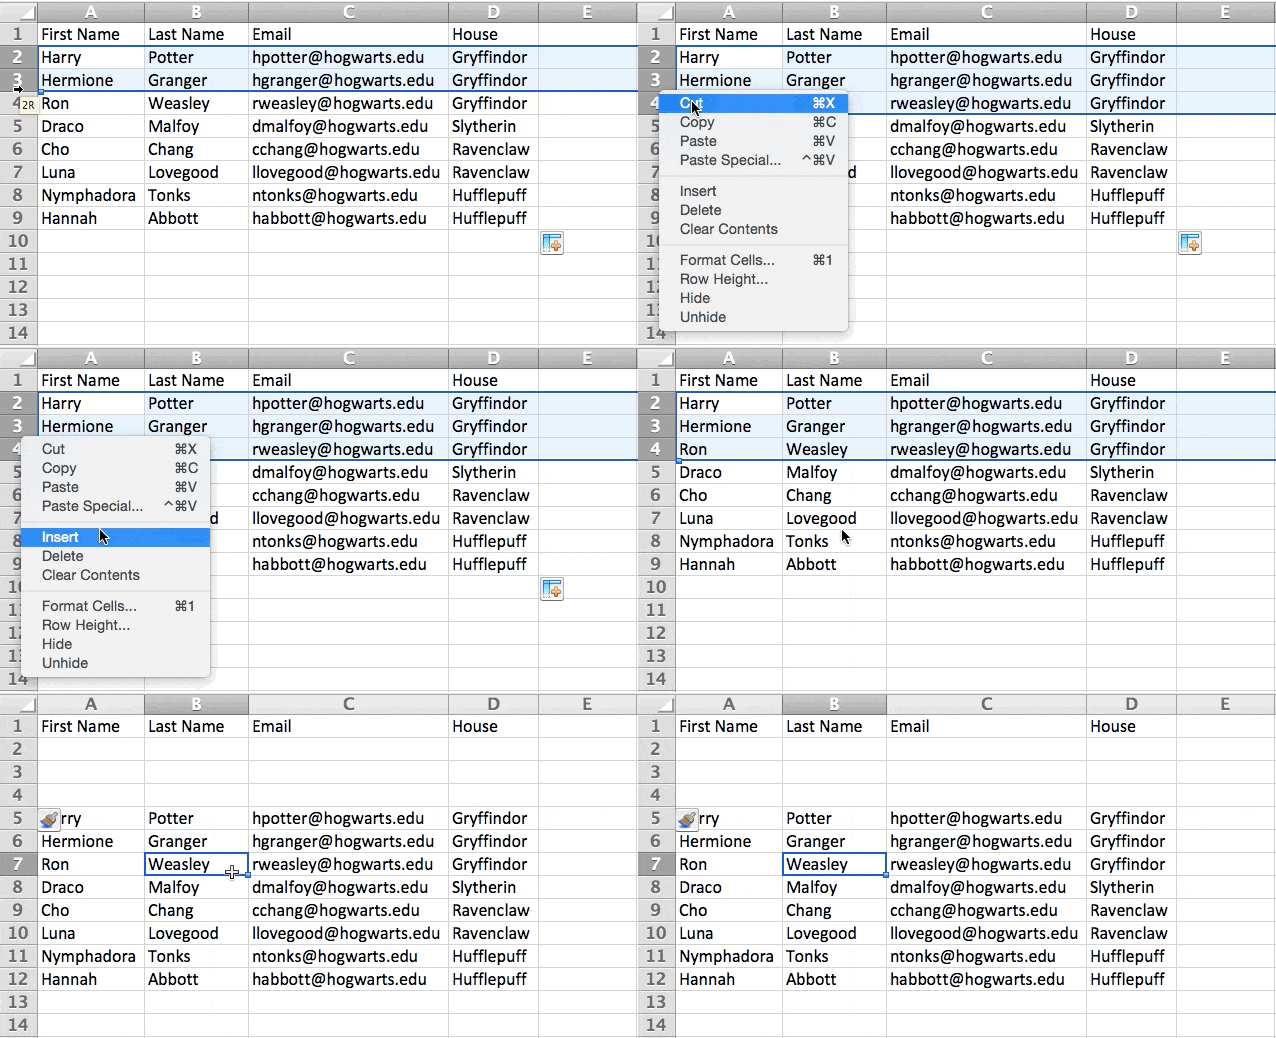
excel insert spaces

3. Use filters to simplify your data.

When you‘re looking at very large data sets, you don’t usually need to be looking at every single row at the same time. Sometimes, you only want to look at data that fit into certain criteria.

That’s where filters come in.

Filters allow you to pare down your data to only look at certain rows at one time. In Excel, a filter can be added to each column in your data — and from there, you can then choose which cells you want to view at once.

Let‘s take a look at the example below. Add a filter by clicking the Data tab and selecting “Filter.” Clicking the arrow next to the column headers and you’ll be able to choose whether you want your data to be organized in ascending or descending order, as well as which specific rows you want to show.

In my Harry Potter example, let’s say I only want to see the students in Gryffindor. By selecting the Gryffindor filter, the other rows disappear.
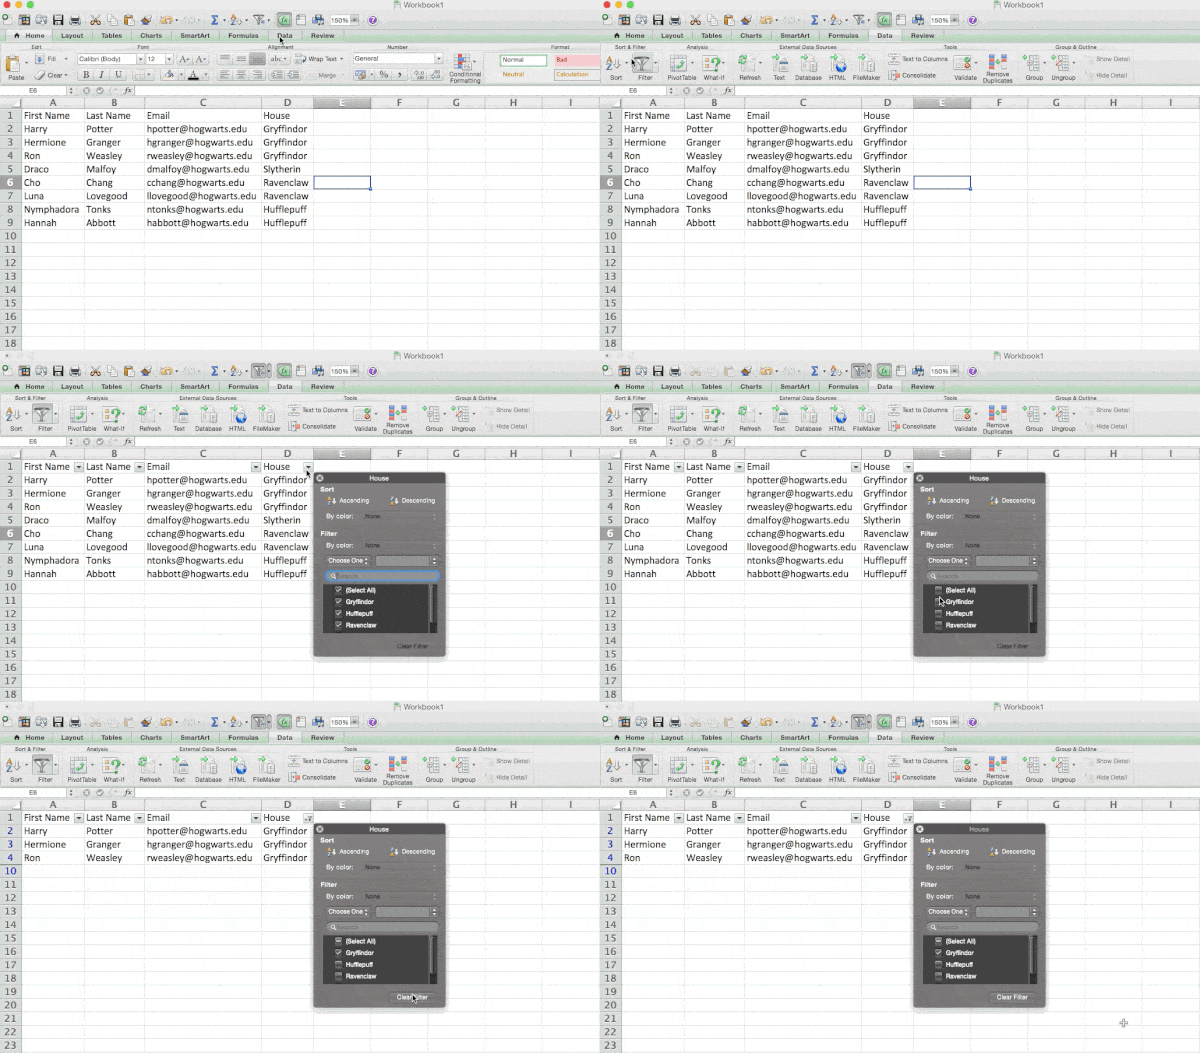
excel filtersPro Tip: Copy and paste the values in the spreadsheet when a Filter is on to do additional analysis in another spreadsheet.

4. Remove duplicate data points or sets.

Larger data sets tend to have duplicate content. You may have a list of multiple contacts in a company and only want to see the number of companies you have. In situations like this, removing the duplicates comes in quite handy.

To remove your duplicates, highlight the row or column that you want to remove duplicates of. Then, go to the Data tab and select “Remove Duplicates” (which is under the Tools subheader in the older version of Excel). A pop-up will appear to confirm which data you want to work with. Select “Remove Duplicates,” and you’re good to go.
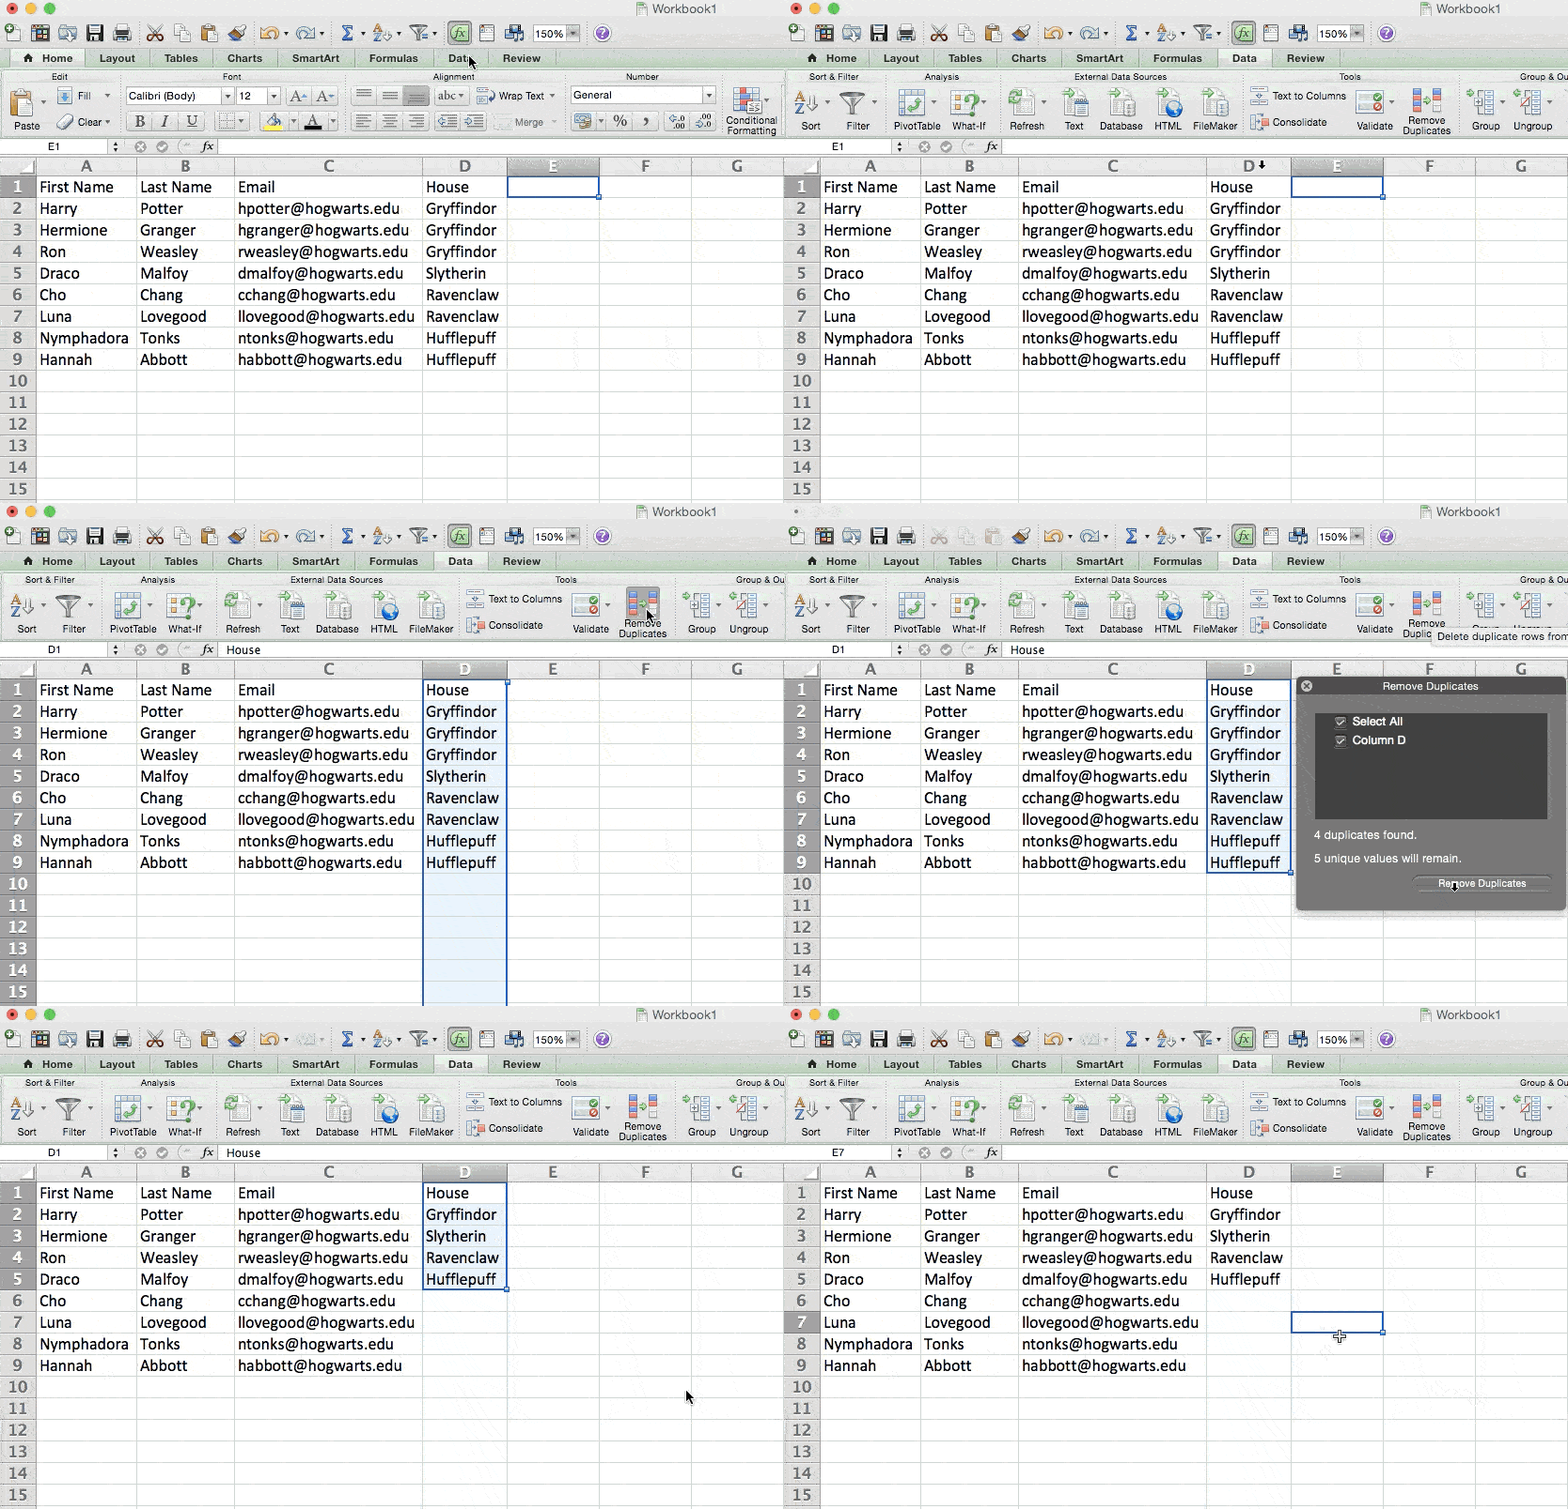
excel duplicates removal

You can also use this feature to remove an entire row based on a duplicate column value. So if you have three rows with Harry Potter’s information and you only need to see one, then you can select the whole dataset and then remove duplicates based on email. Your resulting list will have only unique names without any duplicates.

5. Transpose rows into columns.

When you have rows of data in your spreadsheet, you might decide you actually want to transform the items in one of those rows into columns (or vice versa). It would take a lot of time to copy and paste each individual header — but what the transpose feature allows you to do is simply move your row data into columns, or the other way around.

Start by highlighting the column that you want to transpose into rows. Right-click it, and then select “Copy.” Next, select the cells on your spreadsheet where you want your first row or column to begin. Right-click on the cell, and then select “Paste Special.” A module will appear — at the bottom, you’ll see an option to transpose. Check that box and select OK. Your column will now be transferred to a row or vice-versa.
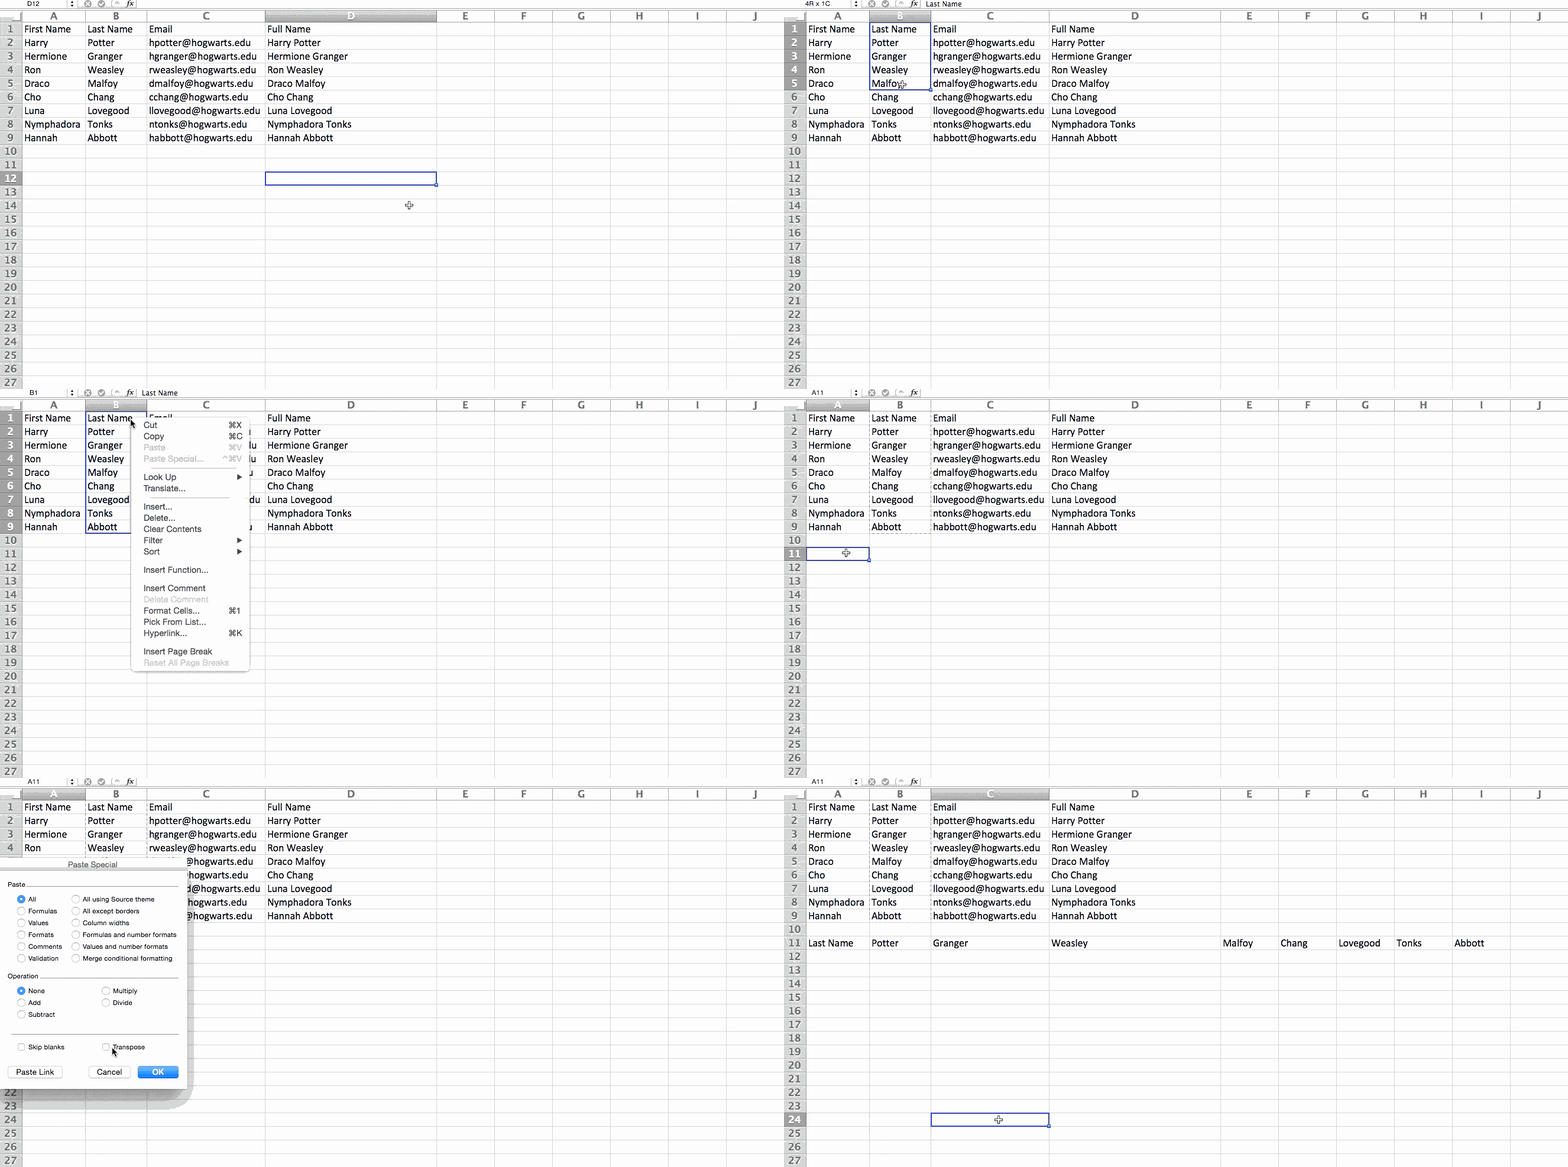
excel transpose

On newer versions of Excel, a drop-down will appear instead of a pop-up.
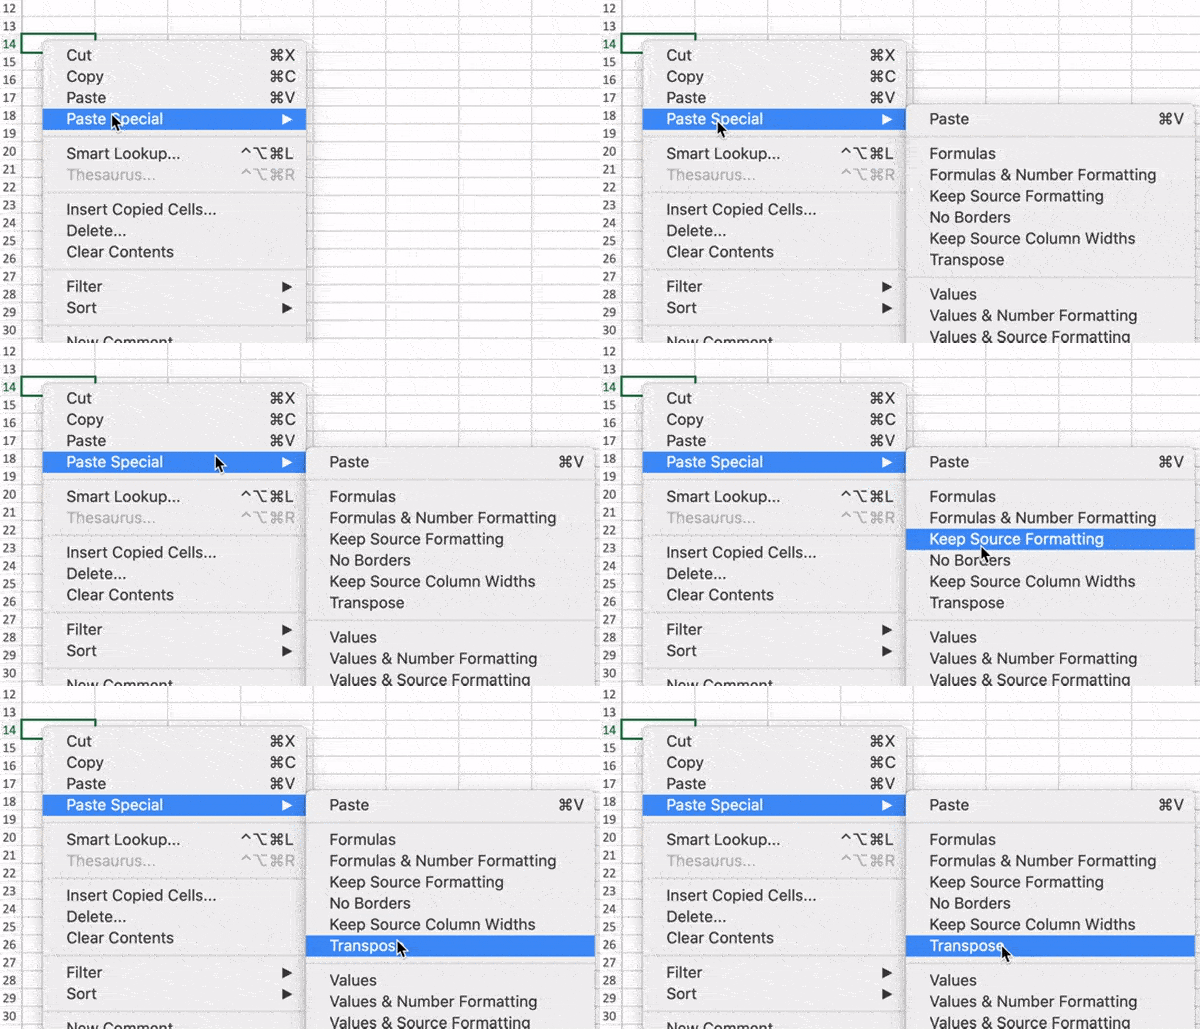
Excel transpose tool in newer versions

6. Split up text information between columns.

What if you want to split out information that‘s in one cell into two different cells? For example, maybe you want to pull out someone’s company name through their email address. Or perhaps you want to separate someone’s full name into a first and last name for your email marketing templates.

Thanks to Excel, both are possible. First, highlight the column that you want to split up. Next, go to the Data tab and select “Text to Columns.” A module will appear with additional information.

First, you need to select either “Delimited” or “Fixed Width.”

  • “Delimited” means you want to break up the column based on characters such as commas, spaces, or tabs.
  • “Fixed Width” means you want to select the exact location on all the columns that you want the split to occur.

In the example case below, let’s select “Delimited” so we can separate the full name into first name and last name.

Then, it‘s time to choose the Delimiters. This could be a tab, semi-colon, comma, space, or something else. (“Something else” could be the “@” sign used in an email address, for example.) In our example, let’s choose the space. Excel will then show you a preview of what your new columns will look like.

When you‘re happy with the preview, press “Next.” This page will allow you to select Advanced Formats if you choose to. When you’re done, click “Finish.”
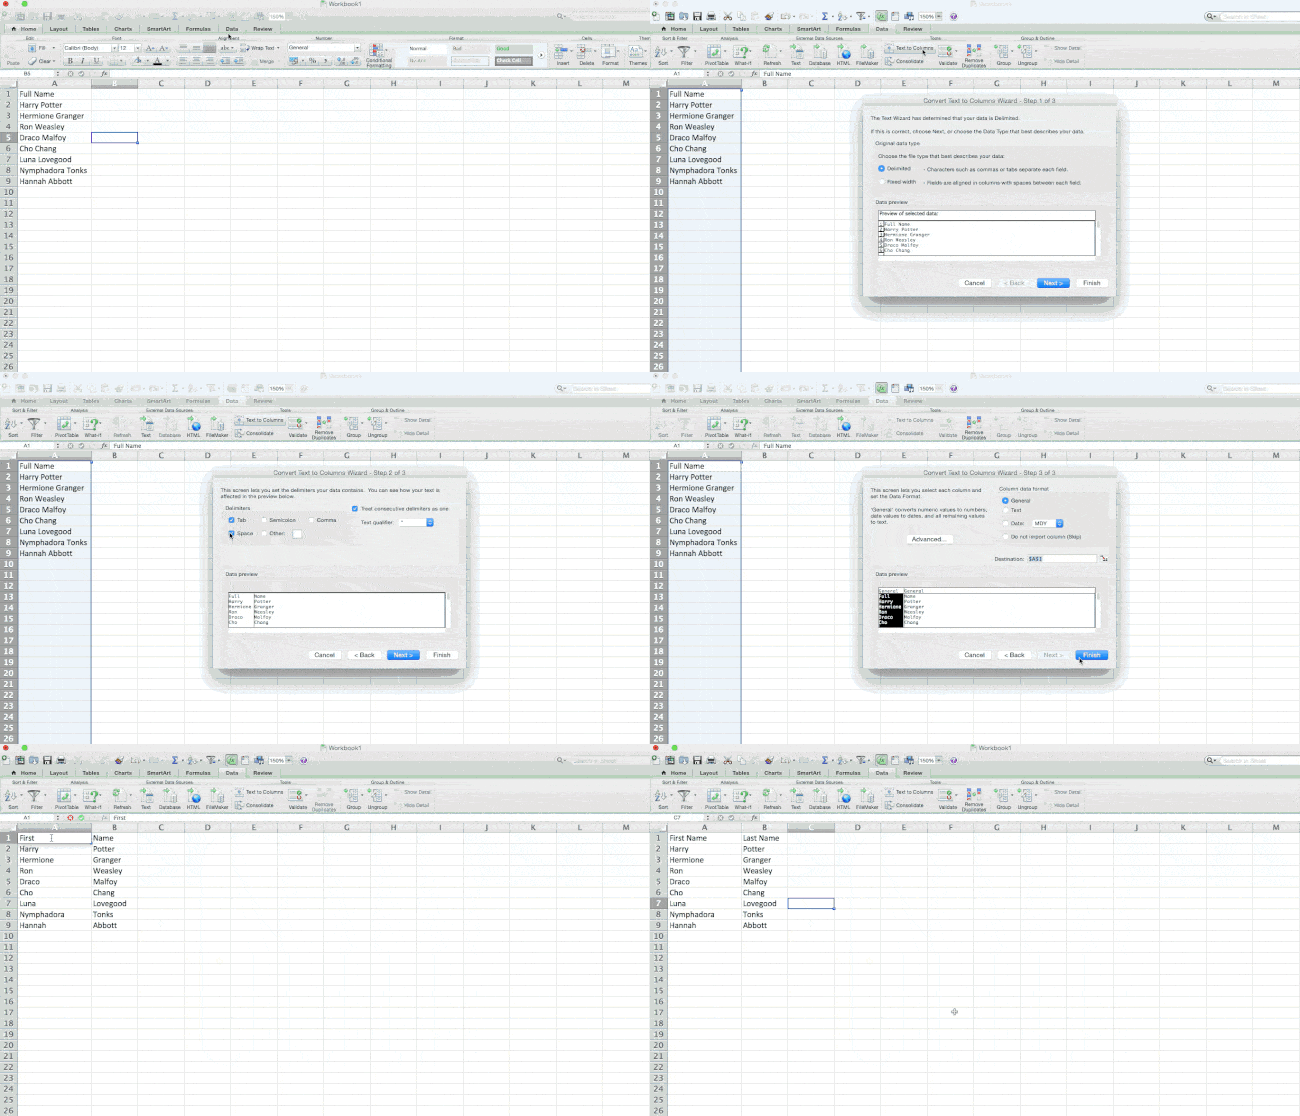
excel text to column

7. Use formulas for simple calculations.

In addition to doing pretty complex calculations, Excel can help you do simple arithmetic like adding, subtracting, multiplying, or dividing any of your data.

  • To add, use the + sign.
  • To subtract, use the – sign.
  • To multiply, use the * sign.
  • To divide, use the / sign.

You can also use parentheses to ensure certain calculations are done first. In the example below (10+10*10), the second and third 10 were multiplied together before adding the additional 10. However, if we made it (10+10)*10, the first and second 10 would be added together first.
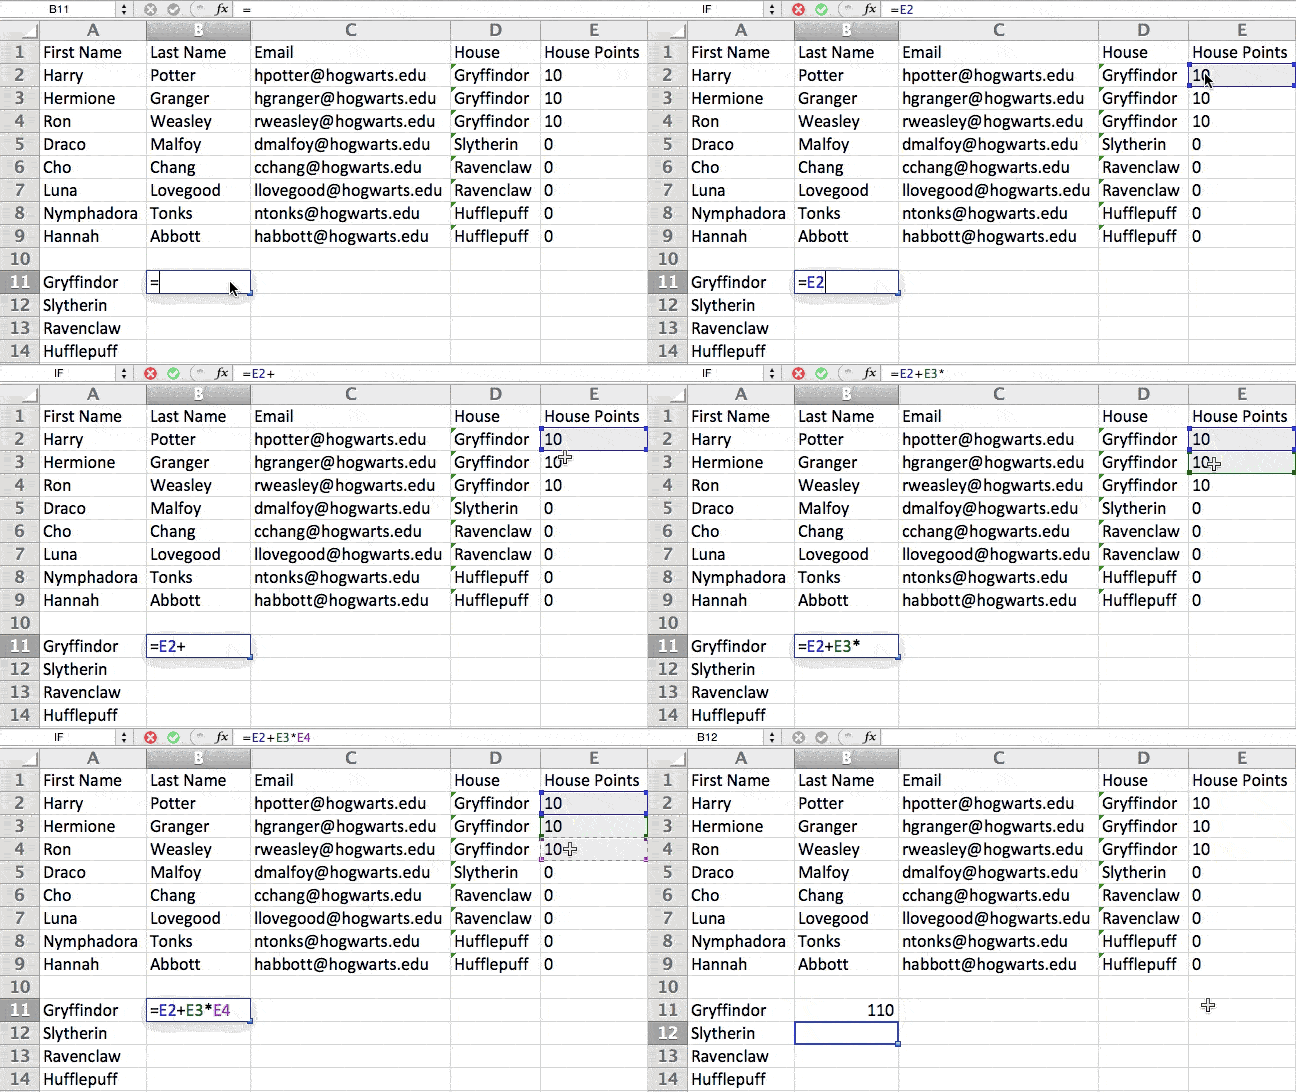
Excel simple formulas in action

8. Get the average of numbers in your cells.

If you want the average of a set of numbers, you can use the formula =AVERAGE(Cell1:Cell2). If you want to sum up a column of numbers, you can use the formula =SUM(Cell1:Cell2).

9. Use conditional formatting to make cells automatically change color based on data.

Conditional formatting allows you to change a cell’s color based on the information within the cell. For example, if you want to flag certain numbers that are above average or in the top 10% of the data in your spreadsheet, you can do that. If you want to color code commonalities between different rows in Excel, you can do that. This will help you quickly see information that is important to you.

To get started, highlight the group of cells you want to use conditional formatting on. Then, choose “Conditional Formatting” from the Home menu and select your logic from the dropdown. (You can also create your own rule if you want something different.) A window will pop up that prompts you to provide more information about your formatting rule. Select “OK” when you’re done, and you should see your results automatically appear.
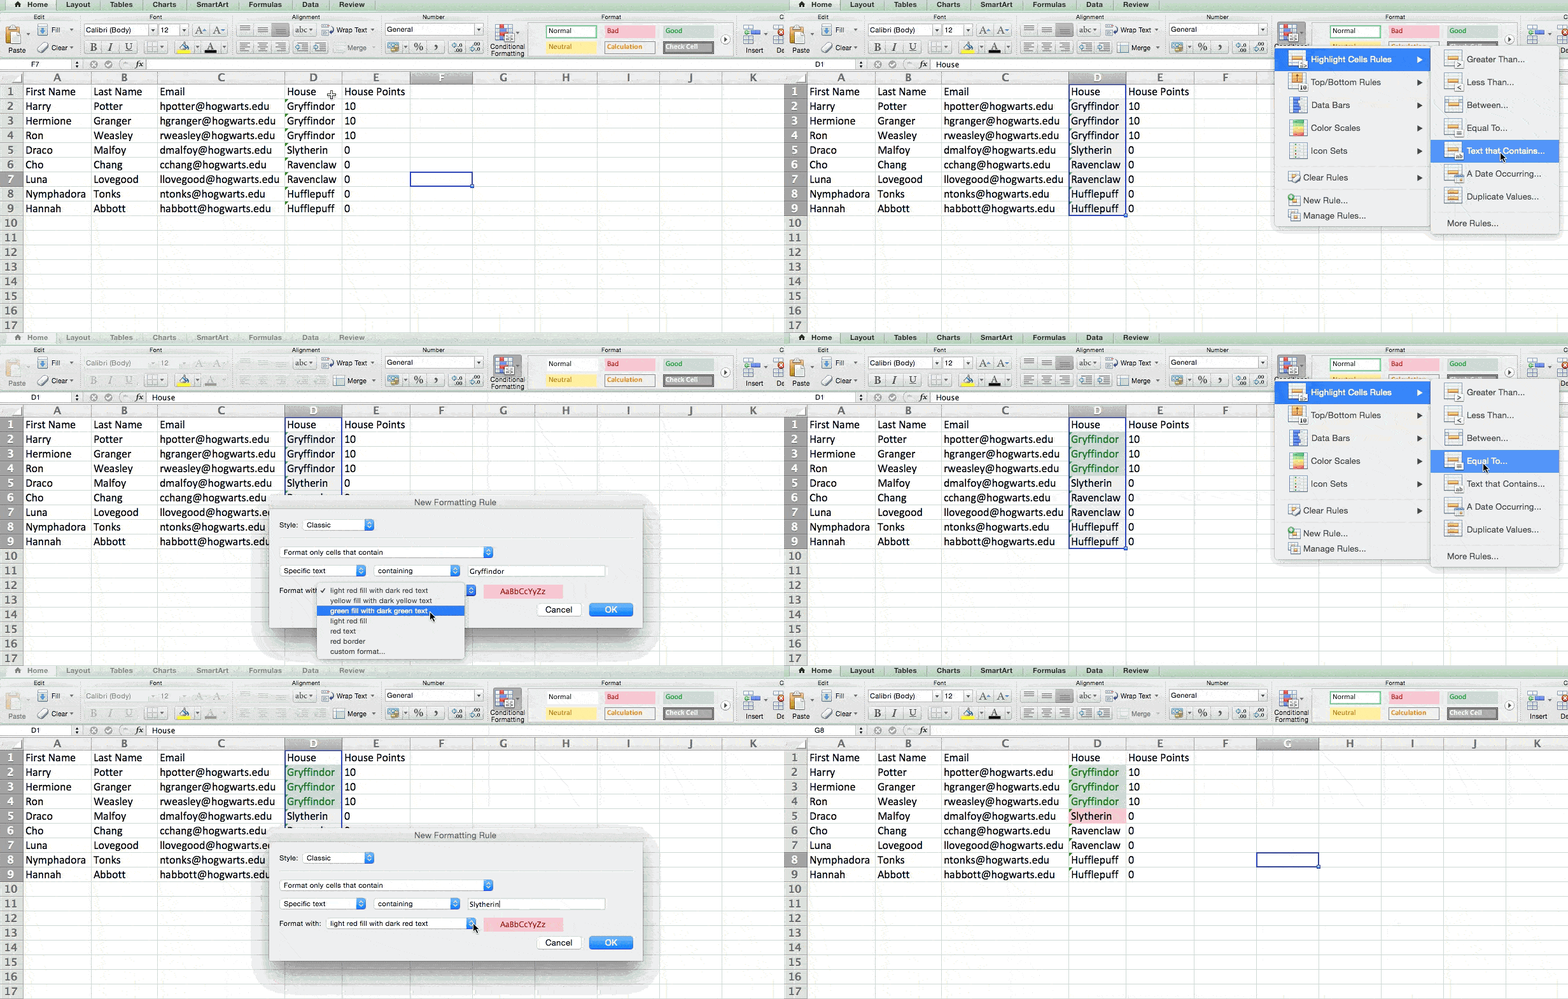
Excel conditional formatting

10. Use the IF Excel formula to automate certain Excel functions.

Sometimes, we don’t want to count the number of times a value appears. Instead, we want to input different information into a cell if there is a corresponding cell with that information.

For example, in the situation below, I want to award ten points to everyone who belongs in the Gryffindor house. Instead of manually typing in 10‘s next to each Gryffindor student’s name, I can use the IF Excel formula to say that if the student is in Gryffindor, then they should get ten points.

The formula is: IF(logical_test, value_if_true, [value_if_false])

Example Shown Below: =IF(D2=“Gryffindor”,“10”,“0”)

In general terms, the formula would be IF(Logical Test, value of true, value of false). Let’s dig into each of these variables.

  • Logical_Test: The logical test is the “IF” part of the statement. In this case, the logic is D2=“Gryffindor” because we want to make sure that the cell corresponding with the student says “Gryffindor.” Make sure to put Gryffindor in quotation marks here.
  • Value_if_True: This is what we want the cell to show if the value is true. In this case, we want the cell to show “10” to indicate that the student was awarded the 10 points. Only use quotation marks if you want the result to be text instead of a number.
  • Value_if_False: This is what we want the cell to show if the value is false. In this case, for any student not in Gryffindor, we want the cell to show “0”. Only use quotation marks if you want the result to be text instead of a number.
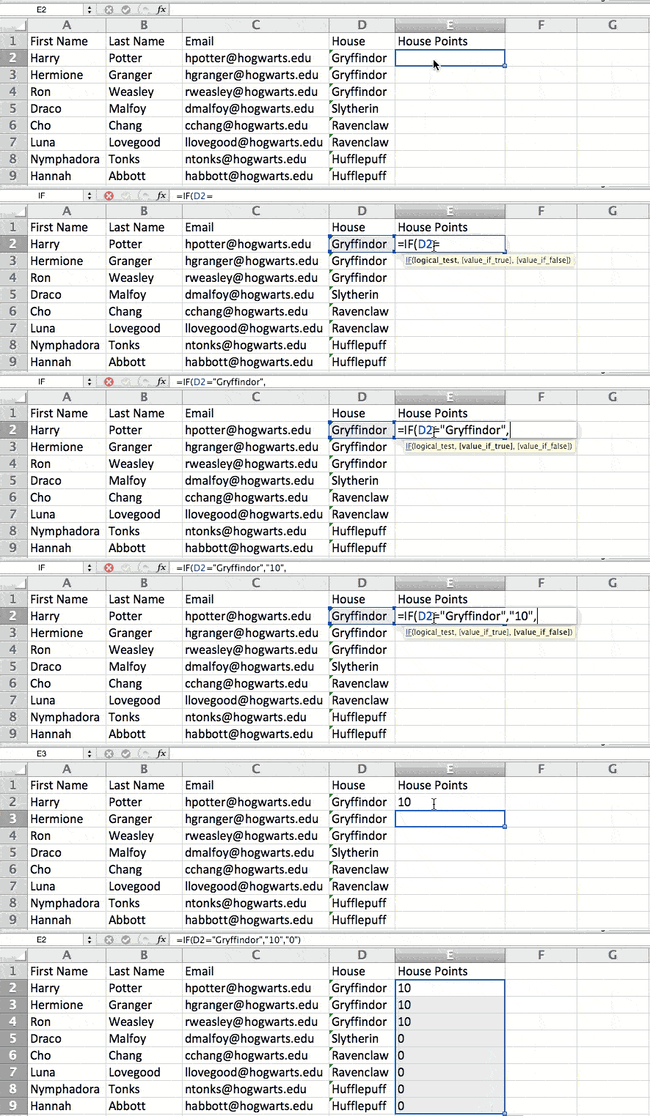
Excel IF formula in action

Note: In the example above, I awarded 10 points to everyone in Gryffindor. If I later wanted to sum the total number of points, I wouldn‘t be able to because the 10’s are in quotes, thus making them text and not a number that Excel can sum.

The real power of the IF function comes when you string multiple IF statements together, or nest them. This allows you to set multiple conditions, get more specific results, and ultimately organize your data into more manageable chunks.

Ranges are one way to segment your data for better analysis. For example, you can categorize data into values that are less than 10, 11 to 50, or 51 to 100. Here’s how that looks in practice:

=IF(B3<11,“10 or less”,IF(B3<51,“11 to 50”,IF(B3<100,“51 to 100”)))

It can take some trial-and-error, but once you have the hang of it, IF formulas will become your new Excel best friend.

11. Use dollar signs to keep one cell’s formula the same regardless of where it moves.

Have you ever seen a dollar sign in an Excel formula? When used in a formula, it isn’t representing an American dollar; instead, it makes sure that the exact column and row are held the same even if you copy the same formula in adjacent rows.

You see, a cell reference — when you refer to cell A5 from cell C5, for example — is relative by default. In that case, you‘re actually referring to a cell that’s five columns to the left (C minus A) and in the same row (5). This is called a relative formula. When you copy a relative formula from one cell to another, it‘ll adjust the values in the formula based on where it’s moved. But sometimes, we want those values to stay the same no matter whether they’re moved around or not — and we can do that by turning the formula into an absolute formula.

To change the relative formula (=A5+C5) into an absolute formula, we’d precede the row and column values by dollar signs, like this: (=$A$5+$C$5). (Learn more on Microsoft Office’s support page here.)

12. Use the VLOOKUP function to pull data from one area of a sheet to another.

Have you ever had two sets of data on two different spreadsheets that you want to combine into a single spreadsheet?

For example, you might have a list of people‘s names next to their email addresses in one spreadsheet, and a list of those same people’s email addresses next to their company names in the other — but you want the names, email addresses, and company names of those people to appear in one place.

I have to combine data sets like this a lot — and when I do, the VLOOKUP is my go-to formula.

Before you use the formula, though, be absolutely sure that you have at least one column that appears identically in both places. Scour your data sets to make sure the column of data you’re using to combine your information is exactly the same, including no extra spaces.

The formula: =VLOOKUP(lookup value, table array, column number, Approximate match (TRUE) or Exact match (FALSE))

The formula with variables from our example below: =VLOOKUP(C2,Sheet2!A:B,2,FALSE)

In this formula, there are several variables. The following is true when you want to combine information in Sheet 1 and Sheet 2 onto Sheet 1.

  • Lookup Value: This is the identical value you have in both spreadsheets. Choose the first value in your first spreadsheet. In the example that follows, this means the first email address on the list, or cell 2 (C2).
  • Table Array: The table array is the range of columns on Sheet 2 you‘re going to pull your data from, including the column of data identical to your lookup value (in our example, email addresses) in Sheet 1 as well as the column of data you’re trying to copy to Sheet 1. In our example, this is “Sheet2!A:B.” “A” means Column A in Sheet 2, which is the column in Sheet 2 where the data identical to our lookup value (email) in Sheet 1 is listed. The “B” means Column B, which contains the information that’s only available in Sheet 2 that you want to translate to Sheet 1.
  • Column Number: This tells Excel which column the new data you want to copy to Sheet 1 is located in. In our example, this would be the column that “House” is located in. “House” is the second column in our range of columns (table array), so our column number is 2. [Note: Your range can be more than two columns. For example, if there are three columns on Sheet 2 — Email, Age, and House — and you still want to bring House onto Sheet 1, you can still use a VLOOKUP. You just need to change the “2” to a “3” so it pulls back the value in the third column: =VLOOKUP(C2:Sheet2!A:C,3,false).]
  • Approximate Match (TRUE) or Exact Match (FALSE): Use FALSE to ensure you pull in only exact value matches. If you use TRUE, the function will pull in approximate matches.

In the example below, Sheet 1 and Sheet 2 contain lists describing different information about the same people, and the common thread between the two is their email addresses. Let’s say we want to combine both datasets so that all the house information from Sheet 2 translates over to Sheet 1.
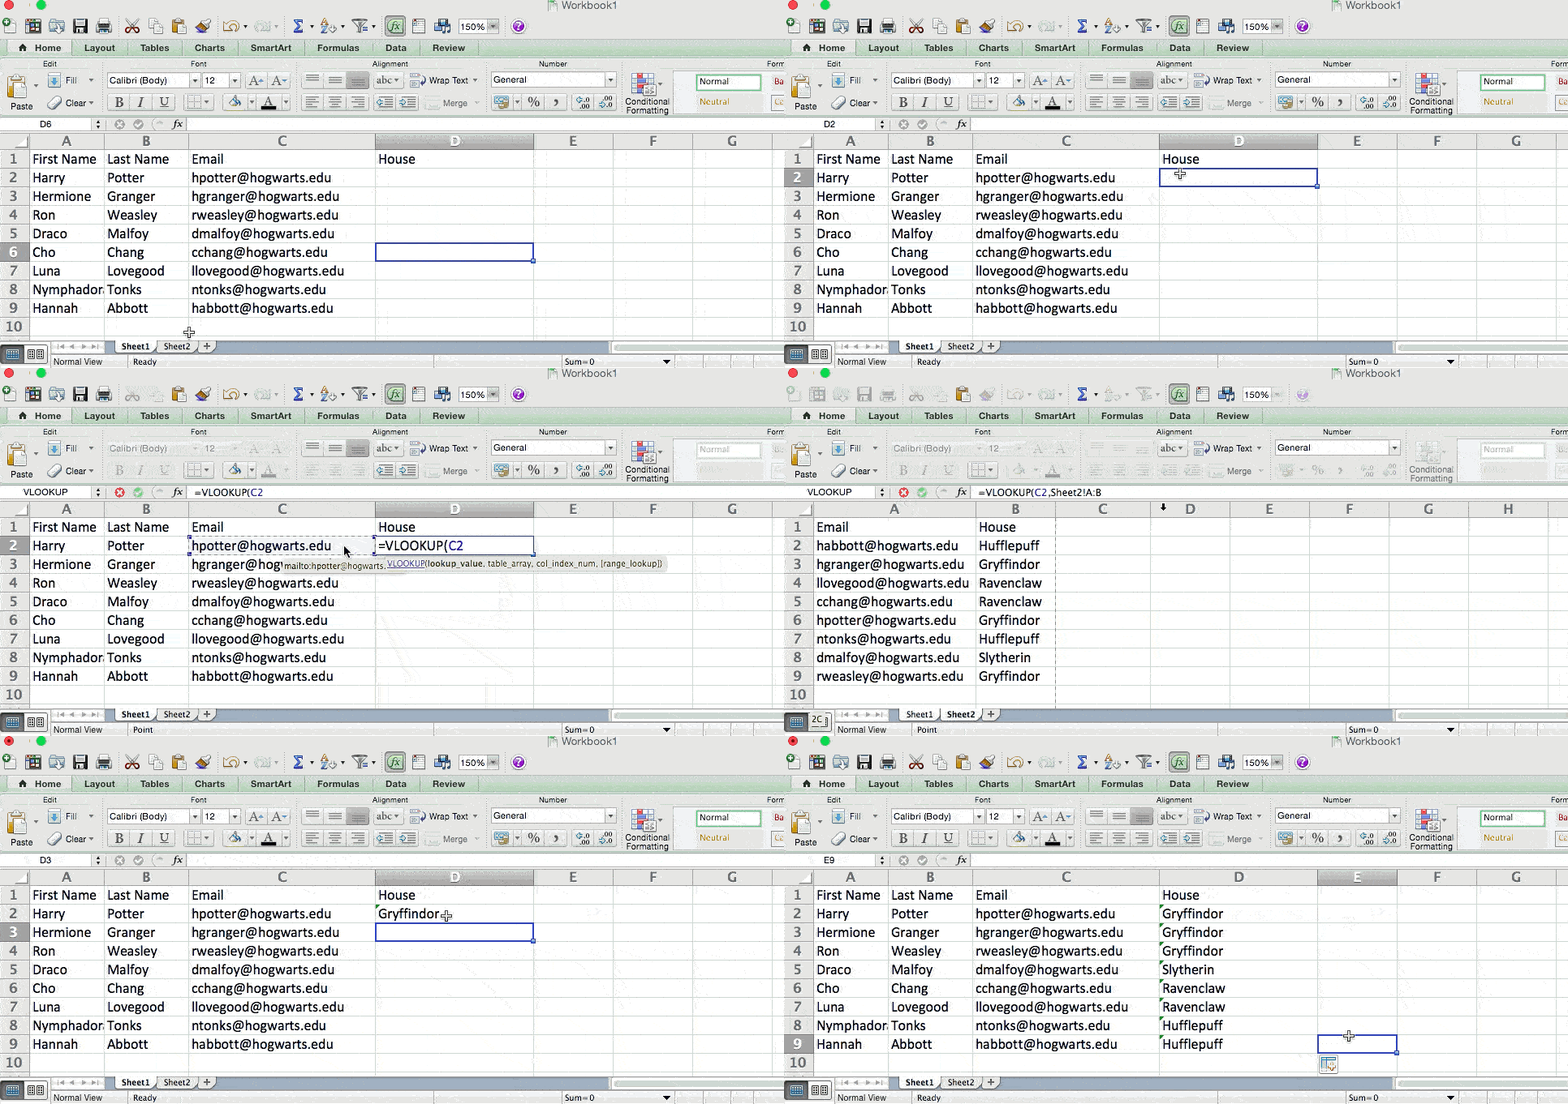
Excel VLOOKUP function

So when we type in the formula =VLOOKUP(C2,Sheet2!A:B,2,FALSE), we bring all the house data into Sheet 1.

Keep in mind that VLOOKUP will only pull back values from the second sheet that are to the right of the column containing your identical data. This can lead to some limitations, which is why some people prefer to use the INDEX and MATCH functions instead.

13. Use INDEX and MATCH formulas to pull data from horizontal columns.

Like VLOOKUP, the INDEX and MATCH functions pull in data from another dataset into one central location. Here are the main differences:

  • VLOOKUP is a much simpler formula. If you’re working with large data sets that would require thousands of lookups, using the INDEX and MATCH function will significantly decrease load time in Excel.
  • The INDEX and MATCH formulas work right-to-left, whereas VLOOKUP formulas only work as a left-to-right lookup. In other words, if you need to do a lookup that has a lookup column to the right of the results column, then you’d have to rearrange those columns in order to do a VLOOKUP. This can be tedious with large datasets and/or lead to errors.

So if I want to combine information in Sheet 1 and Sheet 2 onto Sheet 1, but the column values in Sheets 1 and 2 aren‘t the same, then to do a VLOOKUP, I would need to switch around my columns. In this case, I’d choose to do an INDEX and MATCH instead.

Let‘s look at an example. Let’s say Sheet 1 contains a list of people‘s names and their Hogwarts email addresses, and Sheet 2 contains a list of people’s email addresses and the Patronus that each student has. (For the non-Harry Potter fans out there, every witch or wizard has an animal guardian called a “Patronus” associated with him or her.) The information that lives in both sheets is the column containing email addresses, but this email address column is in different column numbers on each sheet. I‘d use the INDEX and MATCH formulas instead of VLOOKUP so I wouldn’t have to switch any columns around.

So what‘s the formula, then? The formula is actually the MATCH formula nested inside the INDEX formula. You’ll see I differentiated the MATCH formula using a different color here.

The formula: =INDEX(table array, MATCH formula)

This becomes: =INDEX(table array, MATCH (lookup_value, lookup_array))

The formula with variables from our example below: =INDEX(Sheet2!A:A,(MATCH(Sheet1!C:C,Sheet2!C:C,0)))

Here are the variables:

  • Table Array: The range of columns on Sheet 2 containing the new data you want to bring over to Sheet 1. In our example, “A” means Column A, which contains the “Patronus” information for each person.
  • Lookup Value: This is the column in Sheet 1 that contains identical values in both spreadsheets. In the example that follows, this means the “email” column on Sheet 1, which is Column C. So: Sheet1!C:C.
  • Lookup Array: This is the column in Sheet 2 that contains identical values in both spreadsheets. In the example that follows, this refers to the “email” column on Sheet 2, which happens to also be Column C. So: Sheet2!C:C.

Once you have your variables straight, type in the INDEX and MATCH formulas in the top-most cell of the blank Patronus column on Sheet 1, where you want the combined information to live.
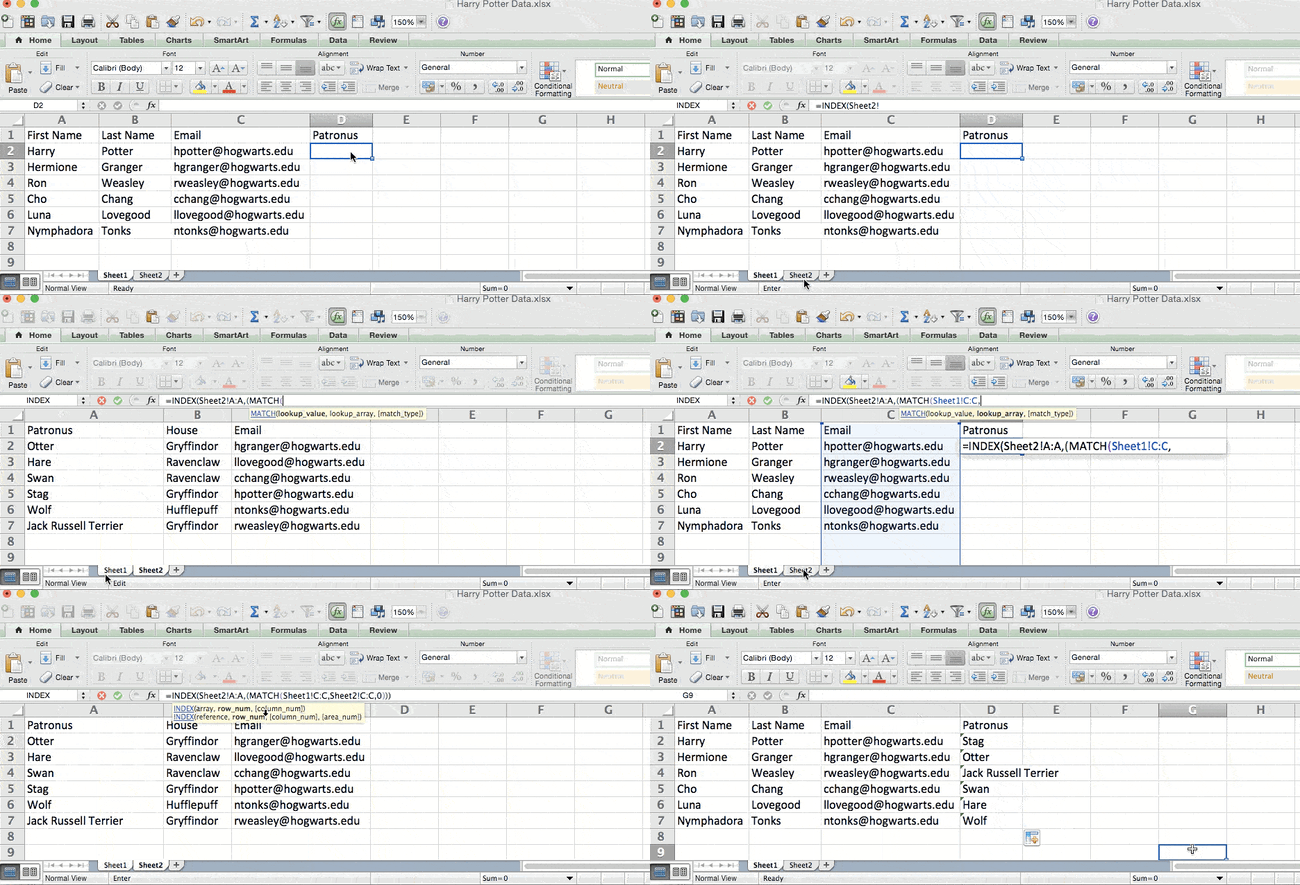
Excel INDEX and MATCH functions in action

14. Use the COUNTIF function to make Excel count words or numbers in any range of cells.

Instead of manually counting how often a certain value or number appears, let Excel do the work for you. With the COUNTIF function, Excel can count the number of times a word or number appears in any range of cells.

For example, let’s say I want to count the number of times the word “Gryffindor” appears in my data set.

The formula: =COUNTIF(range, criteria)

The formula with variables from our example below: =COUNTIF(D:D,“Gryffindor”)

In this formula, there are several variables:

  • Range: The range that we want the formula to cover. In this case, since we’re only focusing on one column, we use “D:D” to indicate that the first and last column are both D. If I were looking at columns C and D, I would use “C:D.”
  • Criteria: Whatever number or piece of text you want Excel to count. Only use quotation marks if you want the result to be text instead of a number. In our example, the criteria is “Gryffindor.”

Simply typing in the COUNTIF formula in any cell and pressing “Enter” will show me how many times the word “Gryffindor” appears in the dataset.
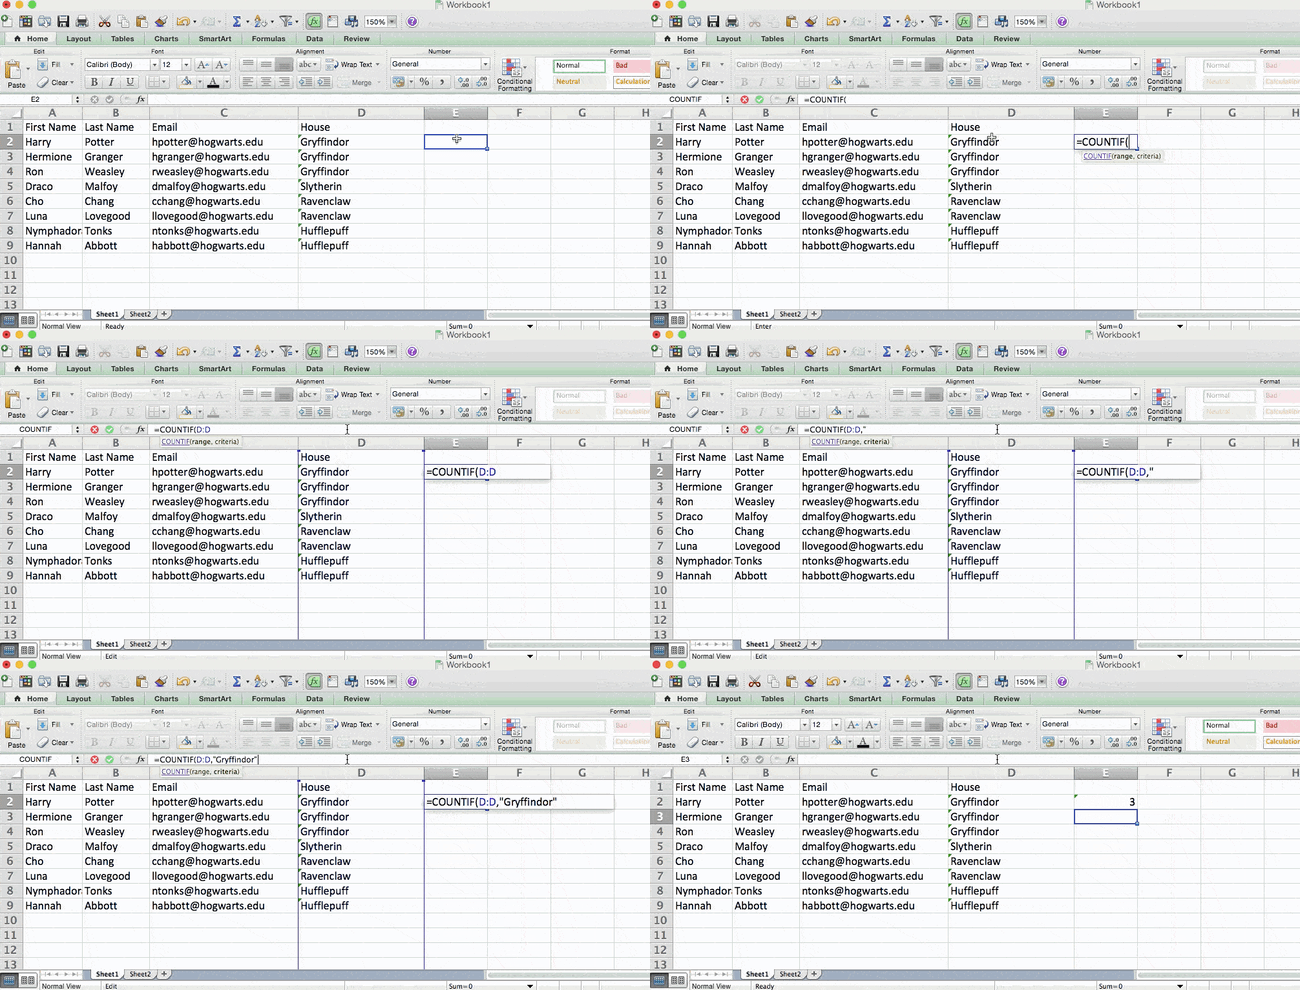
Excel COUNTIF function

15. Combine cells using &.

Databases tend to split out data to make it as exact as possible. For example, instead of having a column that shows a person‘s full name, a database might have the data as a first name and then a last name in separate columns. Or, it may have a person’s location separated by city, state, and zip code. In Excel, you can combine cells with different data into one cell by using the “&” sign in your function.

The formula with variables from our example below: =A2&“ ”&B2

Let‘s go through the formula together using an example. Pretend we want to combine first names and last names into full names in a single column. To do this, we’d first put our cursor in the blank cell where we want the full name to appear. Next, we’d highlight one cell that contains a first name, type in an “&” sign, and then highlight a cell with the corresponding last name.

But you‘re not finished — if all you type in is =A2&B2, then there will not be a space between the person’s first name and last name. To add that necessary space, use the function =A2&“ ”&B2. The quotation marks around the space tell Excel to put a space in between the first and last name.

To make this true for multiple rows, simply drag the corner of that first cell downward as shown in the example.
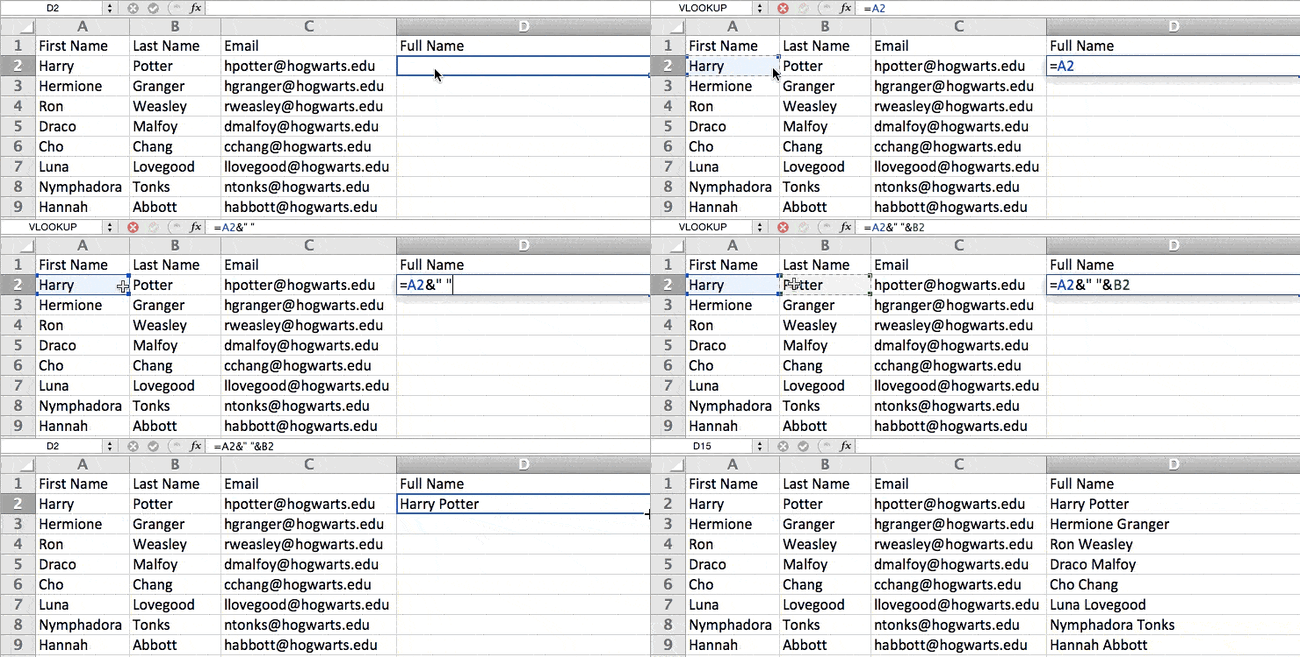
Excel combination of cells

16. Add checkboxes.

If you‘re using an Excel sheet to track customer data and want to oversee something that isn’t quantifiable, you could insert checkboxes into a column.

For example, if you‘re using an Excel sheet to manage your sales prospects and want to track whether you called them in the last quarter, you could have a “Called this quarter?” column and check off the cells in it when you’ve called the respective client.

Here’s how to do it.

Highlight a cell you’d like to add checkboxes to in your spreadsheet. Then, click DEVELOPER. Then, under FORM CONTROLS, click the checkbox or the selection circle highlighted in the image below.
Excel checkboxes

Once the box appears in the cell, copy it, highlight the cells you also want it to appear in, and then paste it.

17. Hyperlink a cell to a website.

If you‘re using your sheet to track social media or website metrics, it can be helpful to have a reference column with the links each row is tracking. If you add a URL directly into Excel, it should automatically be clickable. But, if you have to hyperlink words, such as a page title or the headline of a post you’re tracking, here’s how.

Highlight the words you want to hyperlink, then press Shift K. From there a box will pop up allowing you to place the hyperlink URL. Copy and paste the URL into this box and hit or click Enter.

If the key shortcut isn’t working for any reason, you can also do this manually by highlighting the cell and clicking Insert > Hyperlink.

18. Add drop-down menus.

Sometimes, you‘ll be using your spreadsheet to track processes or other qualitative things. Rather than writing words into your sheet repetitively, such as “Yes”, “No”, “Customer Stage”, “Sales Lead”, or “Prospect”, you can use dropdown menus to quickly mark descriptive things about your contacts or whatever you’re tracking.

Here’s how to add drop-downs to your cells.

Highlight the cells you want the drop-downs to be in, then click the Data menu in the top navigation and press Validation.
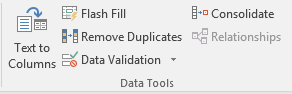
Excel drop-down menu option

From there, you’ll see a Data Validation Settings box open. Look at the Allow options, then click Lists and select Drop-down List. Check the In-Cell dropdown button, then press OK.

19. Use the format painter.

As you’ve probably noticed, Excel has a lot of features to make crunching numbers and analyzing your data quick and easy. But if you ever spent some time formatting a sheet to your liking, you know it can get a bit tedious.

Don’t waste time repeating the same formatting commands over and over again. Use the format painter to easily copy the formatting from one area of the worksheet to another. To do so, choose the cell you’d like to replicate, then select the format painter option (paintbrush icon) from the top toolbar.

20. Create tables with data.

Converting your data into a table not only makes it visually appealing but also provides improved data management and analysis capabilities.

To get started, you’ll need to select the range of cells that you want to convert into a table. Then, go to the Home tab in the Excel ribbon. In the Styles group, click on the Format as Table button — it looks like a grid of cells. Then, choose a table style from the available options, or customize a table if desired.

In the Create Table dialog box, make sure the range you selected is correct. If Excel did not automatically detect the range correctly, you can adjust it manually. If your table has headers (column names), ensure that the “My table has headers” option is checked. This allows Excel to treat the first row as the header row.

Once everything is ready, click the OK button, and Excel will convert your selected data into a table.
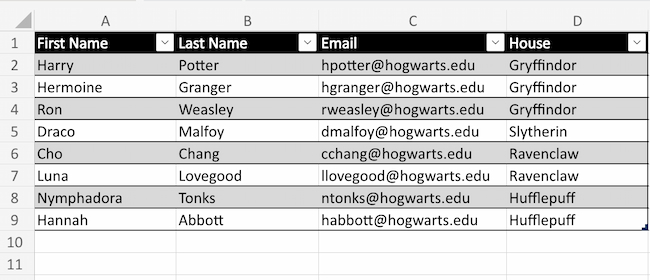
create tables with data in excel

After your data is converted into a table, you’ll notice some additional features and functionalities become available:

  • The table is automatically assigned a name, such as “Table1” or “Table2,” which you can modify if needed.
  • Filter drop-down arrows appear in the header row, allowing you to filter data within the table easily.
  • The table is formatted with alternating row colors, making it visually appealing.
  • Total rows are automatically added at the bottom of each column, allowing you to perform calculations like sum, average, etc., for the data in that column.

21. Use tables to conduct a what-if analysis.

In addition to making your data more organized, tables can also help you conduct what-if analyses. This allows you to test various combinations of input values and observe the resulting outcomes.

A what-if analysis can be beneficial when it comes to decision making, planning, forecasting, financial modeling, sensitivity analysis, resource planning, and more.

To get started, you’ll need to set up your worksheet with the necessary formulas and variables you want to analyze. Then, determine the input values that you want to vary. Typically, you will choose one or two input variables.

Select the cell where you want to display the results of your what-if analysis. Then, go to the Data tab in the Excel ribbon and click on the What-If Analysis button. From the dropdown menu, select Data Table.

In the Table Input dialog box, enter the input values that you want to test for each variable. If you have one variable, enter the different input values in a column or row. If you have two variables, enter the combinations in a table format.

Select the cells in the table area that correspond to the formula cell you want to analyze. This is the cell that will display the results for each combination of input values.

Click OK to generate the data table. Excel will calculate the formula for each combination of input values and display the results in the selected cells. The data table acts as a grid, showing the various scenarios and their corresponding outcomes.

Once your table is created, you can use it to identify trends, patterns, or specific values of interest. Play around with the input values and see how it may affect the final results.

22. Make formulas easier to comprehend with named ranges.

Instead of referring to a range of cells by its coordinates (e.g., A1:B10), you can assign a name to it. This makes formulas more readable and easier to manage.

To get started, select the cell or range of cells that you want to name. Go to the Formulas tab in the Excel ribbon and click on the Define Name button in the Defined Names group. Alternatively, you can use the keyboard shortcut Alt + M + N + D.

In the New Name dialog box, enter a name for the selected cell or range in the Name field. Make sure the name is descriptive and easy to remember. By default, Excel assigns the selected cell or range’s reference to the Refers to field in the dialog box. If needed, you can modify the reference to include additional cells or adjust the range.

Click the OK button to save the named range. Once you’ve named a range, you can use it in your formulas by simply typing the name instead of the cell reference. For example, if you named cell A1 as “Revenue,” you could use =Revenue instead of =A1 in your formulas.

Using named ranges offers several benefits:

  • Improved formula readability: Named ranges make formulas easier to understand and navigate, especially in complex calculations or large datasets.
  • Flexibility for range adjustments: If your dataset changes, you can easily modify the range assigned to a named range without updating each formula that references it.
  • Enhanced collaboration: Named ranges make it easier to collaborate with others, as they can understand the purpose of a named range and use it in their own calculations.
  • Simplified data analysis: When using named ranges, you can create more intuitive data analysis by referring to named ranges in functions like SUM, AVERAGE, COUNTIF, etc.

To manage named ranges, you can go to the Formulas tab, click on the Name Manager button in the Defined Names group. The Name Manager offers functionalities to modify, delete, or review existing named ranges.

23. Group data to improve organization.

Grouping data in Excel provides a way to organize, analyze, and present information more effectively, making it easier to identify patterns, trends, and insights within your data. For instance, if you have a list of leads generated, you can group the data by month to create a monthly performance report.

Grouping data especially makes it easier to navigate and work with large data sets. It helps in organization and reduces clutter by collapsing the groups that are not immediately needed.

To group data in Excel, select the range of cells or columns that you want to group. Make sure the data is sorted properly, if needed.

On the Data tab in the Excel ribbon, click on the Group button. It is usually found in the Outline or Data Tools group.
group and ungroup buttons in excel

You can specify the grouping levels by choosing options like Rows or Columns. For example, if you want to group data by month, you can select Months. You can also set additional options such as Summary rows below detail or Collapse the outline to the summary levels. These options affect how the grouped data is displayed.

Once you have the options you want selected, click on the OK button, and Excel will group the selected data based on your settings.

After your data is grouped, you will see a plus (+) or minus (-) button next to the grouped rows or columns. Clicking on the plus button expands the group to show the individual records, and clicking on the minus button collapses the group to hide the details.

24. Use Find & Select to streamline formatting.

Why format and clean up your spreadsheet manually when you can do it in just a few clicks? Using the Find & Select tool can help you maintain accuracy and consistency in your documents.

To get started, open the Excel worksheet that contains the data you want to search. Press the Ctrl + F keys on your keyboard or go to the Home tab and click on the Find & Select drop-down menu. Then, select Find from the menu. The Find and Replace dialog box will open.
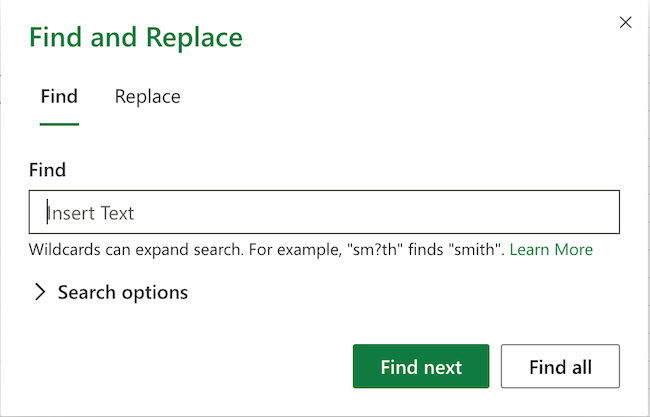
excel find and select tool

In the Find field, enter the specific data you want to find. Optionally, you can narrow down your search to specific cells, rows, columns, or formulas by choosing the appropriate options in the dialog box.

Click on the Find next button to search for the first occurrence of the data. Excel will highlight the cell containing the data.

To replace the found data with new information, click on the Replace button in the dialog box. This will replace the highlighted occurrence with the data you enter in the Replace field.

To replace all occurrences of the data at once, click on the Replace All button. Once you have finished finding and replacing, you can close the dialog box.

Note: Be cautious when using the Replace All feature, as it replaces all occurrences without confirmation. It is always a good practice to review each replacement carefully before using the Replace All option.

25. Protect your work.

Protecting your work in Excel is essential for data security, maintaining data integrity, preserving intellectual property, and complying with legal or regulatory requirements. It allows you to have control over who can access and modify your work, minimizing risks and maintaining the quality and confidentiality of your data.

Here are a couple ways you can protect your work:

Protect a Worksheet

  1. Open your Excel worksheet and navigate to the Review tab.
  2. Click on the Manage Protection button in the Protection group.
  3. A Manage Protection dialog box will appear. There, you can select whether or not you want to protect the sheet. Set a password if desired and choose the options you want to apply, such as preventing users from making changes to cells, formatting, inserting/deleting columns or rows, etc.
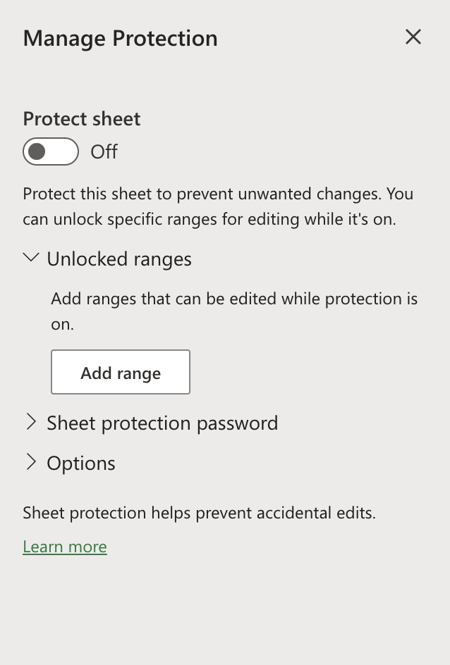
protect worksheet in excel

Protecting a Workbook

  1. Open your Excel workbook and navigate to the File tab.
  2. Click on Info and select Protect Workbook from the options.
  3. Choose Encrypt with Password and enter a password if desired.
  4. Click OK to protect the workbook.

protect workbook in excel

Taking these extra steps ensures your work is protected. Just make sure to keep your passwords safe and secure.

26. Create custom number formats.

To display data in unique ways, use custom number formats. Doing this can help with data presentation, data clarity, consistency, localization, and masking sensitive data.

To get started, select the cell or range of cells that you want to format. Right-click on the selected cells and choose Number Format from the context menu. Then, find the Category list and select Custom.
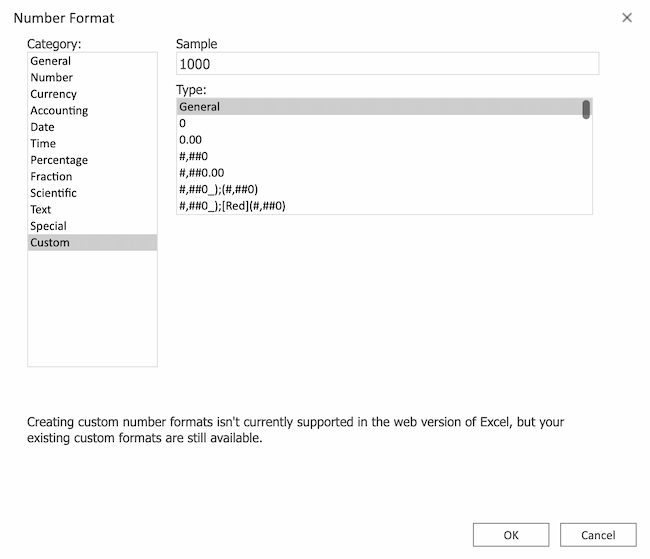
number formatting in excel

In the Type field, you can enter a custom number format code to define your desired format. Here are some examples of custom number formats:

  • To display numbers with a specific number of decimal places, use the 0 or # symbol to represent a digit, and a zero or hashtag without a decimal point to represent optional digits. For example, 0.00 will display two decimal places, 0.### will display up to three decimal places, and ### will display no decimal places.
  • To display a specific text or character alongside numbers, use the @ symbol. For example, $0 will display a dollar sign before the number.
  • To display percentages, use the % symbol. For example, 0% will display the number as a percentage.
  • To create custom date or time formats, use codes such as dd for day, mm for month, yy for two-digit year, hh for hours, mm for minutes, and ss for seconds. For example, dd/mm/yyyy will display the date in the format of day/month/year.

As you enter your custom number format in the Type field, you will see a Sample section that shows a preview of how the format will be applied. Click OK to apply the custom number format to the selected cells.

27. Customize the Excel ribbon.

Although the Excel ribbon already contains various tools that are used to execute common functions and commands, you can customize it to fit your specific needs and preferences.

This can help streamline your workflow and make commonly used commands more easily accessible. It also allows you to remove unnecessary elements that you don’t use, making it easier to navigate and find the tools you need.

excel ribbon

To make customizations, start by right clicking on an empty area of the ribbon and select Customize the Ribbon. In the Excel Options window that appears, you’ll see two sections. The left section displays the tabs currently visible in the ribbon, while the right section displays the tabs you can add.

To customize the ribbon, you have several options:

  • To add a new tab, click on New Tab in the right section and give it a name.
  • To add a group within an existing tab, select the tab in the left section, click New Group in the right section, and name it.
  • To add commands to a group, select the group in the right section, choose commands from the left section, and click Add. You can also customize the order of the commands using the Up and Down buttons.

You can also remove tabs, groups, or commands from the ribbon. Select the item you want to remove in the left section and click Remove.

To change the order of tabs and groups, select the item in the left section and use the Up and Down buttons to rearrange them.

Click OK in the Excel Options window to save your changes and apply the customized ribbon.

To extend Excel’s functionality even further, you can customize the ribbon with additional applications by clicking on the Add-ins button in the Home tab.
excel add ins

Note: Customizing the ribbon is specific to your Excel installation and won‘t affect other users’ ribbons.

28. Improve visual presentation with text wrapping.
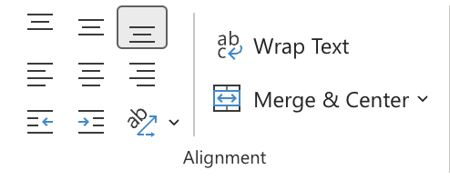
wrap text in excel

Even though spreadsheets aren’t always the most interesting things to look at, you can still take the time to make them easier to read by wrapping text.

Doing this lets you display multiple lines of text within a single cell. It’s particularly handy when you need to include line breaks or break up paragraphs of information within a cell without increasing the row height.

Select the cell(s) with the text you want to wrap. Navigate to the toolbar at the top of the Excel window and locate the Wrap Text button (an icon with an angled arrow). It is typically found in the Alignment section. Then, click on Wrap Text.

29. Add emojis.

Give your spreadsheets a little personal touch by adding in emojis.

To get started, click on the cell where you want to insert an emoji. Then, open the emoji keyboard. This step may vary based on your operating system.

  • Windows: Use the keyboard shortcut Win + . or Win + ; to open the emoji keyboard.
  • macOS: Use the keyboard shortcut Ctrl + Cmd + Space to access the emoji keyboard.

Browse through the available emojis and click on the one you want to insert. The selected emoji should now appear in the selected cell.
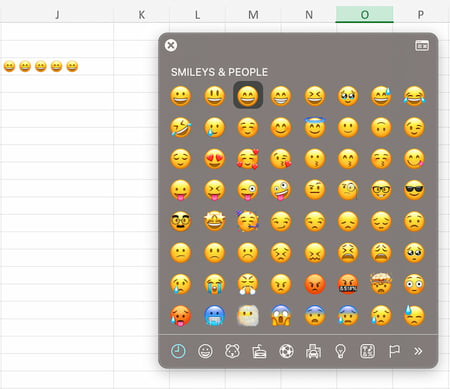
add emojis in excel

Emojis may appear small by default in Excel cells. If you want to make them larger to improve visibility, you can adjust the cell size by dragging the row height and column width accordingly.

You can also copy emojis from external sources on the web or other applications and paste them directly into Excel cells.

Note: The ability to use emojis in Excel depends on the version of Excel and the device you are using. Some older versions or platforms may not support emojis or display them correctly. Therefore, it’s important to ensure compatibility with the Excel version and platform you are working with.

Excel Keyboard Shortcuts

Creating reports in Excel is time-consuming enough. How can we spend less time navigating, formatting, and selecting items in our spreadsheet? Glad you asked. There are a ton of Excel shortcuts out there, including some of our favorites listed below.

Create a New Workbook

PC: Ctrl-N | Mac: Command-N

Select Entire Row

PC: Shift-Space | Mac: Shift-Space

Select Entire Column

PC: Ctrl-Space | Mac: Control-Space

Select Rest of Column

PC: Ctrl-Shift-Down/Up | Mac: Command-Shift-Down/Up

Select Rest of Row

PC: Ctrl-Shift-Right/Left | Mac: Command-Shift-Right/Left

Add Hyperlink

PC: Ctrl-K | Mac: Command-K

Open Format Cells Window

PC: Ctrl-1 | Mac: Command-1

Autosum Selected Cells

PC: Alt-= | Mac: Command-Shift-T

Other Excel Help Resources

Use Excel to Automate Processes in Your Team

Even if you’re not an accountant, you can still use Excel to automate tasks and processes in your team. With the tips and tricks we shared in this post, you’ll be sure to use Excel to its fullest extent and get the most out of the software to grow your business.

Editor’s Note: This post was originally published in August 2017 but has been updated for comprehensiveness.


Categories B2B

Social Impact Done Right: Why Nike and Dove Are Teaming Up to Advocate for Girls Sports

We recently discussed whether or not consumers want brands to make social statements with our sister publication, The Hustle. The main consensus is instead of making broad social media statements, consumers want brands to make tangible changes to improve broader communities.

Nike and Dove are doing just that with their recent partnership which is incredibly on-brand and has the potential to make a positive impact.

Last month, Nike and Dove announced a new initiative called Body Confident Sport — a package of coaching tools and resources to build body confidence among 11 to 17-year-old girls through participation in sports.

The two brands conducted a global survey of 2,000 participants to better understand trends related to girls’ participation in sports worldwide. The survey found:

  • 45% of girls drop out of sports during their teenage years due to impacts on body image and self-esteem associated with puberty
  • 74% of the girls surveyed said their coaches positively impacted their confidence

Body Confident Sport equips coaches with the tools and resources they need to instill confidence in their female athletes, making them more likely to continue participating in sports.

Participating in sports has various benefits for women and girls including:

  • Increased confidence and self-esteem
  • Decreased risk of health issues like breast cancer and osteoporosis
  • Better academic performance
  • Increased leadership, teamwork, and goal-setting skills

Why this partnership makes sense for Dove and Nike

Dove has been a champion for positive body image for years. Through the Dove Self-Esteem Project, the brand has developed various campaigns and resources to support body literacy and confidence in young girls worldwide.

As a leading fitness apparel brand, Nike has a vested interest in the world of athletics and is focused on increasing girls’ participation in sports.

Earlier this year the brand premiered “You Got This” — a YouTube series highlighting the impact of athletic participation for young girls. Nike also partnered with Spotify to develop the Make Moves Fund, which awarded grants to UK-based organizations that support physical and creative activities for girls.

The Body Confident Sport initiative is an example of companies putting resources behind a social cause that aligns with each brand’s values and customer base.

New call-to-action

Categories B2B

The Ultimate Guide to Pinterest Analytics

What’s the best way to increase your reach on Pinterest?

Meet Pinterest Analytics — Pinterest’s free tool lets you analyze metrics like impressions, saves, clicks, and pin clicks. Using these analytics, you can better understand how your pins perform, figure out what resonates with your audience, and make data-driven decisions to get more people to see your content.

Free Resource: 12 Pinterest Templates for Business

To help you measure your Pinterest efforts, we’ve put together this comprehensive guide. Here’s what we’ll cover:

What is Pinterest Analytics?

Pinterest Analytics is a free yet powerful, built-in tool provided by Pinterest to help users measure their performance on the platform.

Pinterest Analytics lets you measure a variety of metrics, including but not limited to impressions, saves, pin clicks, and many more. This way, you can modify your strategy to better meet your users’ needs.

To access Pinterest Analytics, you’ll need a business account, which unlocks the ability to create advertisements and promote Pins.

Why does Pinterest Analytics matter?

Pinterest Analytics gives you the ability to sort data from any time period.

Whether you’re doing monthly, bi-yearly, or yearly reporting, you can use Pinterest Analytics to identify patterns, analyze trends, and track the progress of your Pinterest efforts over time.

You can also sort the data by device, which can be helpful when figuring out how you should optimize for mobile versus desktop.

Last but not least, Pinterest Analytics gives you the ability to export your stats in a CSV file, which will come in handy for your next report or audit.

Now that we know more, let’s see what tools you can use to track your Pinterest performance.

3 Pinterest Analytics Tools to Smartly Track Your Performance

Here’s a list of three Pinterest Analytics tools that you can try to smartly measure your performance on the platform:

Let’s dive into these tools one by one.

1. Pinterest Analytics

Image Source

As mentioned before, Pinterest Analytics is Pinterest’s free built-in tool that you can use to measure the performance of your Pinterest efforts. To access Pinterest Analytics, you’ll need a business account.

When you head over to Pinterest Analytics on mobile, you’ll see the following four metrics at the top:

  • Impressions — the number of times your Pins have been viewed. This could be through a user’s home feed, category feed, or search.
  • Engagements — the total number of engagements on your Pins, including clicks and saves.
  • Total audience — the total number of people who have seen or engaged with your Pins.
  • Engaged audience — the number of people who have engaged with your Pins.

You can either measure analytics for your whole account or for individual pins or boards.

2. Tailwind

Image Source

Another great tool you can use to analyze your Pinterest metrics is Tailwind. Tailwind is a social media scheduling tool for Pinterest and Instagram that includes analytics.

The tool goes beyond vanity metrics and tracks followers, engagement, and even virality. You can even track your ROI by looking at visits, transactions, and revenue down to the specific pin.

Additionally, there are powerful filtering tools so you can uncover insights by board, interest heatmaps to verify that you‘re focusing on the right content, and trending reports to see what’s trending right now, even if it was pinned months ago.

If you’re looking for a detailed tool with lots of insights, Tailwind might be worth exploring.

3. Olapic

Image Source

Olapic is an all-in-one, user-generated, influencer, short-form video enterprise content platform that helps brands drive engagement.

With its scheduling and analytics tool, you can track ROI, influencer interactions, and engagement.

That being said, let’s learn which metrics you should track to measure the effectiveness of your Pinterest marketing efforts.

18 Important Pinterest Metrics to Track

Here are seventeen important Pinterest metrics you should keep an eye on.

1. Impressions

As with any other social media network, impressions measure the number of times your content is displayed.

Pinterest impressions include the number of times your content appears in a user’s feed, search results, or a different category feed. You can track this metric either for a specific pin or for your overall Pinterest account.

To get a sense of what your audience is searching for, look for patterns within your content to see which categories and keywords gain the most impressions.

For instance, if you notice your “Quotes from impressive marketing leaders” post performs exceptionally well, you might want to lean more heavily into thought leadership content on Pinterest.

2. Pin Clicks

Pinterest defines pin clicks as the total number of clicks on your ad or pin such that it opens in closeup.

Your Pins can have thousands of impressions, but if they are not driving any clicks, it’s important to reassess your strategy. Maybe the Pins with low impressions are not visually appealing. Or maybe they don’t resonate with your target audience.

This metric gives you an indication of how your audience is interacting with your Pins. You can track this metric either for a specific pin or for your overall Pinterest account.

To increase the chances of your audience clicking through, you can consider implementing these tactics:

  • Create visually appealing pins that resonate with your target audience.
  • Write compelling descriptions.
  • A/B test different pin variations to understand what works for your business.
  • Add keywords to your Pin title and description.

3. Saves

The saves metric (formerly repins) helps you understand what type of content your audience resonates with and is loving enough to save for future reference.

If people are saving your content, it’s a good sign. This means they care about your content and will save it for future reference. You can track this metric either for a specific pin or for your overall Pinterest account.

You can analyze what kind of content people are saving the most. Based on that information, we highly recommend finding the reason behind it. Try to understand why. And if it aligns with your content strategy, make more of that content.

Image Source

4. Outbound Clicks

Many people confuse pin clicks with outbound clicks. Pin clicks refer to the total number of clicks on your ad or Pin that enlarges the image.

On the other hand, outbound clicks is the total number of clicks to the destination URL associated with your pin. You can track this metric either for a specific pin or for your overall Pinterest account.

When someone opens one of your pins close up, that’s counted as one pin click. But if that same person takes it one step forward by clicking on the destination URL associated with that pin, that’s counted as one outbound click.

Measure link clicks against outbound clicks to understand the effectiveness of your Pinterest strategy and the engagement rate.

5. Top Pins

Pinterest content has a long lifespan. This means that your content can accumulate metrics over a longer period of time than they do on other platforms.

Your Top Pins will be useful in determining your best content over time. If you launched an extremely popular campaign that resonated with your audience a year ago, you’ll be able to go back and see the actions taken on that content.

You can use that information to inform the strategy of your next campaign. You can sort your top pins by impressions, engagements, pin clicks, outbound clicks, or saves, depending on your goals.

Image Source

6. Profile Visits

The profile visits metric allows you to understand the number of times people visited your profile after viewing your idea pin.

Note that we have used the term “idea pin” in the definition. An idea pin is different from a regular pin. It’s similar to Instagram stories. You can’t upload videos to regular pins. However, in the case of idea pins, it’s possible to do so.

Idea pins are meant to increase brand awareness and grow your Pinterest presence, as you can’t add a destination URL to them.

That’s one of the reasons Pinterest allows you to track the number of profile visits for your idea pins (you can’t track this metric for regular pins).

7. Follows

The follows metric allows you to track the number of followers attributed to your idea pin. In simple words, it’s the number of people who have followed your account after interacting with your idea pin.

You can’t track this metric for a regular pin. Instead, it is only possible in the case of idea pins, similar to the profile visits metric.

8. Engagements

There’s no point in having thousands of people following your account if there’s little to no engagement on your pins.

If you’re spending your time and effort on Pinterest marketing, you need to make sure that people are engaging with your posts.

Pinterest’s engagement metric allows you to do that. The engagements metric shows you the total number of engagements on your Pins, including saves and clicks.

You can find the engagement metrics by heading over to your account, clicking on the analytics metric in the top-left corner, and selecting analytics under Business tools.

9. Total Audience

The total audience is the total number of people who have seen or engaged with your pins. This metric gives you an understanding of the number of unique users who have seen or interacted with your Pins.

Don’t confuse it with impressions. The impressions metric measures how many times your Pins were displayed.

On the other hand, the total audience metric signifies the unique individuals who have been exposed to your pin. This metric allows you to see how many unique people you’re reaching out to.

10. Engaged Audience

Unlike total audience, the engaged audience metric takes into account the total number of unique people who have engaged with your pins. This metric tells you how many people commented, saved, reacted to, or clicked on your pin.

You can track this metric to see how many unique people are engaging with your pins, allowing you to gauge the level of engagement and interaction on Pinterest.

11. Engagement Rate

Engagement rate is the percentage of total engagements (clicks and saves) with your pins divided by the number of times your pins were seen. Basically, you’re dividing engagements with impressions.

This metric can help you understand how well your audience is connected with your content.

We highly recommend tracking this metric month-over-month along with other metrics to see how your Pins are performing and measure the effectiveness of your Pinterest strategy.

12. Pin Click Rate

Pinterest defines pin click rate as the percentage of the total number of clicks on your pin to content on or off Pinterest (user’s feed, search engine, or any other place) divided by the number of times your pins were on screen.

Here’s the formula to calculate pin click rate:

By tracking this metric, you can gain an understanding of how effective your Pins are in driving user engagement and click-throughs to your content, both within and outside of Pinterest.

13. Outbound Click Rate

Outbound click rate is the percentage of the total number of clicks to the destination URL of your pins divided by the number of times your pins were on screen.

To increase your outbound click rate, take these tips into consideration:

  • Create attractive and clickable pins — you can try an easy-to-use tool like Canva or pin templates.
  • Don’t give away all the information on your pin – this will increase the chances of your audience clicking through.
  • Experiment with different call-to-action variations.
  • Do more of what’s working.

14. Save Rate

Save rate is the percentage of the total number of saves of your pins divided by the number of times your pins were on screen.

Here’s the formula used to calculate save rate.

We believe that this metric is even more important than outbound clicks or outbound click rate.

That’s because when people are saving your content, this means they are connecting with what you’re putting in front of them. They’re either saving it for reference or to share it with someone they know.

15. Monthly Total Audience

Monthly total audience is the total number of people who have either seen or engaged with your pins in the last 30 days. It’s the same as the total audience metric but calculated specifically for the duration of one month (last 30 days).

Tracking this metric every month can help you gain insights into your monthly growth, identify seasonal trends, set future goals, optimize content planning, and assess the effectiveness of your campaign.

16. Monthly Engaged Audience

Monthly engaged audience is the total number of people who have engaged with your pins in the last 30 days.

Just like in the case of monthly total audience, monthly engaged audience is the same as the engaged audience but calculated specifically for the duration of one month (last 30 days).

We encourage tracking this metric to understand your engagement each month, assess the level of interaction and engagement your content receives within a specific timeframe, and identify trends in user engagement.

17. Audience Demographics

You can learn more about your audience (total and/or engaged) by viewing their demographics, which include age, gender, location, and device.

Using the Compare feature, you can also compare data for two audiences side-by-side to identify notable differences and similarities.

Based on this data, you can make informed decisions and tailor your Pinterest marketing strategy to maximize engagement and reach your target audience effectively.

18. Audience Affinities

In this section, you will see a breakdown of the categories your followers engage with and the top boards to which your content is pinned. This will help you understand your audience and what attracts them to your content.

Now that we know which metrics to track, let’s understand how to check your Pinterest analytics.

How to Check Your Pinterest Analytics

First of all, you need to make sure that you have a Pinterest Business account.

Otherwise, you won’t be able to access the analytics. If you don’t have a Pinterest Business account, you can learn how to create one for yourself here.

Once you create your Pinterest business account or if you already have one, you can measure Pinterest Analytics across both mobile and desktop. Whether you’re looking to track analytics on your mobile or desktop, we’ve got you covered.

Let’s understand how to access Pinterest analytics on both devices one by one.

We’ll start with desktop.

How to Check Pinterest Analytics on Desktop

To check Pinterest Analytics on desktop, follow these steps:

1. Head over to www.pinterest.com and log in to your business account.

2. Once logged in, hover your mouse over to the Analytics tab on the top left-hand corner.

Image Source

3. Hovering over Analytics, you’ll see these options:

  • Overview to track the performance of your boards and pins.
  • Conversion insights to measure the impact of both your paid and organic performance on Pinterest.
  • Audience insights to track audience data. You can also compare different audiences.
  • Trends to see what’s popular on Pinterest.

Note: You can access more metrics on the Pinterest desktop application vs. metrics on mobile. So we highly recommend accessing Pinterest Analytics on Desktop.

That being said, if you’re looking to access analytics on mobile, we’ve got that covered next.

How to Check Pinterest Analytics on Mobile

To access Pinterest Analytics on mobile (Android and iOS), follow these steps:

1. Launch your Pinterest mobile application.

2. Log in to your business account.

3. Click on your profile picture in the bottom-right corner.

4. Next, click on audience analytics in the top-left corner.

5. This will launch Business Tools, under which you can find:

  • Analytics: to measure overall Pinterest account analytics.
  • Audience insights: to track audience data.

Note: You can also track metrics like saves, clicks, and impressions for individual pins or boards.

Take a look at The Ultimate Guide to Pinterest Marketing to learn more about how to use Pinterest for your business.

Excited to track your Pinterest performance?

There are plenty of metrics that Pinterest provides that will be helpful for your business. However, it’s important to note that what works for one business‘s Pinterest strategy may not work for your company’s unique voice and positioning.

Using Analytics can allow you to test different content formats, which will ultimately add value to your customers’ overall experience with your brand.

Editor’s note: This post was originally published in April 2019 and has been updated for comprehensiveness.

Pinterest Templates

Categories B2B

19 Creative Pop-Up Shop Examples

I’ll admit it — I’m slightly obsessed with pop-up shops. They’re usually a little quirky, fun, and have an air of exclusivity that puts my FOMO into overdrive.

But as a marketer, I also see the benefit of pop-ups from a business perspective. They enable consumers to get up close and personal with their favorite brands, driving awareness and interest in the process. 

Download Now: Event Planning Checklist [Free Download]

That said, pulling off a pop-up event is no easy feat. Here, we’ll discuss how to find the next big pop-up shop idea, how to run and market one effectively (from HubSpot’s Events team), and the 19 best pop-up event examples for inspiration.

Let’s dive in.

Consumers love the lure of exclusivity, and brands love the unmatched opportunity for experimentation.

Pop-Up Shop Ideas

Your goals will dictate the type of pop-up experience you want to create and how you’ll implement it.

1. Temporary Retail Space

If you’re transitioning your business from online to brick-and-mortar, a pop-up shop is a way to simulate the retail experience and gain valuable insights into considerations such as operations and demand… without the risk of commitment and overhead.

2. One-Time Event

From my experience, an event-style pop-up — where the press and public can attend — generates a ton of buzz due to its fleetingness. By leveraging the exclusivity of the occasion, you can use the event to pique interest. Make it a party!

3. Immersive Experience

I like physical spaces because they give customers the opportunity to see, feel, and experience your brand. In my experience, the more you play to people’s senses, the more memorable the experience.

With that in mind, you can use your pop-up shop to provide a unique, immersive environment. That might mean interactive displays or other unexpected physical elements that add a wow factor.

How to Do a Pop-Up Shop

It’s an undertaking to pull off a successful pop-up, requiring a lot of planning, scouting, and marketing leading up to a launch. Here are the main steps you’ll want to consider as you set up:

1. Evaluate your goals and select a theme.

Are you testing the market for a more permanent location? Or are you generating buzz? Knowing your goals will help you determine what kind of space to look for, what type of pop-up shop to run (see above), what supplies to purchase, and how to market and operate it.

2. Scout for a location.

Because your pop-up is temporary (to start, anyway), you don’t have the benefit of word-of-mouth or brand/location recognition. That means you’ll need to choose a location with plenty of foot traffic to maximize your impact.

This consideration, of course, needs to be balanced with the cost of renting the space and the availability of a short-term lease.

Good places to consider include:

  • Outdoor stands or kiosks
  • Empty storefronts
  • Art or gallery spaces
  • Marketplace or tradeshow booths

You can also use services such as Peerspace or We Are Pop Up to scout locations.

3. Shop for fixtures and supplies.

Once you know where you’re setting up shop and how long you’ll be there, you can plan your space. I suggest picking a theme or concept, and then purchasing key features like shelving, fixtures, and decor to bring it to life.

4. Plan the launch and opening.

Because your pop-up is a fleeting experience, you don’t get the benefit of long-term clientele building. In my experience, building momentum leading up to the event is critical for its success. For this reason, you’ll want to give yourself enough lead time before the opening to generate interest and also create an experience that will get people talking.

4. Launch and enjoy.

Remember, the purpose of a pop-up shop is connecting with your customers. Sure, it’s all about your brand, but your brand is for them. Your intricate planning sets the stage for an incredible experience, but so does your interactions with them. Be prepared to provide a level of service that has your customers spreading the word, coming back, and remembering your brand once you’ve gone.

5. Analyze and determine what went well.

Take a look at the foot traffic you got, the sales you made, the revenue you generated, and the social media engagement you received.

What worked, and what didn’t? What was your ROI? Is it worth opening a permanent shop or repeating the experience elsewhere? What would you do differently?

Tips for Running and Marketing a Pop-Up Event, from HubSpot’s Events Team

1. Think from a “value-add” perspective.

To create a successful pop-up experience, it’s crucial to identify your customers and deliver an experience that adds value to their time,” Casie Nguyen, Senior Production Manager at HubSpot, told me.

In other words, make sure your event has a unique “pull” to get people through the door. This could mean offering unique products, experiences, or insights that they can’t easily get elsewhere.

2. Have a clear call to action.

The last thing you want is for your customers to leave your pop-up shop thinking, “Well, that was fun. What’s next?”

That’s why Nguyen recommends giving attendants a clear call to action. For example, this could mean signing up for a newsletter, posting a photo with a specific hashtag, purchasing a product, signing up for a giveaway, or attending another event.

3. Don’t be afraid to do PR.

The media will be your friend in getting the word out. Reach out to local publications to see if you can earn a feature and draft a press release to see if you can earn coverage. It may even be worthwhile to send exclusive invites to a few journalists for the date of your launch.

4. Reach out to local influencers and bloggers.

Influencers and bloggers may have smaller reach than traditional media outlets, but their followings will likely be highly targeted and engaged. Find out how much promotion might be, and don’t be afraid to offer perks!

5. Create an event on Facebook.

Promote to your existing Facebook followers by creating a Facebook event and inviting them. This will spread awareness to your existing fans and increase the reach of your pop-up marketing efforts.

6. Advertise on Facebook.

Facebook has advanced targeting options for audience type and geographical area, making it an ideal channel to spread the word to prospects who don’t know you yet. Read more about how to create a Facebook ad.

7. Email your database.

Tap into your existing customer base and let them know about your pop-up with email marketing. Your campaign will be even more successful if you can segment your database and target your customers in the area.

8. Leverage direct mail.

One of the best ways to promote a local event is through direct mail campaigns to residents in the nearest zip codes. Mailers function as invites to the general public. You’ll also be able to push the promotions you’re running.

9. Generate buzz and FOMO with promotions.

FOMO (fear of missing out) can motivate buyers to show up and engage. You can tap into this with exciting promotional strategies such as contests, freebies, discounts, and door-buster deals.

10. Put out signage.

Signage will help you get the attention of nearby foot traffic, so invest in flyers, banners, and window clings that are attractive and catch the eyes of passers-by. QR codes are a great way to allow customers to scan a code and get more information even if they are on the go. You can use a QR code generator to produce a new code and add it to existing signs and displays.

To inspire your next branded experience, we’ve curated a list of these innovative and visually stunning pop-up events.

19 Examples of Next-Level Pop-Up Events

1. ShopRunner x Coach

For most pop-up shops, the goal is to move inventory. But this event by ShopRunner and Coach had other things in mind.

Over three days, guests could visit the ShopRunner branded truck, sign up for their app via QR code, and, in exchange, receive a free flower bouquet to gift a loved one for Mother’s Day.

The results? Over 2,500 app sign-ups over three days. Not too shabby, right?

creative pop up events: shoprunner and coach (Image Source)

2. Museum of Ice Cream

If you’re an ice cream fan, this one’s for you.

The Museum of Ice Cream brought its famous sprinkle pool to New York’s Hudson Yard to celebrate National Ice Cream Day (it’s July 16th, in case you want to make a note in your calendar). The cherry on top — pun intended — was their collab with Friendly’s, who supplied complimentary ice cream. Guests could also participate in games and win raffles.

creative pop up events: museum of ice creamcreative pop up events: museum of ice cream

(Image Source)

3. Spotify x BLACKPINK

To celebrate BLACKPINK’s new album, BORN PINK, Spotify presented a three-day immersive pop-up that was dreamed up by the group’s four members. It included photo rooms, a pink boba bar, giveaways, and — who could miss it – a cube of mirrors at the center of it all. 

One standout feature of the event was the merchandise store, which offered exclusive items only to those in attendance. Such exclusivity is a powerful strategy to enhance perceived value and drive fans to events in the first place.

creative pop up events: spotify x BLACKPINKcreative pop up events: Spotify x BLACKPINK

(Image Source)

4. Jongga

How do you bring the flavors of South Korea to London? With an immersive, multi-room pop-up that appeals to all your senses, that’s how!

Jongga Kimchi, one of Korea’s leading kimchi brands, created a pop-up that spanned three rooms, each showcasing the history of kimchi and its role in Korean cuisine and culture.

The stand-out room, in my opinion, was “Kimchi Alley,” where a rotating lineup of London’s top chefs crafted mouthwatering dishes, all starring kimchi. Londoners could see first-hand how to infuse Korean flavors into their favorite dishes.

creative pop up events: Jonggacreative pop up events: Jongga(Image Source)

5. Only Murders in the Building

Ahead of its third season, fans of Hulu’s Only Murders in the Building could stop at the United Palace Theater in New York City — a real-life filming location from the show – and investigate the murder of Ben Glenroy, played by Paul Rudd.

Upon entering the United Palace, guests were presented with a playbill and flashlight, and were free to roam around for clues throughout the theater. This two-day event proved to be a fun, immersive experience for fans, with mystery and photo-ops aplenty.

creative pop up events: only murders in the buildingcreative pop up events: only murders in the building(Image Source)

6. Fast Food Aid

Creative directors Ikkyu and Junya Sato noticed that young adults in Harajuku had a serious fast food problem — and they decided to do something about it.

To promote organic food chain Dohtonbori, they launched Fast Food Aid, a pharmacy-inspired pop-up that offers a selection of health supplements aimed at junk food lovers. And all it will cost you is a receipt from a fast food place.

creative pop up events: Fast Food Aid

(Image Source)

After a guilty indulgence, exchange your receipt for a customized bottle of supplements that will replenish the nutrients missed at your last meal. Each canister is aimed at a particular junk food — ramen, pizza, hamburger, etc. — to make sure your system gets what it needs.

Although Dohtonbori isn’t actually selling anything for profit at the shop, its been able to educate visitors about health and wellness, hopefully driving them to opt for healthier food options in the future – like Dohtonbori’s own restaurant.

7. COS Los Angeles

Experimental architecture firm Snarkitecture was inspired by mirrored surfaces and simple silhouettes when designing this temporary retail space for LA-based fashion label COS.

The folks at Snarkitecture transformed an empty industrial space into two identical, monochromatic rooms — one white and one pale pink ‚ leaving the focus on two racks of minimal clothing. The reflected space “creates an unexpected and altered world for visitors to experience and share.

creative pop up events: COS LA

(Image Source)

8. Arnsdorf

What’s a designer to do when they’re facing a tight budget? Experiment with creative materials. This pop-up retail space for Australian clothier Arnsdorf was created by using 154 pairs of neutral-colored pantyhose, and the effect is otherworldly.

creative pop up events: arnsdorf

Image Credit: Fast Company

9. Pantone Café

What does color taste like? If anyone knows the answer to that question, it’s Pantone.

The world’s most well-known color company has been running a pop-up café in Monaco for the past two summers, selling a minimal menu of pastries, lunch options, coffees, and fresh juices — all branded with Pantone’s signature color swatches.

So does this mean Pantone is permanently branching out into cuisine? Not quite. The seasonal eatery is perfect Instagram-bait, and it has successfully generated a ton of buzz in the press. It’s a perfect example of a pop-up event enabling a company to take creative risks with its brand by stepping outside of its typical business model.

creative pop up events: Pantone Cafe

(Image Source)

10. The Period Shop

For one weekend, Kotex launched a pop-up in New York aimed at alleviating negativity and spreading love for women during their periods.

The store, which was developed by ad agency Organic, featured ice cream, manicures, chocolate, comfy clothing, and Kotex U products for sale. Women were invited to browse the brightly colored offerings and share their experiences. And it was all for a good cause, too. Proceeds were donated to a women’s homeless shelter.

creative pop up events: the period shop


(Image Source)

11. Milani

Makeup brand Milani took its pop-up event on wheels. Fans of Milani had the opportunity to stop by their newsstand truck to purchase their new lip oils, snack on some tasty macaroons (flavored after the news lip oil scents), and even snag a product bundle. Fans could also snap a Polaroid picture in front of the truck, covered with Milani branding.

@explorenewyorkcity FOLLOW for nyc pop-up alerts 🩷🍇 @Milani POP-UP LOCATION👎🏼 〰 Sat, Sept. 30 1-6pm📍SoHo between Prince & Spring St. (around 541 Broadway) 〰 Sun, Oct. 1 4-7pm📍220 36th St. in Industry City, Brooklyn 〰 FREEBIES: 1 lip oil, 1 macaron, 1 polaroid (25% off coupon on back), 1 sticker sheet & 1 poppi soda 〰 1 @mixed.feelings zine
#milanicosmetics
#milanipopup
#milanilipoils
#nycpopup
#nycpopupalert
#nycpopups
#nycfreebies
#nycfreeevents
#nycfall
#nycfallbucketlist
#thingstodoinnyc
#nycactivities
#nycrecs
#dasominnewyork
#explorenewyorkcity
♬ Little Omens – Alfie Jukes

12. Real Life At Work

To offer passersby a glimpse into its world, London-based ad agency Wieden+Kennedy invited graphic artist Emily Forgot to transform the front window of its office into an imaginative, cartoon-inspired pop-up workspace.

Using exaggerated monochrome imagery, Forgot crafted a whimsical office scene from paper, complete with a typewriter and a clock that ran backward.

For a few weeks, real agency employees took turns “working” in the window. The whole thing was then broadcast live via webcam on the agency’s website for anyone who was curious enough to watch.

The pop-up was a unique way for W+K to shrug off the stereotype of the ad agency that takes itself too seriously — plus it was a creative chance for the team to engage with the community.

Real Life at Work

(Image Source)

13. Früt

How do you make inexpensive, packaged underwear appeal to high-end consumers? Just create a “luxury” lingerie pop-up with a fake, fancy-sounding name.

CP+B Boulder helped client Fruit of the Loom open up an intentionally pretentious and ludicrously over-priced boutique for its underwear, complete with colorful intimates hanging from over-the-top tree displays.

Früt sold only Fruit of the Loom undergarments, but shoppers who usually wouldn’t deign to buy the brand were lured in by the high-end guise.

Real Life at Work

(Image Source)

14. Organic Valley Coffee Shop

In a clever shot aimed at the artisanal coffee movement, creative branding agency Humanaut opened up a pop-up cafe to promote its client Organic Valley’s new coffee creamer.

Screenshot 2023-10-20 at 5.07.13 PM(Image Source)

The temporary Manhattan storefront adhered to all of the typical hipster tropes — a minimal logo featuring arrows and X’s, modern glass mugs, and trendy sizes — Lil Bit, Double, and Lotta. And they cast a real Organic Valley farmer as the shop’s folksy proprietor.

There was one catch: The shop only sold measured portions of half-and-half. You ordered your creamer at the counter from a barista and added your coffee separately. The spoof was a major success. Unperturbed by the irony, New Yorkers lined up to order shots of plain cream for $2 a pop. “No one had a problem paying $2 for a pour of organic half-and-half,” said Humanaut’s creative chief David Littlejohn. “In the end, the idea wasn’t as crazy as we thought it was.”

15. 5-Minute Internship

Solve, a Minneapolis-based creative agency, wanted to re-vamp its summer intern hiring process to attract recruits who can really think on their feet. So, naturally, they created a portable, small-scale replica of their office — complete with a receptionist-staffed micro lobby — and set off on an epic college-campus road trip.

Students at participating campuses were given a 5-minute challenge based on their area of interest — and those who performed the best were invited to interview on the spot. The pop-up event tripled the amount of applications the agency received to its internship position.

5 Minute Internship

Image Credit: Adweek

16. The Picture House

Capitalizing on the Instagram food photography craze, Birdseye opened up a temporary restaurant in London where diners could settle their bill with an Instagram post — all they had to do was take a snap of their meal and add the hashtag #BirdsEyeInspirations.

The event was a creative social media experiment that helped generate free publicity for the frozen food company’s Inspirations line of products. Branding agency Slice was behind the world’s first pay-by-picture pop up.

The Picture House

Image Credit: Slice

17. Birchbox’s Tour

Pop-ups give online retailers the chance to show off their goods in person, interact directly with their fans, and take their brand to the next level.

Birchbox – which sells subscription boxes of curated beauty products – went on a national tour in 2015, opening up temporary brick-and-mortar stores in multiple cities with the help of mobile container event company Steel Space.

In addition to selling beauty products, they offered manicures and astrology readings to entice beauty lovers inside.

Birchbox

Image Credit: Racked LA

18. Fendi Spring/Summer Flower Shop

The mobile flower shop that botanical designer Azuma Makoto created for Fendi is proof that not all pop-ups need to be large scale productions. The artist adorned a three-wheeled Italian vehicle with an intricate floral display and outfitted the side of the truck as an open storefront. The vendor/driver sold limited edition Fendi bags and vases of Makoto’s floral arrangements to promote the fashion label’s 2016 Spring/Summer collection.

Fendi

Image Credit: My Modern Met

19. The Poundshop

This design collective is a recurring pop-up platform for artists to offer their goods for affordable prices. “The aim of The Poundshop is to spread design to a wider audience by making it accessible through price and engagement,” the website explains.

The pop-up shops are just as visually interesting as the art they sell.

The Poundshop
The Poundshop

Image Credit: The Poundshop

With a little planning and a lot of preparation, you can make a splash with a pop-up that delights your customers and spreads interest in your brand. 

Editor’s note: This post was originally published in July 2018 and has been updated for comprehensiveness.

New call-to-action