Categories B2B

5 Lessons We Learned from These Famous Rebrands

It can be difficult (if not impossible) to create a brand that remains fresh, relevant, and inspiring years — or even decades — post-creation.

Just consider Dunkin’ Donuts: the brand, first established in 1973, recently shifted its focus to coffee — and, to demonstrate the shift, dropped the ‘Donuts’ in the name.

The rebrand makes sense. Dunkin’s consumers’ preferences, tastes, and style have likely changed quite a bit in the roughly 50 years since the first Dunkin’ was introduced. Dunkin’ needed a rebrand to ensure its business could grow with its consumers, or risk falling behind.

A rebrand can successfully re-establish your brand in an industry, help expand your product offerings, or attract new consumers. But it’s not as simple as copying-and-pasting a fresh logo onto your homepage.

A good rebrand demands redefining your company’s vision and values, re-establishing your brand’s audience, and rebuilding your brand identity from the ground up.

Fortunately, if your business is considering a rebrand, you’re in luck. Here, we’ve compiled five successful examples of rebrands to help inspire your own efforts. Use these examples to kickstart your own rebrand in 2021.

Download Now: Free Brand Building Guide

Five Successful Examples of Rebrands

1. Petco

Petco's rebrand as a health and wellness company for animals.

In October 2020, Petco released an announcement declaring it would no longer sell electronic “shock” collars. The announcement was used to highlight the company’s rebranding efforts — the pet store, which is over 50 years old, was officially rebranding itself as a health and wellness company for pets.

The pet store redesigned Petco’s homepage, as well as the Petco app, to focus on their new initiatives — including health and wellness resources for pet parents, a “Right Food Finder” tool to help parents identify the healthiest foods for their pets, and an extended range of pet healthcare and insurance offerings.

The company also redesigned their logo, opting for a simple blue-and-white design over their previously-signature red and blue cat and dog (to mixed reviews).

Nowadays, many American pet owners treat their animals as members of the family — so Petco’s rebranding makes a lot of sense. The company aims to use the new branding to re-establish itself as the leading health and wellness brand for animals.

The new design better reflects the brand’s more holistic approach to animal wellness — including a dedicated landing page that outlines how to take care of your pet’s mental, physical, and social health, with a tagline, “We’re working with trusted experts to improve pet wellbeing by raising the standards of everything we do. Because it’s what we’d want if we were pets.”

Overall, this was an extremely successful rebrand as it focused on a shift in consumers’ lifestyle and preferences, and ensured the company’s refreshed vision reflected those priorities.

2. Adobe Creative Cloud

Adobe's rebranding of the Creative Cloud

In May 2020, Adobe released a blog post titled, simply, “Evolving Our Brand Identity“. The article dives into the decisions behind Adobe Creative Cloud’s rebranding, and states, “We’re making these branding changes to ensure our portfolio continues to be easy for our customers to navigate and understand, as well as maintain a fresh look and feel.”

Among other things, Adobe Creative Cloud redesigned:

  • Its company logo. The company redesigned the logo to an all-red logo with warmer hues.
  • Its Creative Cloud logo. The new logo uses a colorful, rainbow-esque gradient to represent “the importance of creativity”. The colors in the logo are pulled together from various Adobe products, as well as the new Adobe red logo.
  • Its product logos. The company is adding 3-letter mnemonics to help viewers determine product families — i.e. Adobe Photoshop (Ps) and Adobe Photoshop Camera (PsC). The designers also used colors to organize products into categories.
  • The corners of all logos. The corners are now rounded to fit across a variety of devices and operating systems.

These redesigns successfully highlighted and organized the many product offerings of Adobe Creative Cloud. For instance, when you navigate to the “Video” product page on Adobe’s website, you’ll see all apps within the Video category are similar shades of blues and purples.

While some designers have expressed frustration over the new logo color similarities, it makes sense that the brand felt it necessary to organize their products better — with a catalog of over 50 products, it can feel overwhelming to choose the right ones for your needs. The updated logos should help make it easier to pick-and-choose.

3. Starbucks 

An example of a rebrand, Starbucks impressive rebranding

Over the years, Starbucks — one of the most valuable brands in the world — has proven the true power of a good brand. And one of the telltale signs of a good brand is the ability to consistently innovate and push the boundaries, rather than settling for what’s already working.

In 2020, Starbucks released its “Starbucks Creative Expression” brand expression guide. Among other things, the site focuses on Starbucks’ defined voice, typography, and logo in an effort to create consistency across channels and Starbucks locations.

In a few words, Starbucks aims to create a brand that is open, creative, carefree, and modern. On the Voice page, for instance, it reads, “We’re confidently turning down the volume of competing messages to elevate experience, removing obstacles in the way of people finding exactly what they seek at Starbucks.”

“By using both functional and expressive voices, we’ll create more space for brand relevance, connection and joy.”

The guideline adds, “When we have the space, we tell a passionate coffee story. But even with just a few words, our copy can make you smile.”

Similarly, Starbucks recently rebranded its logo to the simple Siren logo without the “Starbucks Coffee” wordmark wrapped around it. The company notes, “The preferred approach is to use the Siren logo by itself, unlocked from the wordmark. This allows flexibility to present the Siren with greater prominence while maintaining a considered, open and modern presentation.”

Ultimately, this most recent Starbucks rebrand is simple and effective. Rather than moving too far in the opposite direction of the brand’s roots, the company sticks to its fundamental company vision while making slight alterations to continue serving the needs and preferences of its consumers.

4. GoDaddy 

GoDaddy's major rebrand in 2020

A web hosting service founded back in 1997, GoDaddy was in need of an upgrade. In early 2020, they did just that, creating a brand-new logo, refreshing their website design, and creating new marketing campaigns to match the new look. Their design page reads, “A new brand for a new era” and focuses on how GoDaddy’s users — the everyday entrepreneurs — inspired the new look.

One of GoDaddy’s most striking changes is the new logo, named the GO. GoDaddy believes the GO represents “the indomitable spirit of everyday entrepreneurs … joy that entrepreneurs everywhere experience … and [a] continuous, overlapping stroke [which] symbolizes the connection all entrepreneurs share.”

GoDaddy’s new design uses bold, colorful visuals, hand-drawn illustrations, and a bold, serif font evokes a sense of inspiration and joy. GoDaddy’s brand voice, depicted in recent campaigns, aims to be casual, human, and friendly.

While some brands might need less of a full makeover, GoDaddy’s older image felt outdated and less cohesive. Their rebranding reflects the modern tastes, personalities, and needs of the GoDaddy’s user in 2020.

5. Pottery Barn

Pottery Barn's rebranding materials

This last example is a subtler, more internal rebrand than the others in this list, but equally important. Pottery Barn, a roughly 70-year-old home furnishing company, has now put sustainability as the central focus of their brand, promising consumers that what they purchase will be worthwhile — both in terms of quality, and in terms of environmental impact.

Pottery Barn, named the most sustainable home furnishings retailer, has focused its efforts on sustainability with a dedicated landing page outlining its commitments.

Among other things, Pottery Barn promises to:

  • Plant a tree (with the Arbor Day Foundation) every time a consumer purchases a piece of indoor wood furniture.
  • Reach 100% responsibly-sourced cotton by the end of 2021.
  • Keep products out of landfills by restoring items with a new Pottery Barn “Renewed” line.
  • Contribute money for communities to invest in health clinics, water filtration systems, and more (the brand has currently contributed $3 million).

While this focus on sustainability isn’t brand-new for Pottery Barn, its recent efforts are more hyper-focused on it than ever. Consider, for instance, how this detailed Fast Company article about Pottery Barn’s style, published in 2003, doesn’t mention sustainability once.

The article also highlights how, more than 20 years ago, Pottery Barn used to purchase merchandise from outside vendors and assemble into a collection — this lack of ownership likely made it difficult to ensure sustainable products. Additionally, Pottery Barn announced its partnership with the Renewal Workshop in September 2020.

Ultimately, as your brand grows with your consumers, it’s important to take into account what matters to them today. Pottery Barn has done an excellent job identifying a sweet-spot in the furniture marketplace: Sustainability. As consumers continue to use this value as a guiding light in their purchasing decisions, it makes sense for Pottery Barn to ensure all their updated marketing materials reflects this mission.

Rebranding Takeaways for Marketers

When you take a look at the examples listed above, it can be easy to spot some similarities that made them all strong contenders for best rebrands. 

If you’re considering a rebrand for your own business, here are a few takeaways: 

  • Keep your audience at the forefront of your plans. What tastes and preferences do they have? What inspires or excites them? How would they want your website designed? 
  • Use your consumers’ outside preferences to shape your rebranding. What passions do your consumers have beyond your products or services, and what do they care most about — can you weave those into your brand story, similar to how Petco focused on animal wellness and Pottery Barn focused on sustainability? 
  • A rebrand is more than just a logo change. To properly rebrand, you’ll want to conduct a content audit and analyze all your existing content to ensure each webpage, graphic, and advertisement is updated to fit your new image. 
  • A brand guideline page is critical for cohesion. Most examples in this list have a dedicated brand guideline page for ensuring each employee is empowered with the right tools to create content that fits the new look. Both GoDaddy and Starbucks, for instance, outline how the voice should sound, what fonts to use, and even what colors to include in any public-facing marketing materials. 

Ultimately, a rebranding strategy can be an exciting and effective opportunity to delight existing customers while attracting new ones. Use the takeaways listed above, as well as inspiration from examples in this list, to get started with your own fresh look for 2021 and beyond.

New Call-to-action

Categories B2B

The Step-by-Step Guide to Instagram Live [+ Influencer-Approved Tips]

There are plenty of benefits for businesses to post Live videos on Instagram.

For one, people love watching live videos. The content can feel more authentic and natural than it would if it had been pre-recorded — just consider how addicting Saturday Night Live can be, particularly if the actors make mistakes or break character.

Additionally, 82% of people prefer live video from a brand over standard social media posts.

You might consider using Instagram’s Live feature to host live Q&A’s with industry leaders, stream entire virtual events, or host live product tutorials from social media influencers.

If you’ve never posted a live video on Instagram, you’re in luck. Here, we’ll dive into how you can go live on Instagram in five easy steps — plus, take a look at Instagram influencers’ favorite tips for creating Instagram Live content.

Table of Contents

New Data: Instagram Engagement Report [2021 Version]

Influencer-Backed Tips When Using Instagram Live

Before we dive into how you can go live on Instagram, let’s explore a few tips from various influencers that you’ll want to follow when testing out Instagram Live for the first time. 

1. Mary Jelkovsky (@maryscupofteaa, 281K followers) says it’s a good opportunity to showcase a more authentic side to you or your brand. 

“Instagram Live is a great way for your audience to see ‘the real you’ and interact with you in real time.”

“I really enjoy doing joint lives because you and a friend or fellow influencer/brand can reach both of your audiences and host a very conversational live.”

“I’ve even became friends with people after doing a joint live with them! It’s a great way to meet people and connect.”

2. Diego Leon (@dandyinthebronx, 41.2K followers) urges users to wait for the opportune time to go Live to reach the most amount of people. 

“One huge benefit to being on Instagram Live is having Instagram help you push your content to more people. For instance, when you go to the Instagram Live screen, you’ll be told how many of your followers are currently online. I’d recommend using this information to know when to go live in the future.”

3. Eli Erlick (@elierlick, 40.3K followers) recommends using Instagram Live as a chance to interact directly with your followers. 

“Instagram Live is the best option to directly interact with followers. It’s more important than ever to have an engaging social media presence, especially when people are separated from friends or family.”

“Live lets users not only speak directly with you, but discuss what you have to offer them among each other in an instant.”

4. Tomi Obebe (@GoodTomiCha, 39.7K followers) suggests using Instagram Live as an opportunity to switch up your marketing mix.

“Instagram-Live is a great way to switch up your marketing mix. I think audience members really value being able to ask questions in real-time or watching a ‘how-to’ tutorial in a live and seeing that a product really works.”

“There’s a sense of authenticity you can provide with Instagram Live that you can’t really share with other features in the app.” 

How to Go Live on Instagram

It’s important to note — these instructions will only work if you’re opening the Instagram app on mobile. However, if you’d prefer to create a live Instagram video from desktop, you’ll need to use a third-party tool like Loola TV.

1. Open your Instagram app, and click the camera icon in the top left corner.

First step to create an Instagram Live is clicking the camera icon in top left of your screen2. Scroll to “Live”, and then click the white circle button.

On the bottom navigation, scroll all the way to the left until you see “Live”. Then, click the big white circle to begin recording.

(Note: You’ll know you’re Live when you see the pink “Live” button at the top of your screen, as well as the text “We’re telling your followers that you’ve started a live video” at the bottom.)

Step two to creating an Instagram Live is clicking "Live" button

3. Filter your live video. 

If you want to filter your Live video, click on the Smiley face icon in the top-right corner of the screen. Then scroll through the options that appear at the bottom. 

change the filter on Instagram Live video with the smiley-face icon

4. Invite others to join your Live event. 

To increase engagement to your Live video, click on your profile (top-left of screen), and then “Invite Others to Join” to invite your colleagues, friends, customers, fellow influencers, etc. 

invite others to join your Live video on Instagram

5. Use Q&A to engage with your viewers and answer questions. 

As followers begin joining, you’ll want to keep track of any questions they ask. To do so, click on the Question-mark icon in the bottom right corner of your screen. This is where you’ll be able to see and respond to your followers’ questions. 

Use the Q&A option on Instagram Live to engage with followers

6. Consider co-hosting a Live event with other brands or influencers in an Instagram Live Room. 

To expand your reach, consider co-hosting a Live event with other brands or influencers in an Instagram Live Room. To go Live in a Room, click on the video player icon, and then “Invite” other users to go live with you, or search for another person’s live videos in the Search bar.  

Use Instagrams Live Room featuer to expand your reach with your Live videos

7. End your video when you’re ready. 

To end your video, click the “X” at the top-right corner of your screen, and select the pink “End Now” button.

end your Instagram Live video by clicking the X in the top right

How to Share or Save Your Instagram Live Video

You might want to share your live video to your IGTV, so followers can still watch the video on your Instagram account after-the-fact.

To save your Instagram Live video and share it to IGTV, simply follow these steps. 

When you click “End Video” on your Live video, Instagram will provide you with three pop-up options: “Share to IGTV”, “Download Video”, or “Delete Video”. 

To share the video on your IGTV, click “Share to IGTV”, and then the blue “Next” in the top-right of your screen. Then, edit your cover photo, title, and description. When you’re happy with it, click “Post” in the top right. 

how to save your Instagram Live to IGTV

If you choose to share your live video to your IGTV, your followers can continue watching and re-watching whenever they’re available. If you’re creating an exclusive membership-only live event, you might want to skip this step, but otherwise, it’s a good idea to keep the content you’ve created to continue boosting awareness for followers who weren’t able to join live.

For instance, I regularly partake in fitness trainer Kayleigh Guinee’s Instagram Live workout classes, but there are times I’m unavailable for the live version. Fortunately, I know she saves her videos to IGTV, so I’m able to pull up the videos whenever I’m ready to watch:

Kayleigh Guinees IGTV section, where her Instagram Live videos are housed after filmingBest of all, I can pause, fast-forward, or replay the live version whenever I need to. You’ll know you’re watching a previously live Instagram video if you see the small “was live” text in the top left of the screen:

Kayleigh Guinees IGTV video of an Instagram Live workoutsI spoke with Kayleigh to understand why influencers choose live video over other forms of content.

Kayleigh told me, “Online workouts are amazing, but live workouts on Instagram allow my followers to connect with me — and one another — while continuing to build a community, which is more similar to in-person fitness classes.”

Kayleigh added, “We’re all able to see who joins, chat with each other, and workout in real-time. There is also something about having a time set aside to join a workout that helps us all stay more accountable.”

To save your Instagram Live video and repurpose on your own site, simply click “Download Video” instead once you click “End Video”. The video gets automatically saved to your smartphone device’s Photos app. From there, you can embed the video onto your website, share it across your other social platforms, or even email to prospects and customers. 

how to save your live Instagram Video for later repurposing across channelsFinally, there are some great features included in Instagram’s Live tool. Let’s explore what those are, next.

Instagram Live Features

Once you’re rolling with an Instagram Live, you’ll see three icons at the bottom of your screen — a plus-sign in a video recorder icon, a question-mark bubble, and a paper airplane. 

interesting features on instagram live

1. The plus-sign in a video recorder icon lets you join an Instagram Live Room. A Live Room is a good opportunity to co-host a Live video with up to three guests — enabling you to quickly expand your reach. For instance, perhaps you partner with a few influencers in your industry to create a round-table discussion, with yourself as the host. Those influencers’ followers will ideally check out the Live video and learn more about your brand as a result. 

2. The question-mark bubble icon lets you share questions from your viewers. (It’s important to note, you’ll only be able to share questions if someone has submitted a question during your Live video.)

The Questions section of an Instagram Live

3. The paper airplane icon lets you send a direct message to someone about your Instagram Live video, which you might want to do if you’re hoping to invite someone who hasn’t yet joined your Live video to watch.

How to Turn Off Live Video Commenting or Hide Offensive Comments on Instagram Live

If you want to turn off commenting on your Live video, tap the three dots in the “Comment” box, and click “Turn Off Commenting”.

How to turn off commenting on Instagram LiveAlternatively, you can click the three dots if you’d also like to “Turn Off Requests to Go Live” if you don’t want other participants asking to co-host. 

We’d also recommend hiding offensive comments to ensure followers don’t post inappropriate comments during a live video. To do this, go to your Instagram Settings > Privacy > Comments. Then, toggle on “Hide Offensive Comments”.

Additionally, you can manually filter to hide certain inappropriate words or phrases you don’t want to appear during your live video. Just toggle “Manual Filter” and then type in the phrases you’d like hidden.

And that’s it! Hopefully, you’ll have your own Instagram Live videos up-and-running in no time. Remember, there’s no pressure to make your Live videos perfect. In fact, followers often appreciate when they can see real, authentic, behind-the-scenes footage of your brand. 

To learn more about creating top-notch live videos and get inspiration, take a look at Which Types of Live Video Are People Actually Watching? [New Data].

instagram statistics

Categories B2B

The 2021 Guide to Instagram Ad Costs

Do you remember in 2012 when Mark Zuckerberg bought Instagram for $1 billion? It was a gamble. At the time of the acquisition, the platform was valued at half the purchase price, had 30 million users, and wasn’t generating revenue. Six years after the acquisition, Bloomberg estimated Instagram at 100 times that.

Today, the platform has over 1 billion active users worldwide with diverse demographics, behaviors, interests, and habits — making it prime territory for targeted advertising.

New Data: Instagram Engagement Report [2021 Version]

Instagram advertising is a fascinating process that involves competition, calculation, capital, and strategy. Let’s discuss how these factors influence costs, so you can decide how to implement Instagram advertising into your overall budget spend this year.

Advertising on Instagram can be an accurate and effective way of reaching the right prospects at various stages in their buyer’s journeys. If done right, your business can leverage the platform to generate interest in your products or services and turn users into customers.

Instagram ad example on timeline

But, how should you approach placing ads on the platform? What should your budget look like? And who should you be targeting?

You’ll need to answer those questions before launching your campaign. But before you approach any of them, you have to understand how the platform calculates advertising costs.

How are Instagram ad costs determined?

Instagram ads are bought on an auction bidding system that ultimately dictates their prices. An advertiser starts by establishing their campaign budget and submitting a bid.

Budgets are exactly what they sound like — the total amount of money a company is willing to allocate for an entire campaign. A budget is structured either on a daily basis or by the total cost of a campaign lifecycle.

Bids are the maximum amount of money a company is willing to spend on each user that completes the ad objective. That objective could include anything from viewing a video to clicking on a website link to downloading a mobile application.

Instagram ad example in IG stories Ultimately, objectives always revolve around improving brand awareness, driving consideration, or converting potential leads.

In an auction, Instagram determines which advertisement will create the most value for its users and selects a winner on that basis. That value is established by three primary factors:

  • The advertiser’s bid amount
  • How likely a user is to complete the specific action the ad is optimized for, otherwise known as estimated action rates
  • How likely a user is to be interested in the ad itself, otherwise known as ad quality and relevance

As the winner, you get to place your ad in the space your competitors were vying for. You are charged on a cost-per-click (CPC) basis, and your ads remain live until your budget runs out. During your campaign, you can track your campaign performance using an analytics tool, like HubSpot’s Ads Software tool.

The amount of money it takes to win that auction will depend on the demographics you’re targeting, time constraints, and strategic placement within the app. More on that in the following section.

What can make Instagram ad costs vary?

Age Range

It’s no secret that Generation Z’ers, millennials, and boomers probably will engage with your ads in completely different ways. A clothing brand selling pleated khakis and golf shirts will likely perform better with mature prospects watching PGA Tour videos than 13-year-olds scrolling through SpongeBob memes.

Instagram ad example on IG storiesAdditionally, users in different age brackets have varying online behaviors, with some spending much more time than others on social media. This means that certain age ranges will be more lucrative and, in turn, more competitive for Instagram ad placements.

Timeframe

Instagram ad prices fluctuate based on the time of day, day of the week, and time of year.

When posting on the timeline or on stories, brands take into account the days and times, as that has an impact on how the content performs. Unsurprisingly, advertising prices also consider user activity and fluctuate prices based on this.

Cost-per-click can also shift as the year progresses.

With each season comes different spending habits along with the rise and fall of certain brands’ popularity. For instance, air conditioning companies likely garner more interest in the summer months than they do in the dead of winter.

On that same token, it may cost more to advertise in the weeks leading up to Christmas and Black Friday compared to other weeks in the year.

Consumer interests and habits change with the seasons — and Instagram ad costs typically follow suit.

Gender

As of 2021, 50.8 % of Instagram users identify as female, while 49.2% identify as male. Though that difference may seem unremarkable, it can have some meaningful implications on how much Instagram ads cost. Remember — over a billion people use the application, so a 1.6% discrepancy isn’t trivial.

Instagram ad example on IG StoriesThat difference — among other factors – can account for slight cost discrepancies between Instagram ads targeting women and those targeting men. Though the gap in cost-per-click for men and women might be as small as a few cents, that can add up to dollars quickly.

Ad Placement

The placement and advertisement type within the platform impact your ad’s cost-per-click. Ads in Instagram stories tend to be less expensive than feed placements.

However, some experts — including HubSpot Senior Marketing Manager Jillian Hope — suggest designing unique ads for both stories and feed placements to get the most efficient results for your budget.

Ultimately, paying fair prices to reach your targeted users takes some finesse. There’s no definitive answer to how much Instagram ads cost, as multiple elements play a role.

So while you’ll never know exactly how much your Instagram ads will cost, you should understand the factors that could shape the way you advertise and build your advertising strategy around them.

instagram statistics

Categories B2B

33 of the Best Website Designs to Inspire You in 2021

Your website inspiration journey starts here. 

Deciding to create a web presence is a big decision, but the best websites are a culmination of many small decisions. Choosing the right content management system and web host, opting for a template, refining your content, and selecting the best layouts to display your products and services are just a few of the details that establish your business’s online identity.

But one major decision that takes time, diligence, and a great deal of inspiration is the design of your website.

In this article, we’re sharing a few dozen of the best website designs we’ve seen. From familiar corporations to small businesses, to international organizations, these sites push the status quo on the web. Whether it’s the design aesthetic, usability, interactivity, sound design, or value that the site provides, each one is a masterpiece in its respective industry and something to aspire to.

Not surprisingly, many organizations exist to highlight these sites and the contributions they make to the web. To help surface some of the most inspirational designs, I gathered several award-winners that have made their way through several key awards organizations — including Red Dot, Awwwards, UX Awards, The Webby Awards, SiteInspire, Best Website Gallery, and FWA.

Free Download: 77 Examples of Brilliant Web Design 

Click the links below to jump to explore website designs that crushed it in the last several years. We’ve also included a bonus section of designs that are just plain cool — so check them out, too!

As you browse through the list, know that each site excels in its own way and seeks to serve a unique purpose. While one site may be an excellent example of visual design, another may be an excellent example of interactivity. 

This means that not all of these sites may be “conversion machines” or blueprint ideas that you can easily copy over to your site. Rather, they’re great ways to gain some website design inspiration and see the cutting-edge marketing that’s happening in the different corners of the web.

Keep in mind that web designs are fluid and change often. Some of the designs in this list have changed since they were awarded, but we do our best to keep them up-to-date. We’re confident you’ll find a design here that sparks your creativity.

Beautiful Award-Winning Websites

And the awards go to …

Best Website Designs from 2014 – 2015

1. Virgin America

Award: Most Significant Industry Evolution, 2014 UX Awards

In a world where airline websites are known to be riddled with major usability issues, Virgin America has one of the best websites that pushes usability, accessibility, and responsive design forward. 

Virgin America UX Award winner 2014Image Source

2. Feed

Award: Site of the Day (6/6/2015), Awwwards

Not only is Feed an interesting concept, but it also has a stunning execution that challenges our understanding of what is possible on the web. Through a creative blend of animation and video, the site immerses the user in an engaging experience. As an atypical site, it contains several unique usability elements, including navigation that doubles as a scroll progress bar.

Feed best website design award winner 2015Image Source

3. ETQ

Award: Site of the Day (5/19/2015), Awwwards

ETQ takes a minimalistic approach to ecommerce with a stripped-down site. Big, compelling visuals of their product lay against simple, flat backgrounds accompanied by strong typography that keeps the focus on exactly what the user came there to see: shoes.

ETQ best website design award winner 2015Image Source

4. Mikiya Kobayashi

Award: Site of the Day (7/4/2015), Awwwards

Mikiya is a Product Designer with a minimalistic portfolio that showcases his work through strong photography and subtle animations. His full site was originally created in Japanese and then translated into English, helping demonstrate the international scalability of his design.

Mikiya best website design award winner 2015Image Source

5. Woven Magazine

Award: Site of the Day (4/4/2015), Best Website Gallery

Woven is an online publication that celebrates artists, crafters, and creators alike. They confirm that publications can (and should) have beautiful, engaging sites with easy-to-read content. Free of distractions like pop-ups and intrusive ads, this site is all about the experience of the content itself.

JOHO Bean best website design award winner 2015

Image Source

6. JOHO’s Bean

Award: FWA of the Day (8/7/2015), Favorite Website Awards

The website for JOHO’s Bean has incredible imagery, interactivity, storytelling, visual design, and most of all, sound engineering. These all come together to create a compelling, emotional, and engaging site that tells the story of a coffee bean’s journey.

Image Source

7. World of SWISS

Award: Best User Interface, 2015 Webby Awards

Another airline? Yep. SWISS airlines built an incredibly immersive site that tells the story of what it’s like to fly with them — and they did too great of a job to be ignored. Strong visuals and animations introduce the user to different sections of the site that are packed with information beyond the usual sales and marketing pitch.

World of SWISS best website design award winner 2015Image Source

Best Website Designs from 2016

8. Rainforest Guardians

Award: Best Activism Website, 2016 Webby Awards

Rainforest Guardians became one of the most immersive nonprofit websites of 2016. Seeking to build awareness around deforestation, the site allows users to “visit” the various villages, natives, and waterways that make up the Amazon Rainforest. The site puts interactivity at the center of its user experience — a wise choice if your goal is to get people to connect with your cause and convert into volunteers.

Rainforest Guardians best website design award winner 2016

Image Source

9. Protest Sportswear

Award: Site of the Year (2016), Awwwards

The Awwwards calls Protest Sportswear a “shoppable lookbook,” and that’s exactly what this site is. As a clothing outfitter, this company has reinvented the way they market their product: Rather than promoting garments of clothing, Protest Sportswear promotes “looks.” This makes the company’s product the most appealing part of the website itself, using a collage of styles to design a homepage that changes as often as its customer’s styles do.

Protest Sportswear best website design award winner 2016

Image Source

10. The Teacher’s Guild

Award: Best Association Website, 2016 Webby Awards

The Teacher’s Guild is a professional community of educators that addresses some of the most critical challenges in education. What makes this website award-winning is how it balances diverse content types — programs, solutions, approaches, and collaborations — without overwhelming visitors. Not only are the background visuals prominently placed, but they also use white space to emphasize the written calls to action at the center, as shown in the screenshot below.

Teacher's Guild best website design award winner 2016

Image Source

Best Website Designs from 2017

11. Simply Chocolate

Award: Site of the Year (2017), Awwwards

You’ll get a craving for chocolate just looking at this website — and in a way, that’s Simply Chocolate‘s website working as designed.

This appetizing website is that of a Denmark chocolate maker Simply Chocolate. Its website uses a variety of colors (and creative product names) to promote each chocolate bar. And as you scroll from one product to the next, they all seem to remain consistent in brand. The three-dimensional appearance of each chocolate bar makes you feel like you can grab it off of your computer screen, while the “Add to Box” CTA to the top-left is ideally placed for users to select the products they want while browsing.

Simply Chocolate best website design award winner 2017

Image Source

12. NOWNESS

Award: Best Cultural Blog/Website, 2017 Webby Awards

NOWNESS is perhaps the coolest crowdsourced video blog on the internet. That was a mouthful…what does it all mean?

NOWNESS‘s “crowdsourced” nature is part of what makes it an award-winner. This means most of its content comes from independent creatives — an increasingly popular way for businesses to publish content. NOWNESS is also a video blog, meaning all of its blog content is in video format. Together, these qualities help make Nowness a captivating hub for the stories that brands everywhere strive to tell.

NOWNESS best website design award winner 2017Image Source

Best Website Designs from 2018

13. crypton.trading

Award: Site of the Day (4/3/2018), Awwwards

Meet crypton.trading, your robot accountant.

Crypton.trading is a trading hub for cryptocurrencies such as Bitcoin, using artificial intelligence to predict changes in a currency’s value and identify key buying and selling opportunities. The website was rated high for its development and design, as it gradually explains more of the developer’s methods the further down visitors scroll.

This award-winning website makes tech-savvy visitors feel right at home the moment Crypton’s greeting appears across the homepage, one letter at a time.

crypton.trading best website design award winner 2018Image Source

14. Southwest: Heart of Travel

Award: Best Visual Design – Aesthetic, 2018 Webby Awards

When Southwest Airlines wanted to prove that its customers were “more than just a dollar sign,” the company created a website where the design was assembled using the shapes of their customers’ flight paths.

The website, called Heart of Travel, even allows visitors to create their own artwork out of a trip they might plan on taking. In this way, Southwest’s website is a product of their most loyal passengers.

Southwest best website design award winner 2018Image Source

15. Reductress

Award: Best Humor Website, 2018 Webby Awards

It’s not that hard to make someone laugh on the internet — so much of what we read and consume online is meant to be entertaining. But it is hard to do it consistently for a large audience. Reductress is a satirical magazine whose headlines and general reading experience are top-tier in the humor department — making the website itself a quality property.

Reductress best website design award winner 2018Image Source

16. Overflow

Award: Site of the Day (3/20/2018), Best Website Gallery

Overflow is a design tool that allows people and businesses to create story-like flow diagrams of their ideas so they’re easier for others to understand. Aside from this being just a good service, the Overflow website practices what it preaches: Along with vibrant red call-to-action buttons for downloading the tool, this website promotes its product the best way it knows how — using a flow diagram.

The website delivers this flow diagram in the form of a video. While embedded videos can look rather clunky sitting in the middle of a website’s other design elements, Overflow’s is perfectly placed and exactly what you’d want to see when landing on the site for the first time.

overflow best website design award winner 2018

Image Source

17. Frans Hals Museum

Award: Site of the Year (2018), Awwwards

It can be tough for a museum to present all of its artwork together on a cohesive website. That’s what makes the website of the Frans Hals Museum so impressive.

Located in the Netherlands, this museum has created a website that uses a combination of digital design elements and its own exhibits. This mixture helps visitors understand what they’ll see, when they can see it, and where else they can get a taste of what this museum has to offer.frans hals museum best website design award winner 2018

Image Source

Best Website Designs from 2019

18. 1917: In the Trenches

Award: Awwwards’ Best Website of the Day (2019)

This website, made to promote the film 1917, allows you to walk around the trenches and perform the same mission that the characters did in the film. You can also see their maps or access other tools. 

This is a great example of a site that went above and beyond with interactivity as well as a site that leverages its content and prewritten storyline to market its film. This website won Site of the Day by Awwwards, which allows designers to vote and nominate great websites they see daily.

1917: In the trenches best website design award winner 2019

Image Source

19. The Octopus: A design blog by IDEO

Award: Business Blog/Website 2019 Webby award

IDEO, a global design company, won the Business Blog/Website 2019 Webby award for its Octopus blog, and for good reason. The blog features a sleek, black-and-white Octopus drawing as its homepage design, and uses yellow, black, and white to create a cohesive theme as you scroll.

If you hover over a blog post, the title is highlighted in yellow. If you hover over an image, the image is pulled towards you — two small features that make a big difference in terms of creating a unique and engaging user experience. 

The Octopus best website design award winner 2019

Image Source

20. Nomadic Tribe

Award: Awwwards’ Site of the Year nomination (2019)

This site, which was nominated for Awwards’ Site of the Year, is one of the more engaging sites I’ve seen. The homepage immediately begins playing a stunning video featuring a man walking across a desert, followed by gorgeous landscape scenes and text like, “Are you lucky enough to call yourself an adventurer?”

The text throughout the website is playful, with colorful pinks and oranges and yellows, and the homepage is logically designed, with CTAs placed throughout that range in commitment-level from “Read More” to “Watch Now” and, finally, “Download the App”. Ultimately, the website is beautifully designed with strong attention to detail, and tells a compelling story throughout.

Nomadic tribe best website design award winner 2019

Image Source

21. Diana Danieli

Award: Webby 2019

This 2019 Webby-winning site shows off imagery of art and architecture with either high contrast or heavy exposure. As a website visitor, you can click and drag your mouse to change the photos and variations. Each image shows a piece of work that highlights the artist who owns the website.

A cool plus about this website is its incorporation of audio and music. Clicking on certain buttons on the screenplays a piano note and truly immerses you in the Diana Danieli experience.

diana danieli best website design award winner 2019

Image Source

22. George Nakashima Woodworkers

Award: Webby 2019

This woodworking website emphasizes nature and care for the woodworking trade. It’s essentially a slideshow of beautiful forestry and farming images. As a new image comes on the screen, a new quote related to wood or trees also comes up. This is incredibly relaxing to the visitor and shows that the woodworkers recognize the beauty of trees and the environment. This website also won a Webbie in 2019

george nakashima woordworkers best website design award winner 2019

Image Source

Best Website Designs from 2020

23. Swab the World

Award: Site of the Day (2020), Awwwards

Parallax, bold colors, and negative space shape the design and experience of Swab the World’s website. The organization brings awareness to stem cell donations. Their mission is to “Make sure every single patient finds their match. Period.” Photos of couples exhibiting love and emotions bring a human element to a historically complex and scientific process. 

From a technical perspective, the design makes moving down the page feel natural, ensuring the readers reach each point of copy and every CTA on the homepage.

swab the world best website design award winner 2020

Image Source

24. Newest Americans

Award: Honorable Mention (2020), Awwwards

An organization with a responsibility as large as honoring past, present, and future migrating identities needs a beautiful and functional website to help spread the word. Newest Americans champions immigrant experiences in cities across the state of New Jersey. The website uses beautiful imagery of people, places, and items that represent this experience in a way that flows cohesively down the homepage, telling the story of this group of America’s newest citizens. 

The website is both visually appealing and functional with a simple navigation menu, stories organized by photos, and a clean press page that puts the most recent articles front and center.

Newest Americans best website design award winner 2020

Image Source

25. Spotify Design

Award: Honorable Mention (2020), Awwwards

Spotify is known for accomplishing its fair share of amazing feats, and its latest iteration of Spotify.Design is no different. Serving as the hub for all things visual and creative for Spotify, the music and podcast giant gives listeners a look into the who, what, why, and how of what makes the app so sensational.

Bright colors, drop shadows, and smooth animations give this website character and depth. The flat geometric designs with abstract accents make albums and artists practically jump off of the screen.

spotify.design best website design award winner 2020

Image Source

26. Andy Warhol

Award: Honorable Mention (2020), Awwwards

Artist, film director, and producer Andy Warhol’s life will forever be encapsulated in a splendidly designed website that captures his art style in a digital format. As you peruse the page, your cursor becomes a spotlight that converts every image you hover over into a negative image or inverses the colors of the text you’re reading. 

The big, bold text makes a statement and emphasizes just how important copy is to website design. Subtle animations help pace the site and set the tone for each section as you peruse the home page.

andy warhol best website design award winner 2020

Image Source

27. Human Interaction Company

Award: Corporate Website (2020), Red Dot

To see video done right on a website, look no further than the Human Interaction Company. From the moment you click on the site, the experience is lightning fast. You’re dropped directly into the action — the why, what, and how of Human Interaction and exactly what the team does.

This Red Dot Design Award winner aims to bring the study of human interaction to the masses, and in the process, show us just how engaging it can be to learn about it. Don’t get discouraged by their award status though — none of the photos on this site are photoshopped, so it’s a practical example of building quality with the resources you have available.

human interaction company best website design award winner 2020

Image Source

28. Garoa Skincare

Award: Site of the Day (2020), Awwwards

How do you transform the feeling of luxury and practicality into a website? Garoa Skincare provides a blueprint. Whether your product costs half the price of your closest competitor or twice the price, your site can bring a sense of extravagance to just about any product you sell.

High-quality visuals, typefaces that complement each other, and a balance of negative space with useful copy can bring a simplistic elegance to your website.

garoa skincare best website design award winner 2020

Image Source

Other Cool Website Designs

29. MovieMark

MovieMark is a growth marketing agency and HubSpot Partner whose website is all about digital storytelling. Located in Colombia, the agency makes video a core focus of its brand, so it’s only fitting that MovieMark‘s website follows this theme.

movie mark best website design award winner

Image Source

30. Guillaume Tomasi

As a Photographer in Montreal, Guillaume Tomasi has built a portfolio that’s truly fit to house his unique and awe-inspiring photography. His surreal photo style is juxtaposed by his simple, flat, empty, and minimalistic portfolio design that places all of the focus on the work itself.

His unique series navigation coupled with art-gallery-inspired work introductions and perfect scrolling interactions yield an experience reminiscent of that of a real gallery.guillaume tomasi best website design award winner

Image Source

31. The District

This branding agency takes its imagery seriously, and it should — it handles all channels of media for its clients. The District’s website alone is a journey through some of the most beautiful artwork and photography you’ve ever seen.

These provocative tiles change rapidly as you explore the website, and the wackier they seem, the more interested you become in learning about their past work.the district best website design award winner

Image Source

32. Tej Chauhan

Tej Chauhan has turned impressionist artwork into a business model with this intriguing website. Each image on this product developer’s homepage slides out to cover the previous image, offering little context around the object you now see in front of you. But it’s that lack of context that makes you want to learn more. 

Plus, the tagline, “Souvenirs of The Near Future,” suggests these objects are a part of their product line — and an opportunity for you to bring these innovative objects into your life.

tej chauhan best website design award winner

Image Source

33. Amanda Martocchio Architecture

An architecture firm might not specialize in web development, but its website should still demonstrate its commitment to visually pleasing design. Amanda Martocchio took that to heart with this gorgeous website.

It’s no secret that Amanda Martocchio Architecture loves its work — each picture on the homepage of its website is an enchanting shot of the houses the company designs. The website labels every house you scroll through with the type of design that was intended, along with numerous angles to each building.

amanda martpcchio best website design award winner

Image Source

Website Design Ideas

Now that you’ve seen a number of beautifully designed and award-winning platforms, keep these potential ideas in mind as you create your own.

  • Consider ways that you can make your website interactive, like the 1917 example.
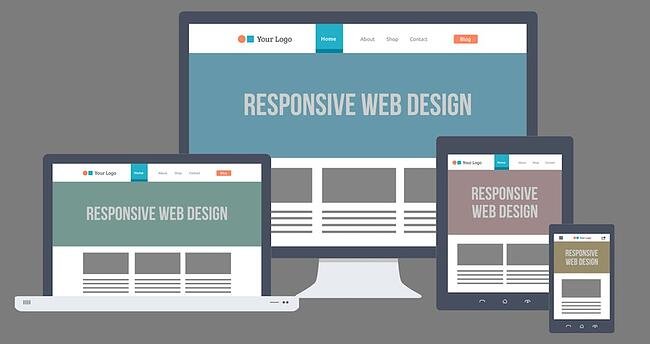
  • Make a website that emphasizes the mobile experience, even while it still has a good UX on desktops.
  • Create a website that tells a story about your brand with photos, text, or video. 
  • If you can’t create a heavily interactive site, consider drawing in eyes with a site that presents a slideshow of your photos. 
  • Ensure your call-to-actions are easy to see and encourage visitors to continue exploring your site 
  • Keep navigation clean. Ensure your visitors always know how to get back to the homepage.
  • Integrate your social media sites via social embed buttons, so site visitors can easily follow you on your various social channels. 
  • Keep each of your web pages consistent in design — including font, colors, images, and messaging. 
  • Test your website’s usability with a heat map, which will show you on which web pages your visitors are most likely to bounce. 
  • Include a live chat or chatbot to give visitors the option to engage with you directly on your website if they prefer live chat to phone calls. Live chat can automate functions for your sales and service reps and create a better communication experience for the customer.
  • Get an SSL certificate to ensure your website is secure. SSL is part of Google’s search ranking algorithm, so an SSL certificate can help you rank higher in search. 

Build a Beautiful Website for your Business

Designing a website can be simple once you have a look and feel in mind. Use these examples as a springboard to developing the layout, color palette, imagery, and animations on your website. Once you’re ready to start coding or dragging and dropping, you’ll have a beautiful website that your visitors will enjoy.

Editor’s note: This post was originally published in January 2021 and has been updated for comprehensiveness.

examples of brilliant homepage, blog, and landing page design

Categories B2B

63 Facebook Statistics to Know for 2021

Even if you don’t personally enjoy using Facebook, there’s no denying the fact that it remains the largest social media platform in the world.

With over2.8 billion monthly active users, anyone serious about marketing a business on social media needs to pay special attention to how they use Facebook.

To that end, we’ve curated the latest Facebook stats for 2021 to help you understand the social network better.

Whether you want insights on where to invest your ad dollars, or you’re interested in where to begin the buyer’s journey on Facebook or considering whether it’s even worth it to use Facebook in 2021, you’ll find all the Facebook statistics you need to know here.

Download Now: State of Marketing in 2020 Report

Our Facebook stats are organized into five categories:

1. Facebook Ad statistics

2. Facebook User statistics

3. Facebook Demographics

4. Facebook Marketing statistics

5. Facebook Video statistics

1. Facebook has 58,604 employees. (Source: Facebook, 2021)

2. Facebook revenue for twelve months ending in December 2021 was $85 billion. (Source: Facebook, 2021)

3. In 2020, Facebook had an annual growth rate of 57%. (Source: Facebook, 2021).

4. 56% of people visit Facebook to get information. (Source: Facebook, 2019).

5. Facebook is the largest social media platform based on the number of monthly active users. (Source: Facebook, 2021)

Mark Zuckerberg has grown Facebook from a startup in his Harvard dorm room to one of the most valuable companies in the world.

These stats show that Facebook has continued to enjoy increased revenue and overall company growth. Facebook remains a giant beside other social media platforms and doesn’t look like it’s dying anytime soon.

As a marketer, knowing where Facebook is and where it’s going gives you information about how you can use Facebook for your brand and best serve your customers on the platform.

1. In 2020, Facebook reported Q4 ad revenue of $27.2 million, a 31% increase from 2019. (Source:
Statista, 2021)


2. The average price for a Facebook ad saw a 5% increase while ad impressions grew by 25% in the fourth quarter of 2020. (Source:
Facebook, 2020)

3. Mobile ads generated 94% of ad revenue in the second quarter of 2019, a 3% increase from 2019’s Q1. (Source:
Facebook 2019)
 
4.Facebook’s ad revenue was $27.1 billion in Q4. (Source:
Facebook, 2021)

5. The U.S. and Canada made up $13.7 billion of Facebook’s ad revenue in Q4 (Source: Facebook, 2021)

Revenue by Facebook User Geography Chart

Image Source

6. In Q3, 2020, Facebook had over 10 million advertisers on their platform. (Source:
Statista, 2020)

 
7. Facebook video ads have a low CPC, at $0.55. (Source:
Social Insider, 2020)
 
8. Facebook ads have the potential to reach over 2.18 billion people. (Source:
Hootsuite, 2020)
Image Source
9. The average cost-per-click on Facebook is $1.72. (Source:
Wordstream, 2019)
 
10. On average, Facebook advertising generated $9.82 per user in Q4, 2020. (Source:
Facebook, 2021)

11. Facebook ads provide the highest return on investment (ROI) among all paid advertising channels. (Source: Hubspot, 2020)

Advertising remains the biggest moneymaker for Facebook. As such, Facebook continues to look for ways to help marketers improve their ad results to keep spending money on the platform. 

Now that you know Facebook ads by the numbers, how does your brand fit in with long-term ROI? Are you spending too much or too little?

1.69% of Americans use Facebook. (Source: Statista, 2021)

2. 42% of American teens use Facebook. (Source: Pipersandler, 2020)

3. 37% of U.S. adults get their news from Facebook. (Source: Pew Research Center, 2019)

4. 73% of U.S. users visit Facebook every day. (Source: Statista, 2020)

5. 98.3% of Facebook users access the app on mobile. (Source: Statista, 2021)

6. Facebook reported that 5% of profiles for monthly active users (MAUs) were fake and removed them in May 2019. That’s 120 million accounts. (Source: HuffPost, 2019)

7. In the fourth quarter of 2020, Facebook flagged and removed 1.3 billion registered user accounts before they became active on the social network. (Source: Facebook, 2021)

8. Daily active users (DAUs) on average for Q4 were 1.8 billion, an 11% increase year over year. (Source: Facebook, 2021)

9. Facebook has 2.41 billion monthly active users (MAUs), a 12% increase year over year. (Source: Facebook, 2021)

10. In 2020, 30% of Facebook’s audience was under 25. (Source: Statista, 2021)

11. Facebook users aged 65+ is 5%. (Source: Statista, 2021)

12. 1.1 billion Facebook users in speak English (Source: We Are Social, 2021)

Facebook Users By Language Chart 2021

13. 17.3% of Facebook’s active users access the social media platform from their desktop (Source: We Are Social, 2021)

It’s essential to know how much of your audience is on Facebook to position your marketing strategy. Do you have thousands or millions of your target audience using Facebook?

Knowing if your market uses Facebook would help you understand what kind of content to create.

Optimizing content for desktop and mobile-based active users will also make your content more attractive to potential customers.

1. Women in the 25-34 age group make up 12.8% of Facebook’s global active users. (Source:
Statista, 2021)

 
2.Men between the ages of 25-34 make up the most significant demographic group, at 18.8%. (Source:
Statista, 2021)
 
3.India is the country with the most Facebook users, with 320 million users. (Source:
Statista, 2021)
Countries with largest Facebook audience size

Image Source

4. Facebook users are 56.8% male and 43.2% female. (Source: Statista, 2021)

5. There are 1.2 billion users from Asia on Facebook. (Source:
Statista, 2021)

 
6. 419 million users use Facebook monthly in Europe. (Source:
Statista, 2021)
 
7. Over 85% of Facebook’s daily active users (DAUs) come from outside of the US and Canada. (Source:
Fast Company
, 2021)

8. 61.3% of Facebook users are under 35. (Source: Statista, 2021)

Distribution of Facebook users wordlwide

9. Facebook usage is high among U.S adults who earn more the $70k annually. (
Pew Research Institute, 2021)

 
10. 70% of U.S adults use the Facebook platform every day. (Source:
Pew Research Institute, 2021)

11. More than 1.8 billion people use Groups every month. (Source: Facebook, 2020)

Facebook’s monthly average users are climbing. That means more of your audience is continuously checking Facebook, and your potential audience reach of over 2.18 billion users is growing.

Many users from different demographics and age groups also see your content, so it’s a good idea to keep that in mind when strategizing campaigns.

1. In 2018, 78% of US consumers made purchases through discoveries on Facebook. (Source: Kleiner Perkins, 2018)

2. In 2019, 15% of Facebook users used the social platform to look and shop for products. (Source: eMarketer)

3. 93% of businesses are active on Facebook. (Source: Buffer, 2019)

4. Over 200 million businesses use Facebook’s apps and free tools (Source: Facebook, 2021)

5. On average, 35.7% of posts from a Facebook page are images. (Source: We Are Social, 2021)

Facebook page posts by post typ

Image Source

6. Link posts receive 73% less engagement than video posts. (Source:
We Are Social, 2021)

 
7. The median engagement rate across all industries on Facebook is 0.08%. (Source:
Rivaliq, 2021)
 
8. U.S adult users spend an average of 33 minutes per day on Facebook. (Source:
Marketing Land, 2019)
 
9. More than 3.3 billion people use Facebook’s family of services (Facebook, WhatsApp, Instagram, Messenger) every month. (Source:
Facebook, 2021)
 
10. Facebook Stories has 500 million daily viewers. (Source:
TechCrunch, 2019)
 
11. 4.6% of marketers use Facebook video ads. (Source:
Buffer, 2019)

12. 35% of marketers report successful influencer campaigns on Facebook. (Source: Buffer, 2019)

These stats provide more direction about where your strategy should head to earn more numbers on Facebook. For example, if you have a video of your company’s weekly Waffle Wednesday event, post that instead of the link to your blog post, which you can save for Twitter Cards.

1. In 2018, users aged 18-24 have 75% less of an attention span for video ads than users who are 65+. (Source: Facebook, 2019)

2. More than 1.2 billion users visit Facebook Watch per month.  (Source:
Facebook, 2020)

 
3. Users are 1.5 times more likely to watch a video on their phone. (Source:
Facebook, 2017)
 
4. Facebook pages with over 100k followers published 17.6% of all the videos on the platform 2020. (Source:
Social Insider
, 2020)
 
5. Videos between 2 and 5 minutes gather more engagement from social media users. (Source:
Social Insider
, 2020)
 
6. 62% of people have reported being more interested in a product after seeing it on a Facebook video. (Source:
Facebook, 2018)
 
7. Video promotions are equally as important as photo promotions. (Source:
Social Bakers, 2019)
 
8. Only 12% of brands use Facebook for live videos. (Source:
Social Insider, 2020)
 
9. 81% of businesses prefer video marketing on Facebook. (Source:
Buffer, 2019)
 
10. Facebook is the second most popular video property behind Google. (Source:
Statista, 2021)
 
11. Politics is the highest category of Facebook Stories, at 36%. (Source:
Statista, 2021)

Graph showing the most watched video topics on Facebook.

Image Source

Facebook videos are massively popular and have an immense appeal to younger users of the site. If you have products to promote, videos have your back and your target audience.

Keeping up with Facebook is an essential factor in planning strategy. Not only because Facebook owns other platforms, like Instagram, but they also influence more than one channel of your planning.

The data also show that posting videos is the way to go for huge Facebook pages that want more engagement.

For more information on using Facebook in your social media planning, check out our ultimate guide here.

New Call-to-action

Categories B2B

How to Map Your Ecommerce Customer Journey [Template Included]

We’ve talked a lot about the customer journey — how it impacts sales, service, and marketers.

But one segment that feels a little different is the ecommerce customer journey. The customer journey is different from service based companies, because it can be much quicker (buying from Amazon or an Instagram ad).

However, if you work at an ecommerce company, it’s important to understand the customer journey: all the touch points and stages.

Below, let’s learn how to map your ecommerce company’s customer journey. Plus, you can download some templates to help you get started.

Download Now: Free Customer Journey Map Templates

Touch points can include when someone sees a social media ad, when a friend tags them in a post online, when they come across your website, when they read a blog of yours, when your product shows up on Google, when they search on Amazon, etc.

The journey from when they first come in contact with you to when they purchase your product to if they reach out for a return is included in the ecommerce customer journey.

Writing down these touch points might make you realize that the journey on your website isn’t ideal. If that happens, you can look for solutions to help you, like WooCommerce (a WordPress plug in).

Now, let’s explore the various stages of the ecommerce journey.

1. Awareness

The first stage of the ecommerce customer journey is awareness. During this stage, a potential customer is experiencing a problem and is doing research to understand their problem.

During this stage, customers are researching the issue they’re having, seeing if it has solutions, overcoming misconceptions, and prioritizing solutions.

2. Consideration

In the consideration stage, potential customers are researching products and methods to solve their problem.

For example, let’s say that I want to start a morning routine. I do some research on Google and see a few ads on social media and realize I want a morning routine journal.

Now that I know what I want to buy and how to fix my problem, it’s time to research solutions. I’ll go to Google and Amazon and see what morning routine journals are available and which ones have the best reviews.

3. Decision

During this stage, potential customers are now narrowing down their list to the top products they want to buy.

This is when they’re learning what makes your product stand out from the competition, and why your product is the one they need. During this stage, it’s important to understand the various touch points so you can communicate what makes your product unique.

4. Retention

For ecommerce, I decided to add one more stage to the customer journey. That stage is retention. After a customer buys your product, their experience and decision to buy from you again relies solely on the quality of your product and customer service.

Let’s say the package was missing, delivered to the wrong address, or they want to return the product. If that experience doesn’t go well, they won’t buy from you again. If it does go well, they’ll probably consider leaving a positive review.

Additionally, during the retention stage is when you can consider retargeting marketing and social media ads so more of your products show up for them online.

Once you’ve delighted your customers, they start to see you show up online, and want to engage with you, they’ll buy from you again and again.

To learn more about ecommerce marketing, you can check out HubSpot Academy’s free ecommerce marketing course.

Now that we understand the ecommerce customer journey, let’s visualize it with a customer journey map.

Essentially, this map will be a visualization of the start-to-finish customer journey. The point of creating this map is to not only understand the customer journey, but also to plan how you’re going to improve the customer experience at every touch point.

For example, HubSpot customer, CODE41, was able to optimize their ecommerce customer journey through HubSpot’s Marketing Hub, Sales Hub, and Service Hub.

With Marketing Hub, CODE41 sends millions of emails (yes, millions) to their lists. With Sales Hub, they have the customer support team automate reminders to minimize the customer support failures: not following up on client requests, not forgetting to check payment status, etc.

Lastly, the company uses Service Hub to generate reports for how many tickets they have that were returned, complaints, repairs, etc. This helps them improve their customer experience and retention in the process.

If you want to get started with your own ecommerce customer journey map, you can use HubSpot’s customer journey map template, where you’ll brainstorm what the customer is thinking or feeling, what their actions are, what they’re researching, and how they go from consideration to decision.

Customer journey map template

For more information, you can check out this post on customer journey thinking, and watch the video below to learn more:

Now, you might be wondering, “How do I create an ecommerce customer journey map?”

Well, first you’ll create your buyer personas, and then envision what your ideal customer goes through when they’re seeking your product.

Once you do that, take HubSpot’s ecommerce marketing course, and download our templates, then you can just fill out the template and brainstorm how to improve the journey at every touch point.

Ecommerce customer journey mapping is an essential part of understanding your target audience and improving the customer experience. Focusing on providing the best customer experience will help retain customers and drive more leads and sales.

Apply for a job, keep track of important information, and prepare for an  interview with the help of this free job seekers kit.

Categories B2B

What Is Last Click Attribution and How to Use It

For your team’s marketing efforts to be effective, you need to know which marketing channels and touchpoints are resonating with your audience most — you must understand which channels and touchpoints are so successful at whatever it is they do that they make leads want to convert.

Last click attribution can help you with this — it assists in identifying which marketing touchpoint prompted a conversion in the final part of the buyer’s journey.

→ Download Now: Free Marketing Plan Template

Last Click Attribution Model

In this blog post, we’ll cover all things last click attribution including how it’s defined, what makes it unique, how your marketing team can use it, and more.

Pros and Cons of Last Click Attribution

Last click attribution is helpful if you want to know which of your marketing channels and touchpoints have the most influence in the final stage of the buyer’s journey.

While this is helpful information, it doesn’t account for the numerous other channels and touchpoints that impacted a customer from the very start of the buyer’s journey. This is important to note since there are a variety of touchpoints, across numerous channels, that impact a lead throughout the buyer’s journey — which is why most marketers today refrain from only using last click attribution. Rather, they’ll use multi-touch attribution or include last-click as part of their other marketing attribution efforts.

For instance, say a lead received an email from your email campaign, clicked through to your website, read a blog post, and then decided they wanted to buy your product. Well, last click attribution would only account for that last touchpoint — the blog post. Meanwhile, the other touchpoints throughout the buyer’s journey that contributed to this lead’s decision are dismissed.

That’s why multi-touch attribution has become such a popular attribution model among today’s marketers. Multi-touch attribution accounts for all of these touchpoints and channels and assigns them credit based on their influence.

In addition to last click and multi-touch attribution, you may have heard of first click attribution.

First Click vs. Last Click Attribution

FIrst click attribution differs from last click attribution because it assigns all of the credit for a conversion to the first touchpoint or channel (e.g. interaction on your website or with a marketing campaign) that a customer had before a conversion.

First click attribution is helpful if you want to know which of your marketing efforts are generating initial traffic in the awareness stage of the buyer’s journey.

Similar to last click attribution, this is a helpful attribution method on a small scale — combining it with other attribution methods is recommended in order to get a clear picture of your marketing attribution efforts.

Now, let’s talk about how your marketing team can use last click attribution.

How to Create a Last Click Attribution Report

If you choose to create a standalone last click attribution report, you’ll likely find yourself using an attribution tool.

If you already use an attribution tool, there’s a chance it has a specific report that focuses solely on the last click. There’s also a chance that it offers customizable attribution reports which would also allow you to create a last click report.

Either way, here are a few available options for your consideration as you look to create marketing attribution reports of your own.

1. HubSpot Ads Attribution

hubspot ads software

HubSpot Ads Software offers five attribution models — you can filter your ad campaigns by attribution report to determine how your ads influence contacts throughout buyer’s journey, all from within HubSpot.

If you create a custom multi-touch attribution report, you can hone in on last click/ last interaction data — you can also customize the group of contacts you want to report on, the status of your campaign (“active,” “paused,” or “deleted), and the date range.

Get HubSpot’s Ads Software to use CRM data to create personalized and targeted ad campaigns, and report on the ads that are converting prospects.

2. Google Ads Attribution

google ads attribution reports

Google Ads Attribution gives insight into cross-channel attribution so you have a solid understanding of how your Google Ads perform among your audience — this insight allows you to improve all marketing interactions and touchpoints throughout the buyer’s journey.

Google Ads offers six attribution models, one of which is last click — it gives all of the credit for a conversion to the last event/ last-clicked Google ad and its corresponding keyword.

3. Facebook Attribution

facebook attribution reports

Facebook Attribution gives you a complete look at how prospects and customers are interacting with your business throughout the buyer’s journey via Facebook (including the final stage of the buyer’s journey, when the last click occurs).

Facebook manages giving all of the credit for a conversion to the last click for you — no impressions or earlier touchpoints are credited. If a click occurs within 60 seconds of a visit, Facebook will credit the click.

Get Started With Last Click Attribution

Last click is a great addition to your attribution strategy. By determining what the last customer touchpoint in the buyer’s journey is prior to a conversion, you’re able to understand which interactions and content are likely to heavily influence your customers.

Marketing Plan Template

Categories B2B

What Does HTTP Error 503 (Service Unavailable) Mean & How To Fix It?

Imagine someone searches for a topic and finds your website on page one of Google. When they click through to your website, though, their eyes land on a bland webpage that says “Service Unavailable”.

What do you think they’ll do when they find your website on Google again? Odds are, they’ll skip over it and click on the next link. If visitors are looking for answers and you’re promising them those answers, but you can’t deliver because something’s wrong with your website, they’ll lose trust in your brand.

Unfortunately, if your website experiences a 503 Service Unavailable Error, there’s no silver bullet solution. You have to investigate what’s actually causing the issue, because even though these types of errors indicate what happened to your website, they don’t tell you why it happened.

To help you fix your 503 Service Unavailable Error and avoid losing potential customers, check out our guide on what exactly the issue is and its most common solutions.

→ Download Now: SEO Starter Pack [Free Kit]

When your website is experiencing a 503 Service Unavailable Error, your site’s visitors will land on an error page. Fortunately, there are five common solutions for troubleshooting most 503 Service Unavailable Errors.

1. Restart your server.

Sometimes, there will be congestion in the server chain that hosts your website. One of the most effective ways to open up and refresh it is to simply restart your web server. If your website is hosted on multiple servers, make sure you restart all of them to get it running again.

2. Check to see if your web server is going through maintenance.

Most web servers shut down when they’re going through maintenance. If you can access your server’s administration settings, check the configuration options to see when automatic maintenance sessions are scheduled. If you’d rather have complete control over your server’s maintenance, you can disable these automatic updates in the configuration options, too.

3. Fix faulty firewall configurations.

Your firewall is your website’s gatekeeper, protecting your site from malicious visitors or distributed denial-of-service (DDoS) attacks. Sometimes, a faulty firewall configuration will cause your firewall to deem requests from a content delivery network as an attack on your server and reject them, resulting in a 503 Service Unavailable Error. Check your firewall configuration to pinpoint and fix the issue.

4. Sift through your server-side logs.

There are two types of server-side logs — applications logs and server logs. Application logs recount your website’s entire history, letting you see the web pages requested by visitors and the servers it connected to. Server logs provide information about the hardware running your server, revealing details about its health and status. Sift through both types of server-side logs to uncover any alarming information about your server or website.

5. Comb through your website’s code to find bugs.

If there’s a mistake in your website’s code, your web server might not be able to correctly answer requests from a content delivery network. Comb through your code to find bugs or copy your code into a development machine. It’ll perform a thorough debug process that will simulate the exact situation your 503 Service Unavailable Error occurred in and allow you to find the exact moment things went wrong.

Any time there’s an error on your site, it’s important to fix it as soon as you can. If customers get errors, they probably won’t come back to your page.

Editor’s note: This post was originally published in January 2019 and has been updated for comprehensiveness.

marketing

Categories B2B

How Apple’s iOS 14.5 Release Could Impact Advertisers

Imagine this: You run a successful online store and have a sleek app that makes shopping a breeze.

Most of your sales come from paid ads on Facebook and Instagram, and your usual process involves retargeting customers who open your app but leave without purchasing anything.

The more app installs you get, the more sales you log. This process is seamless because you’re able to track user activity across apps and optimize your ad spend as you see what works and what doesn’t.

But, with this week’s release of IOS14.5, the data you collect from Apple mobile devices will change. Here’s how.

Take HubSpot's free Inbound Certification course to learn how to build an  inbound strategy for your business.

Apple’s New Privacy Policy

Apple has confirmed that along with the launch of iOS14.5, there is also a change coming to Apple’s AppTrackingTransparency (ATT) Framework, which is essentially its data sharing and privacy policies.

Apple will now require that all mobile app advertisers gain opt-in from users to track their web and app activity.

While this provides consumers with the ultimate privacy, security, and control over the ads they see across their web and mobile devices, it’s expected that not all users will accept this prompt to opt-in. This could make it more difficult for businesses to reach their target audience, and deliver relevant ads.

From now on, whenever an Apple user downloads your app, they’ll be shown a prompt, asking if it’s okay for the app to track them. Additionally, with limited app user data, companies like Google report that ads could show poorer performance and returns than before the change.

While Apple’s pivot might seem shocking, it is not the first major tech giant to take action when it comes to data privacy. Just in the last year, Google, another major player in the advertising world, announced that it will phase out third-party cookies on Chrome and will be offering replacement tracking tools, such as its Privacy Sandbox, after 2022. You can read more about that news here.

What will happen to Apple’s IDFA (Identification for Advertisers)?

To better understand what’s happening with Apple’s new update, let’s take a moment to learn about Apple’s identifier for advertisers (also known as IDFA). IDFA is tied to each Apple device and is used by advertisers to identify users.

Typically, the IDFA code is visible to advertisers, and it enables them to retarget consumers. Now, it will only be provided to advertisers if users give them the go-ahead and permission to track their usage across apps.

To prepare app owners, Apple has laid out the instructions for gaining proper tracking permissions on its website:

“You must also include a purpose string in the system prompt that explains why you’d like to track the user. Unless you receive permission from the user to enable tracking, the device’s advertising identifier value will be all zeros and you may not track them,” Apple explains.


How this Affects MMPs (Mobile Measurement Partners)

Traditionally, MMPs have been able to pull data from mobile apps and serve up data such as installs, views, and ad clicks, in an organized and insightful fashion. They provide advertisers an understanding of where their consumers come from, and what the results of a mobile campaign are, within their platform. With the changes coming to ATT, their ability to have access to all this could be diminished.

However, some MMPs, like AppsFlyer, are leaning into Apple’s SKadNetwork to glean insights for their mobile advertisers.

The SKadNetwork is a secure way for MMPs and advertisers to understand app installs and campaigns, without connecting those installs to specific user identities. Apple coordinates this attribution, and while using the SKadNetwork is a good alternative, it does not take into account view-through attribution and only provides data 24 to 28 hours after the first launch.

The Early Response to Apple’s Privacy Pivot

As you can imagine, this new update has caused ripples across the mobile advertising ecosystem, and brands like Facebook have already responded.

“Apple’s policy will prohibit certain data collection and sharing unless people opt into tracking on iOS 14 devices via the prompt. As more people opt-out of tracking on iOS 14 devices, ad personalization and performance reporting will be limited for both app and web conversion events,” says a Facebook for Business statement.

Meanwhile, Google, which has also been taking on its own privacy initiatives, provided information for developers and advertisers about how the change will impact them while also reminding readers of the importance of user privacy:

“At Google, we’ve always put users and their privacy first. Transparency, choice and control form the bedrock of our commitment to users, and advertising is no different. We remain committed to preserving a vibrant and open app ecosystem where people can access a broad range of ad-supported content with confidence that their privacy and choices are respected,” the Google post explains. “That’s why we’ll continue to invest in privacy-preserving technology ― including aggregated and on-device solutions ― like what we’re developing for the web, along with ecosystem partners, in the Privacy Sandbox.”

Quick Tips for Navigating Apple’s Privacy Changes

While this change will likely impact your current ad campaigns, and the size of its impact is still somewhat uncertain, there are a few areas you can still lean into and optimize your content for the right audiences:

  • Don’t forget about Android campaigns: the iOS 14.5 update only affects Apple devices and users, so you can still segment your audiences by Android users and target them.
  • Turn to your website: Use your website’s tracking capabilities or analytics tools to understand where your visitors are coming from, and create audiences based on those visitors.
  • Amp up organic efforts: take a closer look at your organic social media and content strategy. Then use that data to strengthen your brand.

While the times ahead are uncertain and may not seem as ideal for marketers and advertisers, the industry is likely to evolve and find ways to reach prospective customers. As Apple rolls out this update, we’ll be paying close attention to how advertisers respond and will continue to update this post in the future.

Disclaimer: This blog post is not legal advice for your company to use in complying with data privacy laws like the GDPR. Instead, it provides background information to help you better understand current privacy shifts. The tips provided are not the same as legal advice, where an attorney applies the law to your specific circumstances, so we insist that you consult an attorney if you’d like advice on your interpretation of this information or its accuracy.

In a nutshell, you may not rely on this as legal advice, or as a recommendation of any particular legal understanding.

Start the free Inbound Marketing Certification course from HubSpot Academy.

Categories B2B

The True Impact of Social Analytics on B2B Funnels

For B2B sales and marketing teams, few metaphors are as powerful as the sales funnel.

It’s a near-supernatural, multi-layered vortex that pulls in leads from the wider world, then draws them down toward closing. At the top of the funnel (TOFU) are fresh new leads who are just discovering your offerings. In the middle of the funnel (MOFU) are leads who are interested to learn more. Finally, at the bottom of the funnel (BOFU) are those leads who are poised and ready to make a purchase.

Modeling your sales funnel so you can better target and nurture leads at each layer is critical to increasing your conversion rate. But for accurate modeling, you need a lot of reliable data. And one major opportunity for collecting that data lies in your social media tools.

The importance of social media in marketing is unquestionable. In fact, businesses that market on social media are 40% more likely to hit their sales goals. Plus, a whopping 95% of buyers purchase from sellers who provide content that addresses their concerns and questions at each sales funnel level — and, nowadays, a lot of that content is posted on social platforms.

But the question remains: How can you measure and analyze the true impact of social activity on your sales funnel?

Here, we’ll explore what social media data is, and how you can use that data to strengthen your B2B sales funnels.

→ Free Download: Social Media Calendar Template [Access Now]

What is social media data?

Social media data (or social analytics — the terms are interchangeable) includes any information gleaned from the activity of visitors, prospects, and leads on your social media channels. Any data you obtain when someone interacts with your profile or content on LinkedIn, Facebook, Instagram, Twitter, or any other social media channel counts as social data.

Specific metrics can vary from platform to platform. However, the following social data points are common to all of them:

  • Shares/reposts
  • Likes
  • Comments
  • Mentions
  • Impressions
  • Conversions
  • Clicks

Clicks can be the most revealing of all social data points. Many outside factors can determine what post a visitor might choose to comment on or share. Click metadata can tell you what types of content they would like to explore further.

Why is social media data important to B2B funnels?

You can’t analyze the efficiency of your B2B social media marketing efforts without raw data. With so many marketing activities and steps in the buyer’s journey taking place on social media, analytics without social data won’t yield many useful insights.

With social analytics, you can answer some crucial questions about whether your social media activities can help you meet your goals. Analytics help answer questions such as:

  • Which social media platforms are generating the most leads?
  • What kind of content is making our audience click, share, and convert the most?
  • What are our top-converting posts?
  • Are our audiences more interested in engaging with TOFU, MOFU, or BOFU content?

By analyzing the right social data, you can learn what is and isn’t working — and then tailor your social media marketing strategy accordingly.

How Social Media Data Impacts Your B2B Funnels

Many aspects of the marketing, sales, and product development processes feed into modeling your sales funnel. The goal is to create a funnel that effectively addresses your buyer’s needs and brings them closer to closing a sale. Within this process, there are two critical areas where social data analytics are especially beneficial.

1. Lead Enrichment

Lead enrichment involves supplementing, correcting, and normalizing your data on a lead. The goal is to establish a more in-depth, up-to-date, and accurate picture of who your leads are and what they want. You can automate lead enrichment by importing third-party data into your CRM. You can also accomplish the same outcome by conducting manual research and verification on leads.

Lead enrichment makes it easy to perform several associated functions that will improve your sales funnel’s efficiency. These are:

Lead Scoring

Image Source

How do you know which leads are eager to buy and which ones are just looking? The solution is to quantify their signs of interest, assign them a score, and rank them.

The process of lead enrichment ensures you aren’t missing essential information about your lead, such as whether they are a decision-maker at their company. Social data can provide evidence of their signs of interest, as shown through their social media page interactions.

Lead Segmentation

A lead with a low score isn’t necessarily one you should ignore. However, a low-scoring lead might need different levels of attention or types of content.

The same goes for leads showing the same level of interest. If they’re in different industries or countries, the same approach might not work on all of them.

Social data can enrich your lead profiles with these details. Then you can segment your leads into separate audience groups, which enables you to target each group with custom-made content to address each group’s top concerns.

Lead Nurturing

You move a lead from one level of your sales funnel to the next by nurturing them.

Lead nurturing is accomplished by providing leads with content that answers their questions, addresses their concerns, and builds interest in your offers. The more data you have on your leads, the more hints you have about creating content most likely to engage them.

Lead Attribution

It’s great when your latest lead steps up engagement within your sales funnel. But if you don’t know what motivated them to provide their contact information, download that ebook, or request pricing, you’re missing out. That kind of knowledge is vital to improving your sales processes.

Enriched leads and social data analytics strengthen your attribution models. Lead attribution gives you the best chance of finding out which content deserves credit for the conversion.

2. Perfecting Your Messaging

The second key area impacted by social data is your messaging. Ultimately, all of your content is just a form of communication between you and the buyer.

When your messaging is perfect, it strikes the right tone, and speaks to your lead’s most pressing concerns — while also entertaining and educating. That’s when you know you’re putting your best effort into closing the sale.

When your messaging falls short on these fronts, leads can lose interest and drift away.

So, how do you perfect your messaging? The two easiest ways are through personalizing your sales outreach, and creating more engaging content.

Personalize Sales Outreach

Social data can tell you what your leads are most interested in and which channels are best for reaching them. This information allows you to personalize your sales outreach.

Let’s look at how this works in practice. Say you have a lead who consistently likes your tweets about a specific function of your product.

From that small piece of data, you can create a personalized outreach. A Twitter DM might be a great way to make a “sales call” — and now you have an even better idea for a good conversation starter.

Create More Engaging Content

Image Source

Content that engages is critical to move leads toward conversions. But what content should you be making to engage more leads?

First, step back to take a broader view of what your social data is telling you. Measuring how and where your leads engage with your sales funnel allows you to create more engaging content at all levels.

Let’s say you’re doing well at moving leads through the MOFU and BOFU, but many of them seem to get stuck in the TOFU. The leads who spend the most time in the TOFU aren’t converting their way further through the funnel at high enough rates.

Through careful parsing of your social data, you discover that the leads that slowly escape the TOFU heavily engage with your video content. This data tells you that you probably want to have video as a more significant share of your TOFU content.

It’s true that collecting, organizing, and analyzing raw social data can be overwhelming at the outset, but having the right resources can take a lot of the difficulty out of this endeavor. Tools like Oktopost can help you automate and optimize your social data processes, making it easy to finetune your content at every level of the sales funnel.

By leveraging social data to create better B2B sales funnel models, you will reap the benefits of its true impact with higher engagement rates, more conversions, and better ROI.

social media content calendar