Categories B2B

Cumulative Layout Shift: What It Is and How to Measure It

We’ve all had it happen to us: we try to choose an option on a website, and right before we click, the page jumps away and we end up clicking something we didn’t mean to. Doh!

Like a game of “down low, too slow”, this website behavior makes us feel slow and frustrated. Fortunately, website developers are now incentivized to improve their site experience with the release of Google’s Core Web Vitals; a set of metrics that help site owners measure and improve the user experience of their web pages.

→ Download Now: SEO Starter Pack [Free Kit]

Cumulative Layout Shift is one of these key metrics that measures the “jumpiness” of a website and how it unexpectedly moves as elements load. Let’s take a closer look at how this metric works, and how you can make sure your own website is following best practices so you rank higher on search engines and provide your users with a better experience.

What is Cumulative Layout Shift?

Cumulative Layout Shift (or CLS) is a measure of how much a webpage unexpectedly shifts during its life. For example, if a website visitor loaded a page and, while they were reading it, a banner loads and the page jumps down, that would constitute a large CLS score.

Along with Largest Contentful Paint (the amount of time it takes to load the largest piece of content) and First Input Delay (how long it takes for a page to be interactive or “clickable”), CLS is part of Google’s Core Web Vitals. Google’s web crawlers measure CLS on each page they index.

What causes Cumulative Layout Shift?

Page shifts happen when content loads at different speeds and causes the layout to change and alters what the viewer is looking at. Advertisements loading slowly, videos of unknown size suddenly appearing, or DOM elements being dynamically added are all potential causes of CLS.

The example below shows what happens when an ad banner is loaded after the rest of the webpage loads. The content is pushed down, and the user experience is negatively impacted.

Source

It can be difficult to know if your users are experiencing CLS, because not every device or environment operates in the same way. If you’re loading your website in a development environment you may have elements cached or they may be loading locally. Personalized web content based on cookies will behave differently for every visitor, especially depending on their location. Plus, mobile users can have a very different experience – a small shift on a web browser may be monumental to someone viewing the site on a small screen. Really the only way to understand your users’ experience is to measure CLS, which we’ll go over below.

Why is CLS important?

Understanding CLS is critical for two reasons: your visitors’ experience and your search engine ranking.

Your visitors have high expectations when it comes to your site’s performance. In 2020, 93% of people reported leaving a website because it didn’t load properly.

Jumpy websites that load in pieces or with unexpected behavior will cause your visitors to find another website to browse. And if they do stick around, a high CLS score is likely to cause usability problems like choosing the wrong option, checking out too early, or missing parts of your website altogether.

This problem is only exacerbated by the large number of internet users who are browsing on their smartphones. When viewing your site on a small screen, any jumps and layout shifts on the website are certain to have a big impact on mobile user experience.

Optimizing your site and reducing your cumulative layout shift is essential to providing customers with a good experience.

Secondly, Google ranks sites based on their page performance. A better user experience results in a higher search ranking. If your page doesn’t meet the standards that Google lays out in their Core Web Vitals guidelines, your site will be penalized.

Google doesn’t want to direct people to sites that don’t perform well. Aligning with CLS best practices can help your website move up the rankings. And since 68% of online experiences start with a search, making sure your site shows up on the search results page is important to generating inbound traffic.

How do you measure Cumulative Layout Shift?

The good news is that you don’t have to measure CLS yourself because Google makes it really easy to analyze your page performance with their PageSpeed Insights tool, or in the Chrome browser using Lighthouse Tools.

To analyze performance in PageSpeed Insights:

  1. Enter a website URL into Google’s PageSpeed Insights tool.
  2. Click ‘Analyze.’
  3. Check your performance. You can review both mobile and desktop performance, which you can switch between using the top left corner navigation.

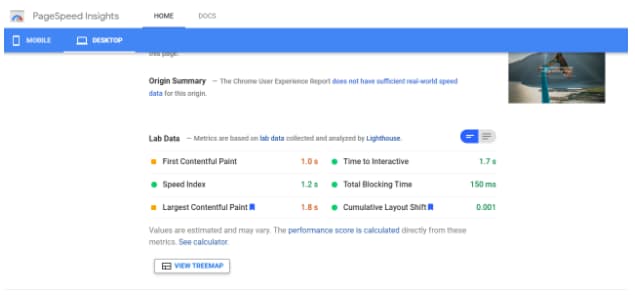
The page analyzed below shows a good cumulative layout shift score of 0.001.

pagespeed insights exampleTo analyze performance using Lighthouse tools:

  1. Open up the website you want to analyze in Chrome.
  2. Navigate to Developer Tools by clicking the three dots in the top right corner of the browser window, choosing “More Tools” and then “Developer Tools.”
  3. When the console opens, choose “Lighthouse” from the options along the top.
  4. Click “Generate Report.”

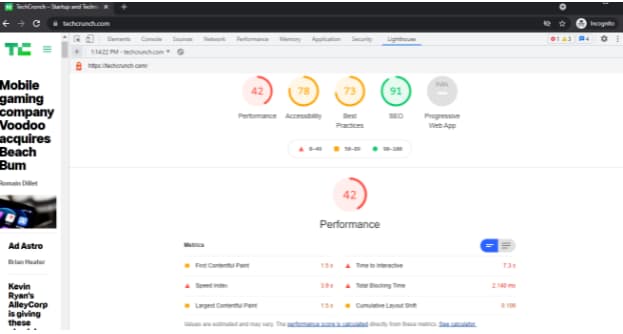
The page below shows a CLS of 0.109, or “needs improvement.”

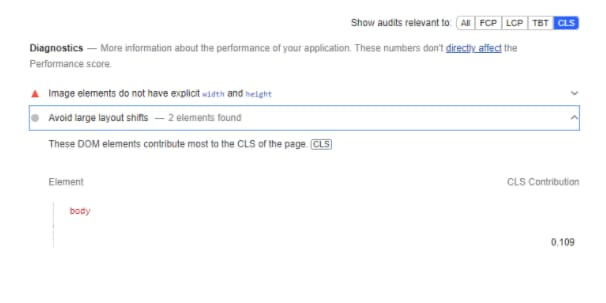
CLS score example Lighthouse provides a detailed audit of what contributed to that score. To review the audit, scroll down and choose “Show audits relevant to CLS.”

lighthouse audit example

More About Impact Fraction and Distance Fraction

Two terms you might see when researching CLS are “impact fraction” and “distance fraction.” These are the two variables that Google uses to calculate CLS.

layout shift score = impact fraction x distance fraction

Impact fraction relates to the size of the unstable element in comparison to the viewport. Distance fraction is the amount the unstable element moves as a ratio of the viewport.

So a high CLS would consist of a large element moving a long distance. A small CLS would be the result of a small element moving only a small distance.

CLS is the largest “burst” or group of layout shift scores that occur during a session window. Essentially, if a bunch of shifts happen within a five-second window, this would be considered disruptive and result in a large CLS score.

What is a good CLS score?

A good cumulative layout score is anything less than 0.1. The reports from PageInsights or Lighthouse tools will automatically flag any poor scores, as well as provide advice on how to optimize the page for better performance.

cumulative-layout-shift-1Source

How To Improve Cumulative Layout Shift

There are a few best practices that website owners can follow to improve their CLS score:

1. Use a CMS (content management system).

Especially one that integrates with Google Lighthouse or other diagnostic tools. This will make sure that you’re designing with best practices in mind, and flag any issues before you launch your site.

2. Specify size attributes for images and videos.

Rather than letting them set their own height and width, dictate size attributes for your media. By setting these attributes, you’re telling the browser how much space to set aside, even if the image isn’t loaded yet.

3. Understand how ads can influence your layout.

Google Publisher Tag offers extensive guidance about how to reserve space for ads.

Load new content below the viewport. Loading content above what the user is viewing will often cause a page to shift.

4. Use transitions and animation to provide context around page changes.

For example, a “Read more” link that scrolls the user down the page would not impact CLS because it’s an expected layout shift.

A Note On Expected Vs Unexpected Layout Shift

CLS only takes into account unexpected changes. If the layout changes because of a user-initiated action, there is no impact on CLS. This is a helpful tool to use when you don’t need to load everything all at once. Instead, offer users the opportunity to choose which elements they want to view through “read more” links or “expand topic” accordions within your page.

Offer A Better User Experience With CLS Optimization

Paying attention to CLS not only provides a better user experience, but it also boosts your search result rankings. It’s a win-win.

To meet Google’s standards for CLS, start by using a diagnostic tool to measure your website’s current performance. Take into account the basic guidelines outlined above, and keep layout shifts top of mind when designing your website, especially around transitions and content additions. With these few simple considerations, you’ll see better results across the board.SEO Starter Pack

Categories B2B

A Simple Guide to Lean Process Improvement

There are many businesses out there that operate with a mindset of “Well, that’s how we’ve always done it.” Unfortunately, this type of close-minded thinking can lead to a great deal of waste.

Tasks may be unnecessary to achieve the final goal, processes may be repeated multiple times when one would be sufficient, employees may be wasting time on superfluous responsibilities, and materials may be wasted during manufacturing.

When this occurs within an organization, employee satisfaction decreases so turnover increases, quality suffers so customer satisfaction and retention is decreased, and one look at the books will likely indicate the company is hemorrhaging money.

Download Now: 2021 State of RevOps [Free Report]

You might think that this type of operational inefficiency only occurs in large corporations and organizations, however, it’s just as prevalent in small-to-medium-sized businesses and can be seen throughout every department.

Efficiency is the name of the game for successful businesses, and you’re about to learn one of the best ways to turn your business into a lean, mean, money-making machine.

Lean Process Improvement

What is lean process improvement?

Lean process improvement is a concept originally developed by Toyota to decrease the amount of time it took from receiving an order to delivering it. While lean process improvement is often discussed in a production environment, the concept can be applied to service, healthcare, technology, and even government.

Consider a marketing department that has multiple people working on the same project but not communicating. Rather than each handling a specific aspect of the campaign, several people tackle the same task while other activities go unhandled.

It’s not a traditional production environment, however, the team could benefit from creating an easy-to-follow process that looks at the desired end product and finds the simplest route to get there.

The whole idea behind this way of thinking is that when you look at the big picture, you can find ways to eliminate waste, whether that’s financial, physical, time, or employee energy that could be spent elsewhere. This concept may take a while to implement, and that’s okay. It’s not meant to be a short-term solution, but rather a change to the entire mindset and culture of a business.

What are the benefits of lean process improvement?

Businesses that incorporate lean process improvement see a variety of benefits from this shift. These include:

  • Less waste
  • Less inventory
  • Increased productivity
  • Better quality
  • Happier customers
  • Fewer costs
  • More profits

It makes perfect sense that when you remove the redundancy, streamline processes, and create less waste, your bottom line will increase. When your customers receive their product faster and with less hassle, you’ll have happier customers who return and recommend you to others. With more customers, your bottom line increases once again.

If you’d like to see this type of improvement in your organization, read on to learn lean process improvement steps.

How do I incorporate lean process improvement into my business?

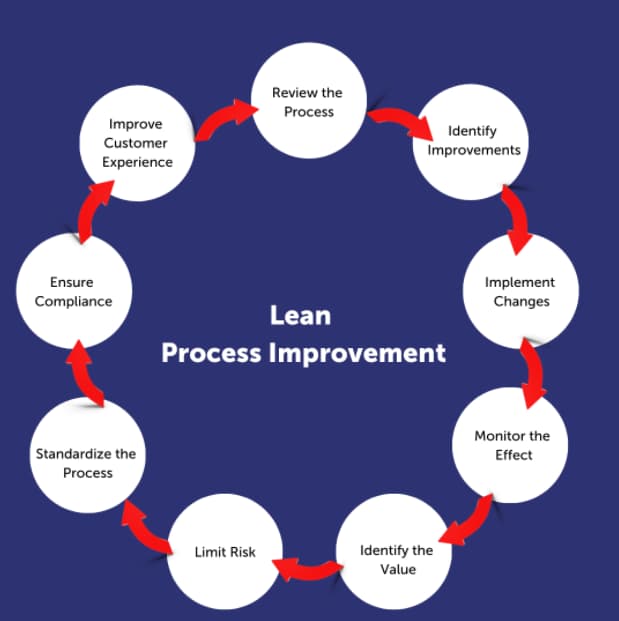
You guessed it … there’s a process to lean process improvement. There’s actually a series of nine steps you’ll need to implement to create this level of efficiency in your organization. Let’s take a closer look at lean process improvement steps.

steps of lean process improvement

1. Review the process you want to improve.

This step is essential because if you don’t know what you need to work on, you won’t know where to focus your efforts. In order to do that, you need to talk to employees on the front line.

The biggest mistake companies make during this process is implementing changes without ever speaking to the people who do the job day in and day out. Interview your frontline workers, and ask them what’s not working well in their daily routine.

2. Identify what improvements need to be made.

Once you’ve identified what needs to be fixed, it’s time to involve your team once again. There’s a very good chance that they already know how to fix the problem and just haven’t been able to implement it because of a “That’s-how-we’ve-always-done-it” mindset.

3. Implement the suggested changes.

How will you put the changes into action? Create a plan so everyone involved understands and buys into the process. This is the best way to ensure organization-wide success.

4. Monitor how the changes are impacting your efficiency.

While it would be great if your first attempt at execution was a success, the reality is that once the process is tested in the field, it will need to be further refined. The only way to do this is through constant monitoring and reevaluating. As new issues appear, you can address them and make the necessary changes.

5. Identify what activities add value.

Throughout these steps, you’ll be assessing every single action and every aspect of your process. During this time, you must evaluate every single activity to determine whether it adds value to your process, or detracts. If an activity is deemed unnecessary, it should be removed and the process tested without it.

6. Limit risk.

Production and often business, in general, is inherently risky. This time should be used to identify any risky activities or aspects that are part of the current process and eliminate or simplify these tasks. This may involve automating an activity or simply changing the way in which it’s executed.

7. Standardize the process.

As you create and refine the process, document your progress thoroughly. This allows the process to be repeated, properly, by other employees or depending on the specific process, by other teams or departments in your organization.

8. Ensure compliance.

While lean process improvement should be a company-wide shift in culture, your industry or governing body may have specific metrics, procedures, and standardized measurements that you must adhere to. Compliance may not be sacrificed in the name of efficiency.

9. Improve the customer experience.

In determining the success of a lean process improvement plan, Marketers consider the customer experience to be “the moment of truth.” Ultimately, whatever improvements you make during production or service must trickle down to positively impact the customer.

Lean Process Improvement Tools

As you embark on this journey, there are a number of tools available to you. These tools can help you organize your thoughts, identify issues, and implement your plan. The following are just some of the tools you can look to for support.

Just like any other tool, the one you choose must be the right one for the current job. If you start out with one and don’t find that it meets your needs, consider trying another.

  • Why Analysis: By asking “Why?” repeatedly, you can identify the root cause of the challenges you’re experiencing.
  • Ishikawa Diagram: Also known as a “Fishbone diagram” or “cause-and-effect diagram”, it allows you to examine a problem from multiple angles, including measurements, materials, people, methods, machines, and environment.
  • Affinity Diagram: This works great in the early stages of lean implementation as it can help sort and organize large amounts of data. Identify the value you bring to the customer and then uncover problems with your existing processes.
  • FMEA Analysis (failure mode and effects): Catching issues before they get out of hand can help you eliminate waste and save money. This tool allows you to examine your flow and identify problems early on.
  • 5S Dashboard: This approach can help you organize your workspace for maximum efficiency. While the original tool has five S’ based on Japanese terms, many businesses have added a 6th practice. These stand for:
    • Sort
    • Set in order
    • Shine
    • Standardize
    • Sustain
    • Safety
  • Plan Do Check Act (PDCA) Cycle: Create continuous improvement by repeatedly analyzing a problem, testing a hypothesis, reviewing, and then analyzing the results, and finally, putting the plan into action once it’s successful.

Lean Process Improvement Techniques

There are a number of approaches that have been created to assist in lean process improvement. Just like the tools, it’s important to find the right technique for your project and your organization. For example:

Six Sigma (DMAIC Model)

With a goal of reducing the variation in processes, Six Sigma works to increase both external and internal customer satisfaction by standardizing workflow. The DMAIC Roadmap stands for:

  1. Define
  2. Measure
  3. Analyze
  4. Improve
  5. Control

Kanban

These boards allow you to visualize your workflow and use value stream mapping to break down your workflows into stages. Having a visual representation of your workflow, and all the activities that make it up, can assist you in identifying inefficiencies.

Sharing this board with your entire team allows anyone to stop the process when a problem occurs. Now, it becomes everyone’s job to find a solution.

WIP Limits

Within Kanban boards exist a concept known as WIP Limits or “Work in Progress Limits”. Every stage in a Kanban board workflow is represented by a column. WIP limits force you to stay under a maximum number of work items for each stage. This can be per person, per work stage, or for the entire project.

Having these limits in place ensures that current tasks are finished before new ones are started, and helps to complete activities faster.

Final Thoughts on Lean Process Improvement

Now that you understand how important lean process improvement is to a successful, efficient organization, it’s a good time to reiterate that this is an ongoing process. If you attempt to overhaul your entire organization overnight, you will undoubtedly fail and most likely make things worse than when you started.

Identify the biggest sources of inefficiency in your organization and target these first, one at a time, until you’ve created a well-functioning business.

Finally, remember that your most valuable assets are the employees getting their hands dirty every day. Attempting to identify problems and create solutions without getting their input is akin to driving blind when you could simply open your eyes.New call-to-action

Categories B2B

How Do Conversion Paths Work? A Step-by-Step Guide

As a marketer, a big part of your job is to convert qualified website visitors into leads. Simple enough.

More specifically, inbound marketing requires you to create remarkable content they’ll want to trade their contact information for. From there, those leads turn into opportunities, who turn into customers and even promoters.

Clearly, conversions are a big deal. So how can you optimize yours? By creating conversion paths optimized to most effectively convert your ideal visitors into leads.

Download Now: Free 8-Week Conversion Rate Optimization Planner

While not all conversion paths are identical and depend on the type of business they’re for, they have a few common attributes: a landing page, a call-to-action, a content offer or end point, and a thank you page.

  • Landing page: A landing page is a specific page on your website designed to collect a visitor’s contact information in exchange for a resource, like a course, ebook, or other product.
  • Call-to-action: A call-to-action is a section on a webpage or advertisement that persuades the visitor to act or do something. These can take the form of buttons prompting website visitors to sign up, subscribe, or buy a product.
  • Thank you page: The thank you page shows your visitors that you appreciate them for taking a desired action. For example, a thank you page might appear after a visitor has signed up for a newsletter or filled out a form.
  • End point: This may be in the form of a content offer, which is any material or resource given to a visitor in exchange for their contact information, completing the conversion path. These materials could be guides, ebooks, courses or other products. For e-commerce, instead of a content offer, a conversion path may end in a purchase.

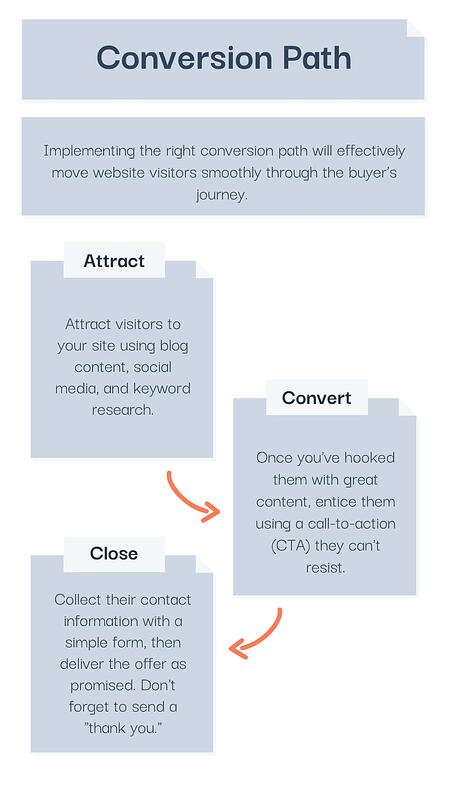
Conversion Path

In order to convert into a lead, a visitor sees a content offer of interest to them (or product in the case of e-commerce), clicks on the call-to-action button to access that content, and is then taken to a landing page. On that landing page, the visitor can provide their information on a form in exchange for access to the offer itself. Upon submitting that form, the now-lead is taken to a thank you page where they receive the offer.

Voila! Conversion path complete.

By designing and implementing the right conversion paths, you can most effectively move website visitors through the buyer’s journey and help them become customers and promoters.

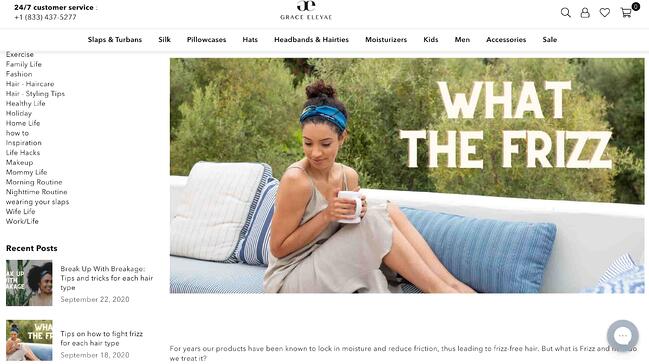
Conversion Path ExampleConversion path example landing page

Let’s say you’ve been lured to the landing page above after searching online for tips for preventing frizzy hair.

You’re then prompted by a CTA (pictured below) that invites sign up for their email list in exchange for 10% of their products.

Conversion path example CTA You decide you’d like to try one of their satin-lined caps to fight frizz and take them up on the offer.

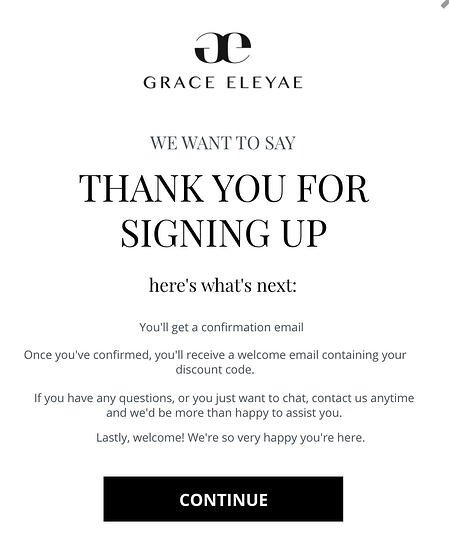
conversion path example thank you page A thank you page pops up once you’ve filled out the form giving instructions on how to access your discount code. Once you get the code from your email, you use it to purchase one of their caps. Ta-da! The conversion path is complete.

What makes a good conversion path?

Well as you might have guessed, you need content, a call-to-action, a landing page, and a thank you page. But with so many conversion paths out there on the internet for your potential customers to explore, it’s more important than ever to create the RIGHT paths — paths that your ideal customers are drawn to and most effectively convert the right visitors into leads.

What are the steps to creating a conversion path?

Let’s explore the key items you need in your inbound toolkit to create effective conversion paths that turn casual visitors into customers.

1. Attract your target audience with context-appropriate content.

Content is the fuel that powers effective inbound strategies—and it’s what you’ll use to convert those website visitors into leads. The good news is that content is everywhere! Content is what your website pages are filled with, what goes into your emails, and what’s hosted on your blog — your website pages, emails, and blog are just vehicles to deliver that content.

Although content is in no short supply, in order for it to act as your inbound rocket fuel, you need to create the right content. As you can probably guess, the right content is optimized to appeal specifically to your buyer personas. It should focus on the challenges they’re trying to overcome and the goals they’re looking to hit. Most of all, it should be relevant and interesting to them.

But here’s the kicker — it’s not enough to just create persona-specific content. That content needs to be relevant to your persona based on where they are in the buyer’s journey.

The buyer’s journey is the active research process your personas go through leading up to making a purchase — and specific content is more relevant to your personas at different stages of that journey. This is where the “context” piece comes in: It’s not enough to just create content for your personas. You have to make sure that content is relevant to what they’re interested in and hoping to learn more about.

Most visitors to your site are still at the very beginning stages of that journey — they might not even know what your product does or how it can help them. All they may know is that they have a problem or there’s an opportunity at hand. So, the content that will most appeal to your personas when they’re first visiting your website and converting a lead will generally be high-level and educational in nature.

In order to be an effective tool in your conversion path toolkit, make sure you have remarkable content tailored to your buyer personas and where they are in the buyer’s journey.

2. Create landing pages that speak to your personas.

After you’ve developed a remarkable content offer that speaks to both who your personas are and where they are in the buyer’s journey, the next step is to leverage that piece of content to convert website visitors into leads. That’s where landing pages come in.

Landing pages are specialized website pages whose sole purpose is to collect visitors’ contact information in exchange for something of value to them. Landing pages contain forms that potential leads must fill out and submit before getting access to your remarkable content offer. And like that offer, great landing pages must also be tailored to both who your personas are and where they are in the buyer’s journey.

In order to most effectively convert website visitors into leads, your landing pages must present the benefits of your offer that are most relevant to the particular problem your persona is experiencing — and discuss the aspects of that problem that are most important to where your persona is in the buyer’s journey.

Imagine, for example, you work at a pet store and have created an ebook on raising a puppy. Someone who’s at the beginning of the buyer’s journey probably won’t be too interested in downloading your ebook if your landing page talks all about how your ebook contains the best techniques for housebreaking. Instead, an effective landing page for this persona might highlight how your ebook discusses how to choose the right dog breed for you.

Great landing pages focus on both who your personas are and where they are in the buyer’s journey.

3. Use attention-grabbing calls-to-action.

While having a remarkable content offer and great landing page are key to creating a successful conversion path, your website visitors need a way to actually access that landing page in the first place. That’s where calls-to-action come in.

Calls-to-action or CTAs, are buttons you can embed throughout your website that advertise your content offers. When a visitor clicks on one of these calls-to-action, they’ll be taken to your landing page. In effect, every call-to-action you have on your website is the beginning of a conversion path.

To create calls-to-action that get those clicks and act as key steps within your conversion paths, you must ensure that the message displayed on your call-to-action aligns with the message on your landing page — and the content itself.

Great calls-to-action should be just that: action-oriented. Since their main objective is to garner clicks and direct people to landing pages, ensure that they’re click-worthy by using actionable language and colors that help them stand out from the rest of your website.

4. Close the deal with optimized thank you pages.

If a call-to-action is the beginning of a conversion path, a thank you page marks its end. Thank you pages are the final item you need in your inbound toolkit to lead your website visitors down a conversion path to become, well, a lead.

Thank you pages are specialized website pages from which your now-leads can download the offer promised by your call-to-action and landing page. They’re also an opportunity to move people further along in the buyer’s journey, by including things like additional calls-to-action that complement the offer you’ve just provided your lead.

Improving the Mobile Conversion Path Experience

Designing for mobile is no longer optional, it’s a must. According to a 2020 report from Global System for Mobile Communications Association (GSMA, formerly Groupe Spécial Mobile), nearly half the world’s population uses a mobile device to access the internet. By the end of 2019, 3.8 billion people were mobile internet users, an increase of 250 million users from the previous year.

With those numbers in mind, there’s a good chance visitors will access your website from their phone or tablet versus a desktop. If you want to create an effective conversion path, It’s imperative to consider the mobile user experience. Follow these steps to create a mobile conversion path that sets visitors up for success.

  • Start with a responsive design: A responsive design adapts to both desktop and mobile devices by rendering the display differently based on screen size. Visitors won’t have to pinch or zoom in while browsing your website via mobile, which leads to a better user experience. Additionally, having a responsive design signals to Google that your site is mobile-friendly, which will help improve your rankings in search results for mobile users.
  • Nix cluttered landing pages: When it comes to smaller screens, minimalism is a virtue. Having long-form, relevant content, images and video may translate well on desktop, but can be too busy for mobile devices. Avoid unnecessary text, images, and features that may make it difficult for visitors to find the information they’re looking for. Visitors can’t become leads if they can’t navigate your website. Consider the information most relevant to your audience, and leave out the rest.
  • Keep CTAs to a minimum: As noted above, with smaller screens you’ll want to take extra care with how that real estate is allocated. Opt for one (or a few), clear call-to-action button as the main focus that your potential customers can easily find. Keep sign-up forms short, only asking for the information you absolutely need. Avoid burying the call-to-action at the bottom of the page after several paragraphs of text. In most cases, mobile users will not scroll down to the end of the page to see it.

As people become increasingly attached to their phones, taking the mobile user experience into account will improve your chances of converting more leads.

Conversion paths are invaluable in inbound marketing as they convert website visitors into leads. When done right, an effective conversion path can move leads beyond an initial conversion, ultimately turning them into customers.

Editor’s note: This post was originally published in May, 2014 and has been updated for comprehensiveness.

Get the 8-Week CRO Planner

Categories B2B

The HubSpot Blog’s 2022 Marketing Industry Trends Report: Data from 1,000+ Global Marketers

The only constant in the world of marketing is that things are always changing.

And, if you’re a marketer, business leader, or entrepreneur aiming to plan an effective 2022 strategy that puts you far ahead of your competitors, you probably want to know:

As the HubSpot Blog’s Research Analyst, I launched our Marketing Industry Survey to help fellow bloggers and readers answer the questions above — and gain further industry insights into 2022 planning.

→ Download Now: Free Marketing Plan Template

Our Survey Sample

We surveyed 1,067 global marketers from across B2B and B2C companies from small to large employee sizes. The sample included professionals at varying experience levels from seven countries: the U.S., Australia, Canada, Germany, UK, France, and Japan.

Read on to learn about some of the most interesting key findings, get strategic recommendations based on our data, and find even more blog content that dives even deeper into our research.

Which trends are marketers already leveraging today?

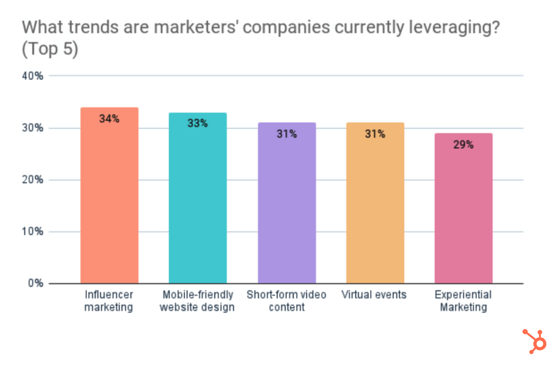
Influencer marketing, mobile-friendly website design, short-form video, virtual events, and experiential marketing are the top trends marketers currently leverage.

These trends will see continued growth in 2022 as most marketers will increase their investment in them or continue investing the same amount.

Let’s dive into each trend and how marketers are thinking about them moving into the next year.

1. Influencer Marketing

While influencer marketing was once less accessible to small brands that couldn’t budget a high-priced celebrity or a top-tier social media user, the growth of social media has led to an abundance of influencers with nano to macro followings.

Now, as more businesses invest in influencer marketing, they’re beginning to see solid benefits. In our survey, Influencer marketing was the most popular and most effective trend with the biggest ROI.

By working with an influencer that’s gained trust, expertise, or notability in a specific industry, brands can gain awareness, traffic, and potentially conversions from that influencer’s audience.

2. Short-Form Video

As TikTok’s virality grew in 2020 and 2021, other social media platforms like Instagram and YouTube rushed to get into the short-form video game. And, as more platforms continue to shift to prioritizing quick, fast-paced content, so have marketers.

Our Marketing Strategy Survey results show that short-form video is popular, effective, and still growing, especially among social media marketers.

In fact, 30% of social media marketers plan to invest more in short-form video than any other social media marketing strategy in 2022. Meanwhile, 33% plan to leverage short-form video for the first time in 2022.

3. Virtual Events

Virtual events are popular, effective, and will continue to be a top trend marketers leverage in 2022.

However, 17% of marketers who leverage virtual events will decrease their investment in 2022, the second-highest decrease of any trend marketers invested in during 2021. Additionally, while 31% of marketers currently leverage virtual events, just 9% of marketers plan to leverage them for the first time in 2022.

If you have virtual events planned, don’t let this research panic you. Virtual events are still the third most prominent trend marketers will invest in throughout the next year.

Additionally, the decreases noted above could signal a natural transition from virtual to hybrid or physical events as more public venues fully re-open in the next year. As an event marketer, it will be important to weigh all of your options and local mandates to determine which event type will be most effective and comfortable for your audience in the coming year.

Which trends do marketers plan to leverage for the first time in 2022?

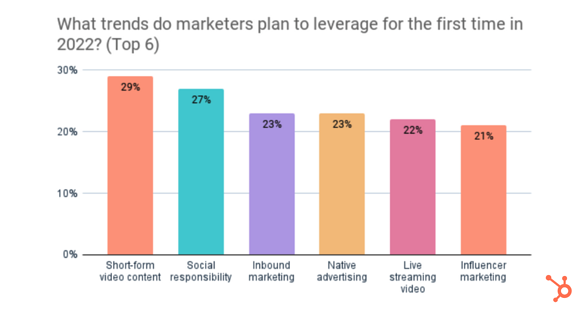
Short-form video, social responsibility, and inbound marketing are the top trends marketers plan to leverage for the first time in 2022.

While I explained some of the appeals to short-form videos above, here’s a quick snippet about the other two trends.  

trends marketers plan to leverage for the first time

Brands Will Take More Social Responsibility

In 2020 and 2021, consumers paid more attention than ever to how companies treated their customers, audiences, employees, and the world around them. And, many companies used this time to take a stance on their values. As these brands took on more social responsibility, they found that current or new audiences shared their values and gained trust, credibility, memorability, and awareness from those consumers.

Moving into 2022, more marketers are recognizing the importance of social responsibility. Investment in social responsibility will continue to grow from those already leveraging it and from marketers using it for the first time.

Digital Transformation Will Boost Inbound Marketing Use

As we move into 2022, consumers will be more connected to the web and digital platforms than ever. And, outbound strategies have gotten even more out of date.

To meet customers and audiences where they are, 23% of marketers will leverage inbound marketing for the first time.

To read more about short-form content, social responsibility, and other key trends analyzed in this survey, check out these posts:

Which marketing channels are businesses leveraging?

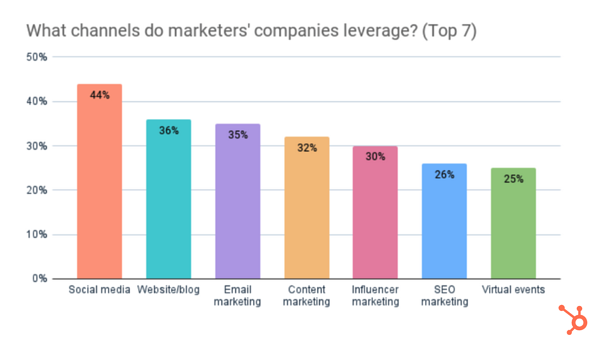
The top channels marketers currently use are social media, website/blog, and email marketing.

the top channels businesses are leveraging

1. Social Media

Social media is the most popular and most effective marketing channel, with the highest ROI.

The use of social media will continue to grow, with 39% of those who don’t use social media planning to leverage it for the first time in 2022.

Additionally, 26% of marketers plan to invest more in social media than any other channel in 2022

In 2022, 51% of marketers who leverage social media plan to increase their investment in social media marketing, and 37% will continue investing the same amount.

The Top Social Media Platforms

1. Instagram

Instagram is the most popular social platform, just ahead of YouTube and Facebook.

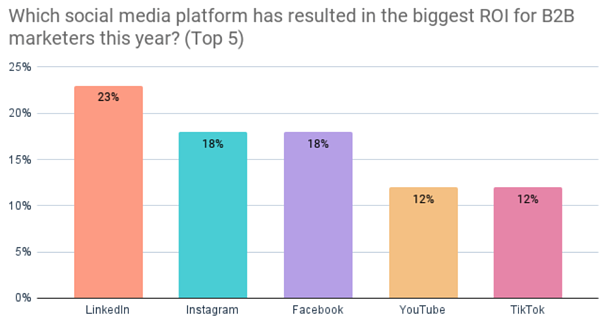
However, Facebook has the biggest ROI of any platform, and 25% of social media marketers say they will invest more in it than any other platform in 2022.

2. YouTube

YouTube is No. 2 in terms of usage, but ROI lags behind Facebook, Instagram, LinkedIn, and TikTok. Still, expect to see the platform continue to see marketing growth as brands continue to leverage it for its ginormous audience and growing brand opportunities.

3. TikTok

While TikTok is the No. 6 platform in terms of usage by social media marketers, 62% of those who leverage it plan to increase their investment in 2022, the highest of any social platform.

The Top Marketing Content Formats

Video content, blogs, images, and infographics are the top media formats.

1. Videos

Video leads across the board as the most popular and effective format with the highest ROI, and 30% of content marketers plan to invest in video more than any other format in 2022.

2. Blogs

Blogs are popular, effective, and have the 3rd highest ROI of any format.

The use of blogs will continue growing in 2022, with 29% of content marketers planning to leverage blogs for the first time and 10% planning to invest more in blogs than any other format.

3. Infographics.

Adoption of infographics will continue growing as 45% of content marketers currently leverage them and 38% plan to leverage them for the first time in 2022.

Additionally, 56% of content marketers who leverage infographics say it is the most effective content format they use.

4. Podcasts and Audio Content

Only one in three content marketers use podcasts or other audio content. While 51% of those who do plan to invest more in 2022, 43% plan to continue investing the same amount 

Despite low ROI reports, 53% of content marketers who leverage podcasts and other audio content say it is the most effective format they use.

5. Audio Chat Rooms

Just 14% of social media marketers leverage audio chat rooms like Clubhouse and Twitter Spaces, but 68% of those who do say it’s the most effective social media strategy they use, despite low ROI.

Additionally, 49% of those who already use audio chat rooms plan to increase their investment in 2022, while 47% plan to maintain their current investment next year.

More Insights From the HubSpot Blog

Has this data inspired you to build out or refine your marketing strategy in 2022? Be sure to keep following the HubSpot Blog’s data-driven content to dive deeper into current and emerging industry trends.

Next, check out this post where I give 11 recommendations for marketers based on the data above, plus survey findings that didn’t make it into this post. 

Below are a few blog posts that further break down the findings of our Marketing Industry Trends survey. We’ll continue to update this list as we publish more articles, so be sure to bookmark this page!

More Marketing Industry Trend Insights

The Marketing Trends of 2022: The Ultimate Guide

The Top 5 B2C Marketing Trends of 2022 [HubSpot Blog Data]

6 Short-Form Video Trends Marketers Need to Watch in 2022

11 Marketing Recommendations for 2022 [Based on HubSpot Blog Data]

Marketing Plan Template

Categories B2B

16 Content Marketing Analytics Tools That Finally Do What You Need

To have winning marketing campaigns and content, you need to understand the analytics behind your strategies.

Content marketing analytics look at the metrics your team cares about most to provide insight on the health of your current strategies, progress towards goals, campaign success, and more.

Get Started with HubSpot's Marketing Software for Free


Content Marketing Analytics

There are a number of marketing analytics tools available with customizable metrics, a variety of visualizations and dashboards, and integrations to help you measure the impact of your marketing strategy.

Let’s dive into your best options.

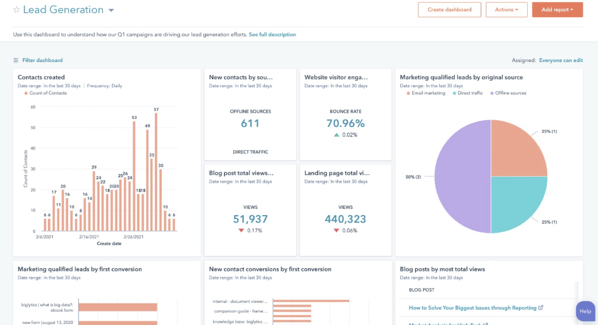
1. HubSpot Marketing Analytics and Dashboard Software

content marketing analytics software: HubSpot Marketing Analytics and Dashboard SoftwareSource

Best content marketing analytics tool for: Measuring the performance of all your marketing campaigns and combining resulting data with your marketing software and CRM platform.

HubSpot’s Marketing Analytics and Dashboard Software makes it easy to access all data and insights from a single location in seconds.

Trigger and/or schedule touchpoints, track custom interactions that are unique to your business, and indicate when a customer is ready for another stage of the buyer’s journey with behavioral events.

Use attribution reporting to connect every customer interaction to an associated record and revenue generated. Pre-built and customizable dashboards, templates — as well as Custom Objects — visualize your data in a format that works for your team so you can easily apply it to segments, campaigns, workflows, and more.

Price

There are four Marketing Hub plans with different analytics features and flexibility ranging price from free (forever) to $3,200 per month.

Pro Tip: Use HubSpot’s Marketing Analytics and Dashboard software to measure the performance of your marketing campaigns in one place with built-in analytics, reports, and dashboards.

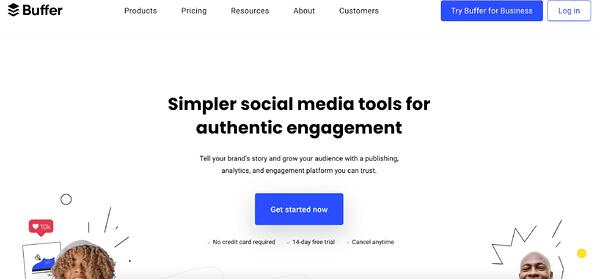
2. Buffermarketing analytics tool example buffer

Source

Best content marketing analytics tool for: Understanding channel performance in detail with customizable reports.

Buffer’s content marketing analytics offers the option to build reports according to your goals. Add or remove custom metrics about the performance of numerous social media accounts. You can export those reports to share them easily.

Reports are updated daily so you can be sure you’re receiving timely data. Buffer’s analytics are designed to help you see channel performance at a detailed level on one dashboard.

The software also offers engagement metrics for each account individually. This helps you gain an intricate understanding of how customers are interacting with social content. Measure stories, posts, and hashtag performance as well as access the demographics of your audience across channels.

Price

Buffer’s Marketing Analytics product, Analyze, has two payment options with different features and flexibility that cost $35 per month or $50 per month.

3. Google Analytics

marketing analytics tools example google analytics

Source

Best content marketing analytics tool for: Integrating content marketing analytics seamlessly with your other Google business tools and making data-driven content marketing strategy decisions.

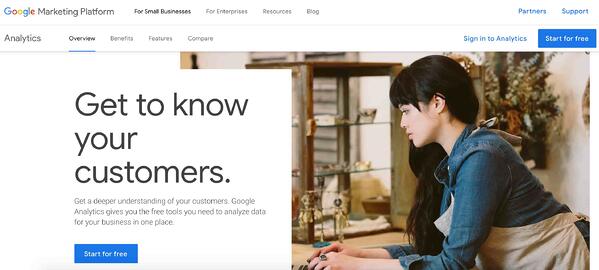
Google Analytics’ intuitive interface is easy to navigate and can be used to understand the performance of your content across multiple platforms. You can also choose to analyze your content marketing efforts across all of your web pages or on an individual page level.

To understand how your content marketing strategy is doing, Google Analytics offers metrics for traffic, navigation, conversion, and organic search. The tool allows you to track user-level interactions to provide insight into the ways your audience is engaging with your content.

This analytics tool also integrates with all of Google’s other business software so you can access all of your data and insights in one place.

Price

Google Analytics offers a free and a paid plan. The free plan is ideal for SMBs and you can get started using it immediately. Meanwhile, the paid plan, called Analytics 360, is ideal for enterprise-level companies and requires you to speak with a sales rep for a quote.

4. SimilarWeb

marketing analytics tools example similarweb

Source

Best content marketing analytics tool for: Understanding where your website and content strategy stand in comparison to industry standards.

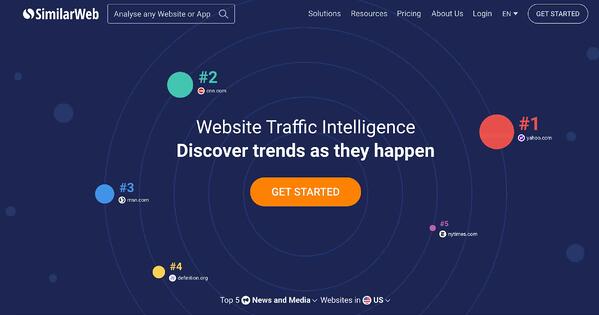
SimilarWeb provides traffic and engagement industry standards and tells you where your website stands among them. This information is useful for discovering how performance stacks up against the competition.

With SimilarWeb, break down your daily active users, sessions per user, use-time, and rank. Discover more information about your audience — such as repetitive behaviors or interests — to improve your acquisition strategy.

Price

SimilarWeb offers two plans, one of which is free and another that’s meant for enterprise businesses and requires you to contact a rep for a consultation.

5. Moz

content marketing analytics example moz

Source

Best content marketing analytics tool for: Measuring your SEO content strategy and determining which keywords you should be using.

Moz measures the impact of your search-engine-optimized content. Gain insight into how your work is ranking among others in your industry and which keywords are the most effective to use in your strategy.

Moz’s software tracks your site’s keyword rank and how visible it is over time to learn what is and isn’t performing well among audiences.

Additionally, track how competitors rank on search engine results pages (SERPS) — this allows you to spot areas for improvement and the parts of your campaign you can use to target them. To help with this, use Moz’s detailed reports to see how your content is reaching audiences and what you can do to improve.

Price

There are two main Moz solutions, Local and Pro. Both Local and Pro have different plans ranging in features, flexibility, and price. Local ranges in price from $129-299 while Pro ranges in price from $99-599 per month.

6. Hotjar

marketing analytics tools hotjar example

Source

Best content marketing analytics tool for: Tracking and visualizing sessions on your website with heat maps.

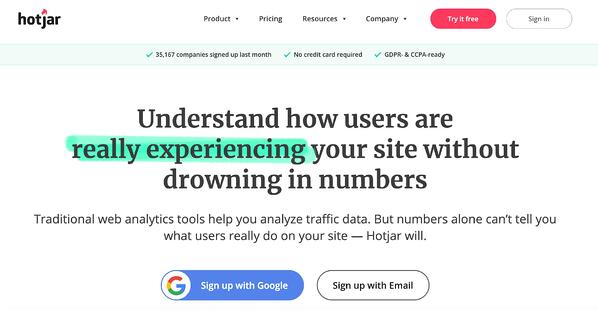
Use Hotjar to track sessions on your site. Hotjar provides heat maps about how and where customers spend their time while on your website.

Hotjar’s real-time videos capture how your visitors are navigating and using your website. This allows you to hone in on the content that’s catching your customer’s eye. You can also track conversions and make inferences about which stage of the buyer’s journey customers might be entering or leaving.

Price

Hotjar offers three types of plans. There are two options for those who want a Personal plan that is either free or $39 per month. These options are ideal for personal and low-traffic websites.

The Business plans range in price from $99-$989 per month depending on the number of sessions per day you receive. Lastly, the Agency plan requires you to contact a rep to chat about a plan for your team and clients.

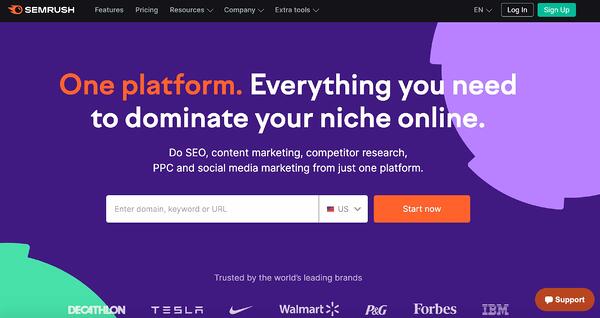
7. Semrush

marketing analytics tools semrush example

Source

Best content marketing analytics tool for: Tracking SEO and keyword performance across your web pages and content strategy.

Semrush is used for search engine optimization (SEO) tracking and helps you track keyword performance in your content as well as monitor brand mentions cross-platform.

Additionally, the tool tracks Google rankings and which of your web pages receive the most traffic. This is helpful because discovering what drives visitors to your site allows you to adjust the content you’re presenting accordingly.

Price

Semrush offers three plans that range in price from $119 to $449 per month.

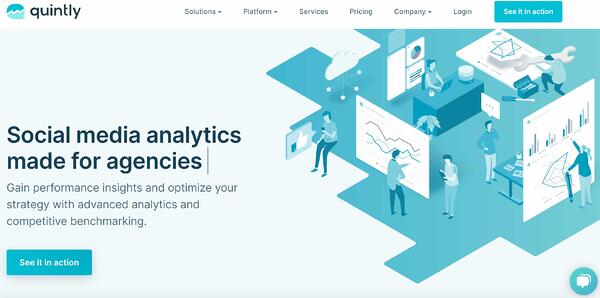
8. Quintly

marketing analytics tools quintly example

Source

Best content marketing analytics tool for: Improving social planning by analyzing the success of your social media marketing strategy with customizable metrics.

Quintly provides you with the insight necessary to analyze your content marketing campaigns. It helps you make smarter decisions when it comes to social planning by equipping you with customizable metrics so you can better understand how your marketing strategy is working.

Quintly does a deep dive into all of your accounts to uncover metrics that matter to your teams and goals, and you can sort and share reports by team so everyone gets the information they need.

Reports can also be automated and measured by impact using Quintly’s machine learning system. Users can access the API, integrate with popular software like Google Search, and overcome data silos.

Price

Quintly’s custom plans start at $300 per month.

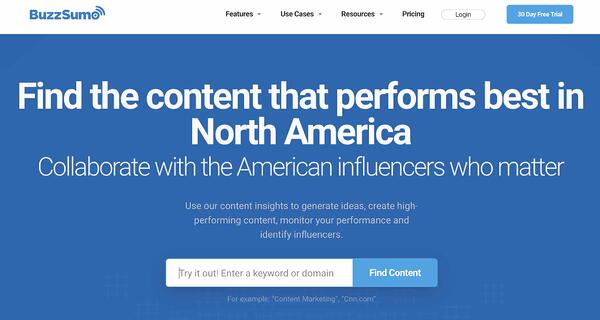
9. BuzzSumo

marketing analytics tools buzzsumo example

Source

Best content marketing analytics tool for: Visualizing and analyzing real-time marketing trends to tailor content to your target audience.

View and analyze marketing trends in real-time with BuzzSumo by topic so you’re able to create content that’s likely to be relevant to your audience. Trends can also be filtered by location — this way, you’ll have an understanding of what’s popular by region.

BuzzSumo lets you customize your feed so you can get the data that matters most to you. Identify relevant keywords to include in your campaigns, access examples of content proven to be successful on BuzzSumo’s site, and use the data you obtain through the tool to discover how you can drive the most traffic to your marketing content.

Price

BuzzSumo offers four plans that range in price from $99 to $499+ per month.

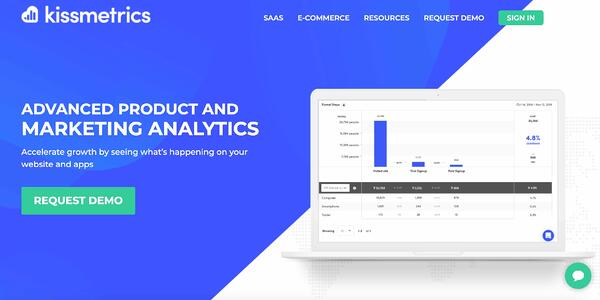
10. Kissmetrics

marketing analytics tools kissmetrics example

Source

Best content marketing analytics tool for: Discovering how your audience interacts with your website and apps and understanding their behaviors.

Kissmetrics allows you to spot a customer’s journey across multiple devices, analyze their behavior on your website, and review conversion metrics (e.g. bounce rate and time-on-site).

Kissmetrics focuses on behavioral analytics which is helpful if you want to learn about how customers react to and interact with your content. This will also provide insight into what’s most valuable to users and how to keep visitors coming back.

Price

Request a Kissmetrics demo or check out the payment plans for their two main products, one of which is meant for SaaS and one for ecommerce.

The SaaS plan comes with three payment options — those plans are $299, $499, or a custom price (based on your custom plan). Ecommerce also has three plans that cost $299, $499, or a custom price (based on your custom plan).

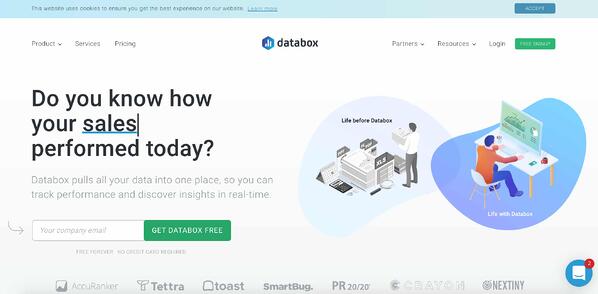
11. Databox

marketing analytics tools databox example

Source

Best content marketing analytics tool for: Combining all of your marketing data to track and understand the success of your strategy in a single location and in real-time.

Databox is a business analytics and KPI dashboard platform that offers insight into the state of your business. The tool organizes all of your business data — from any source — into a single location for accessible performance tracking.

Over 70 available integrations make the process of bringing your data into the tool — as well as displaying, analyzing, and sharing it — simple.

The Goal Tracking feature allows you to track progress towards your targets by assigning and focusing on SMART goals within the tool.

Scorecards are a feature that notifies you (daily, weekly or monthly) of any updates to your KPIs. There are also other alerts you can receive the moment your data is looking off so you can efficiently resolve the issue before it gets worse.

Price

Databox offers a regular version of their product and an Agency edition. The regular version costs anywhere from free to $248 per month. As for the Agency version of Databox, there’s a free plan but if you need more flexibility, contact a rep for billing details.

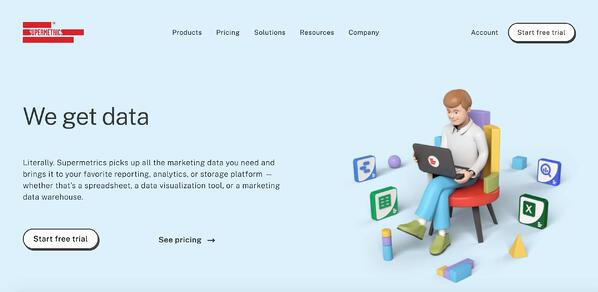
12. Supermetrics

marketing analytics tools supermetrics example

Source

Best content marketing analytics tool for: Taking marketing data from any source and moving it into Google Sheets, Google Data Studio, Microsoft Excel, Google BigQuery, or Snowflake for analysis.

Supermetrics is a business analytics tool that you can use to pull marketing data (e.g. SEO, PPC, social media, and web analytics data) from any source and move it into Google Sheets, Google Data Studio, Microsoft Excel, Google BigQuery, or Snowflake. Use Supermetrics as a reporting, analytics, and data storage tool.

Bring your favorite metrics and dimensions into Supermetrics. Then, organize and filter your data within Supermetrics to analyze the success of your efforts and identify areas for improvement.

Price

Supermetrics offers multiple plans for all seven of their products, some of which require you to contact a rep and some of which list pricing on their unique web page.

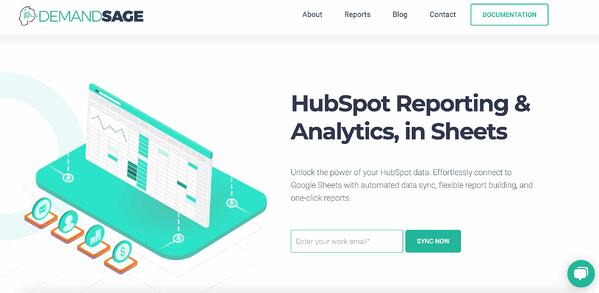
13. Demand Sage

marketing analytics software demand sage example

Source

Best content marketing analytics tool for: Moving all of your HubSpot data into Google Sheets for easy analysis in your platform of choice.

Demand Sage is a tool used to bring all of your HubSpot data into Google Sheets. There are one-click, customizable reports to help you understand your marketing and sales success and which areas to focus your efforts. Demand Sage offers one-click data sync and one-click, flexible reports.

Within your spreadsheet, create granular, record-level reports and use the table builder to display your data with any view you’d like.

Additionally, attribution and revenue reporting connects marketing and sales data in your reports for greater internal alignment and insight into how your pipeline is working as well as what’s driving revenue.

Price

Demand Sage is free.

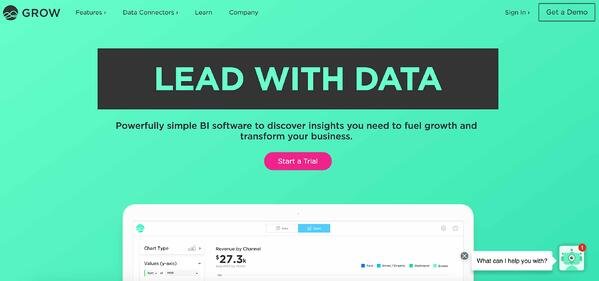
14. Grow.com

marketing analytics tools grow.com example

Source

Best content marketing analytics tool for: Importing and transforming business data from a variety of sources and then combining that data on custom dashboards.

Grow.com is a business intelligence platform that allows you to import and transform your business’s data from a number of sources and create dashboards with the metrics that matter to you.

Once your data is imported into the platform, it keeps your most relevant data at your fingertips. Build custom metrics, bring disparate data sources together, and select from a number of chart types to visualize your data however you want to. You can also easily share metrics and dashboards with team members to ensure everyone knows where to focus their efforts.

Price

Get a free Grow.com demo and talk to a rep about the price of the right plan for your business.

15. Plecto

marketing analytics tools plecto example

Source

Best content marketing analytics tool for: Keeping your team on top of goals and targets with dashboard data visualization software.

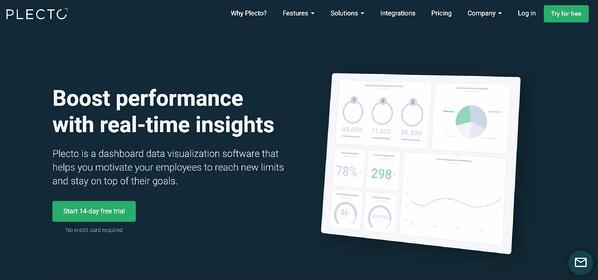
Plecto is a dashboard data visualization platform ideal for discovering real-time insights from an unlimited number of sources you pull your data from. Filter across the sources you integrate with Plecto and display data on your dashboards with different variables as needed.

Display data with pre-built KPI dashboards in Plecto or customize your own. There are also gamification features to increase employee engagement and motivation as well as keep team members focused on their goals.

Price

Plecto offers three payment options depending on which plan you choose ranging from $200 per month, $350 per month, or a custom price (based on your Enterprise plan).

16. Adverity

marketing analytics tools adverity example

Source

Best content marketing analytics tool for: Automating data integration across hundreds of sources.

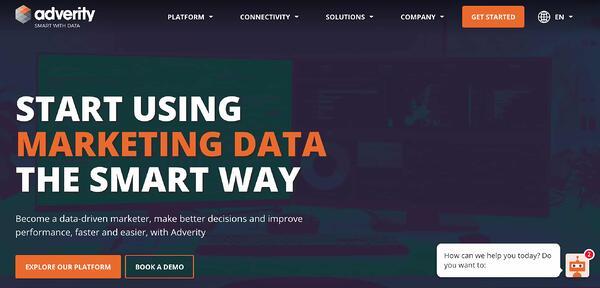
Adverity is an intelligent marketing data analytics platform ideal for data-driven marketing. The tool automates data integration from hundreds of sources to give you a single view of marketing performance.

Adverity makes it easy to remove any data silos you may have and provide easy access to centrally-located marketing data so your team members can identify and analyze the information they need.

Adverity comes with augmented analytics, meaning it uses AI to identify trends, areas for improvement, strengths, and new insights in your data. It also automates the process of creating marketing reports and data visualizations to save you time.

Price

Contact Adverity to get a custom quote on the right plan for your business.

Performance Content

When measuring the performance of your content, you’ll need to 1) decide which performance indicators you’re going to measure, 2) track those metrics and KPIs, and 3) analyze and apply your findings. 

But first, what is performance content? 

Performance content is content that you create and optimize with a specific business goal in mind (e.g. increasing user sign ups on a web page or your Blog).

Content Performance Indicators 

Here are some common website metrics and KPIs you might choose to track in order to analyze the success of your content. 

1. Web Traffic

The amount of traffic you get on your website and individual pages.

2. Page Views

The number of page views a web page gets from visitors. 

3. Impressions

The number of times an ad or web page is displayed to an individual.

4. Sessions

A group of actions an individual website visitor takes while on a website during a specific amount of time. 

5. Bounce Rate

The percentage of visitors who come to your website but don’t convert in any way — rather, they leave, or bounce, from your site before taking action. 

6. Search Engine Optimization (SEO)

Keyword and search engine results page (SERP) success and performance. 

7. Engagement

The number of interactions that your visitors have with your content (e.g. comments, shares, likes, forwards, subscriptions) and how long engagement lasts across those channels and web pages. 

8. Social Media Engagement and Interactions

Depending on your social media platforms, there will be specific metrics related to engagement and interactions on a post and/or piece of content that you can analyze (views, shares, comments, likes, etc). 

9. Lead Generation and Conversions

The number of acquired leads, conversions, and sales that result from your content (e.g. email sign ups, blog subscriptions, CTA clicks, downloads, product purchase.)

11. Brand Awareness

The way your target audience learns about your brand and becomes aware of your products, mission, and what it is you do.

This can mean taking a look at other metrics on this list such as page views, social media engagement (or simply using the process of social listening), downloads, video views, referrals, and resource/ document reads or shares. 

12. Customer Loyalty

The amount of content that your current customers consume and/or engage with (e.g. if a current customer is a blog subscriber who receives articles in their email inbox weekly). 

13. Upsell/ Cross-sell

Sales for new, additional, or upgraded products that you offer. 

Apply Content Marketing Analytics to Grow Better

Content marketing analytics tools have the power to help your team understand the health of your strategy, audience behaviors and interactions, progress to goal, and more.

As a result, you’ll have the information you need to improve the customer experience, resonate with your audience through your content, and increase conversions.

Editor’s note: This post was originally published in June 2020 and has been updated for comprehensiveness.

Free Resource: How to Reach & Engage Your Audience on Facebook

Categories B2B

How to Make an Ad: A 15-Step Guide

Advertising is changing — in 2021, companies are on track to spend more than $450 billion dollars on digital advertising.

The challenge? Massive variety in the digital advertising market — from differing platforms and ad types to target audiences — can frustrate efforts to capture customer interest and drive ROI.

Download Now: Free Ad Campaign Planning Kit

How do you choose the right medium to promote your platform? What metrics matter? And once you decide, how do you actually make the ad?

Our comprehensive ad-making guide has you covered. Let’s go.

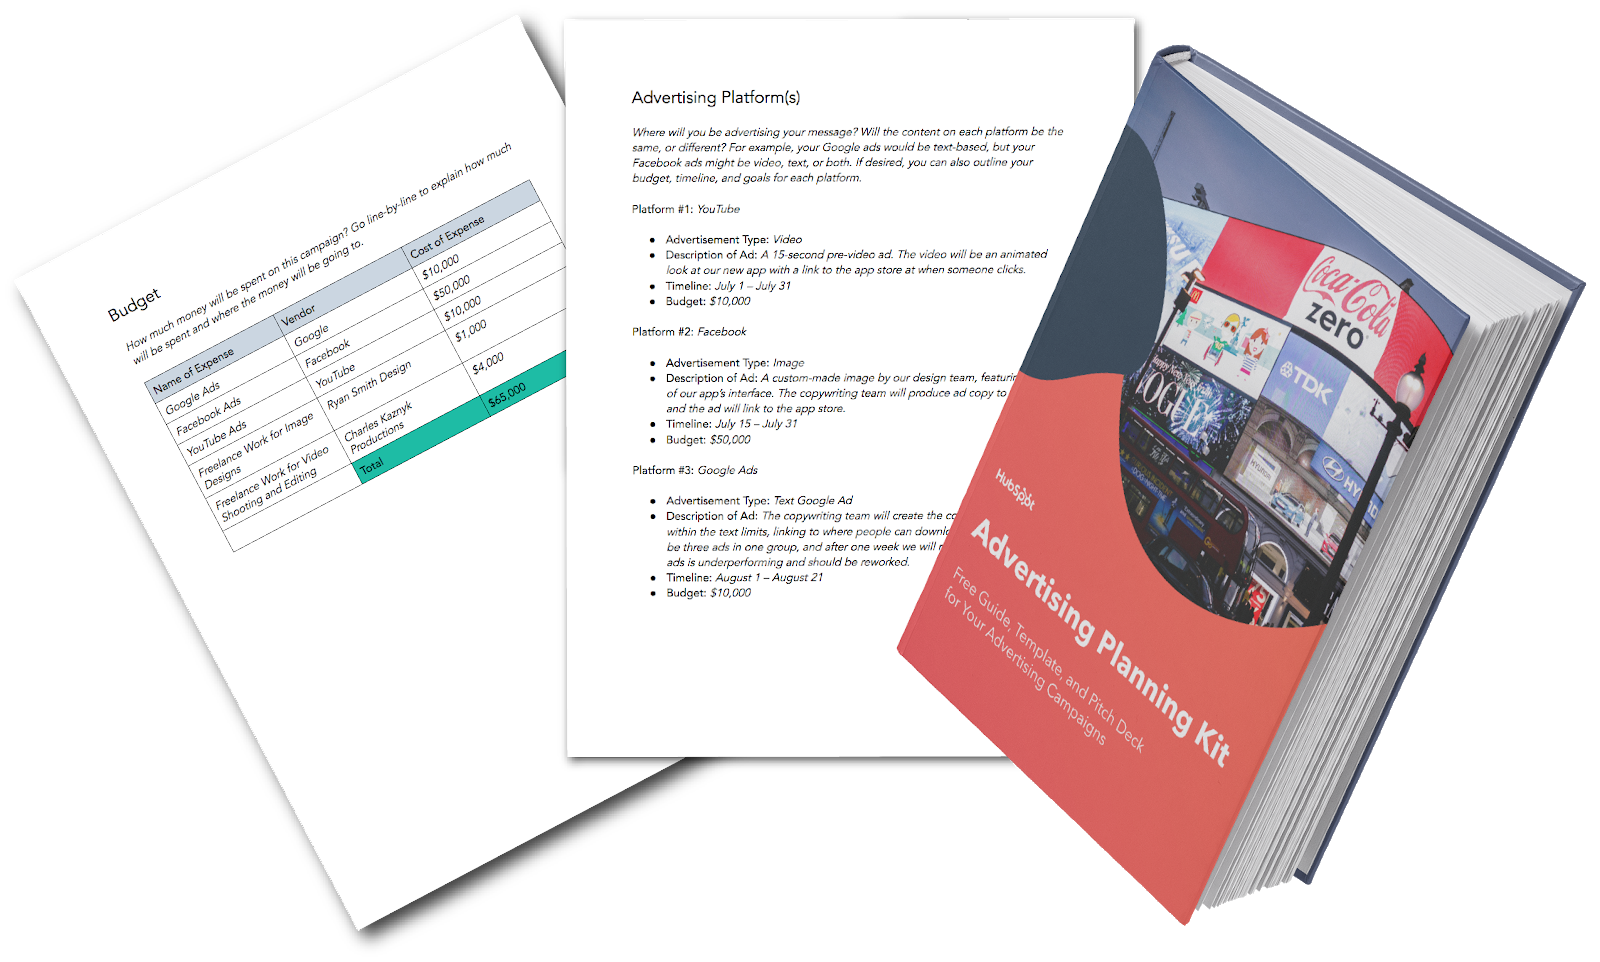
Featured Resource: Advertising Planning Templates & Kit

To make your advertising planning easier, use HubSpot’s free Advertising Planning Kit. Included are templates to help you plan and present your ad pitch, schedule your release dates, and inform your stakeholders. We’ve also thrown in an advertising best practices guide to help you choose the advertising method that works best for your business.

1. Choose Your Target Audience

When making an ad, you’ll first need to decide the audience you’re making the ad for. Target the right market and you’ll find customers naturally inclined to engage with your brand and product. Cast too wide a net and you may find yourself lost in the digital noise.

One way to help your ad find the right audience is to get granular on whom you want to target with your messaging, which will help you incorporate the best messaging and select the best advertising platform. This should be based off of your buyer personas — semi-fictional representations of your ideal customer based on market research and real data about your existing customers.

If you need help building your personas, try using HubSpot’s Make My Persona tool.

2. Conduct Marketing Research

Market research is an essential part of campaign promotion. Feeding into your buyer personas, market research can answer key questions about your target market, such as:

  • How old are they?
  • What do they spend most of their time doing?
  • What social media platforms do they use, if any?
  • Do they live in suburban, urban, or rural areas?

Knowing the above information about your target audience can help you answer questions like — TV or YouTube? Instagram or LinkedIn? Billboard or bus? — because you’ll understand more about how to appeal to the right people.

You can use this Market Research Guide and Set of Templates to get started on market research for your ad.

3. Choose Your Platform

Your market research should give you the insight and confidence you need to choose the most effective platform to reach your target audience. You should also do some supplemental research on the costs, ROI, and benefits of certain ad platforms and methods.

You may come to the realization that using multiple ad platforms and methods would be the right move for your campaign – such as social media and search engine ads. This is actually a great strategy, as it casts a wider net and opens up the possibility of reaching even more prospects where they already are.

4. Decide on a Budget

For advertising, you need to spend money to make money.

Getting your budget approved can be difficult, so make it easier to get what you need by clearly outlining:

  • The total budget you need
  • How the costs are broken down
  • A projected ROI (or business impact)

Be sure to come to any budget meeting prepared to answer whatever questions could be thrown at you and to defend the specifics.

For instance, saying “We need $10,000 to run a Google Ads campaign” doesn’t sound nearly as compelling as “We’d like to run a series of ads on Google. Here’s a list of our keywords and negative keywords, their monthly search volume, and our preliminary bids for each. With these projections, we’re expecting to bring in 400 new contacts next month for a total cost of $10,000.”

5. Craft a Message

By this point, you know your target audience and your preferred platform, but you’re still not sure what you’re saying. Here’s where you’ll want to think about the broad purpose of your campaign to inspire your ad.

Do you want people to come to your store, or visit your website? Is your immediate goal to drive free signups for your software, or ebook downloads? Think about the message and how that can feed into the end goal(s) of your ad campaign.

6. Get People Talking

While your message needs to include your brand purpose and tie in with long-term marketing goals, it also needs to be something people remember.

Here’s why: As more advertising shifts to social media sites such as Facebook, Instagram and even Twitter, brand marketing needs to get to the point ASAP to drive customer interest and social sharing. If your message — whether it’s text, images, or videos — can make users stop, look and share with their connections, you’ve got a much better chance of creating organic interaction and driving more traffic to your site.

7. Decide What You’re Building

Ads can build brand awareness and product awareness — but not simultaneously. As a result, it’s worth taking the time to think about your advertising goals for new marketing campaigns.

For example, if brand awareness is the goal, you may want to consider a set of ads that tell a story or help customers learn more about what makes your brand unique. Here, the goal is to engage with customers over a longer period of time to help them engage with your brand from the first time they see your ad to eventual conversion. Ideally, your brand story will help create a long-term, reciprocal customer relationship.

Product awareness ads, meanwhile, are designed to highlight new products or services, call out seasonal specials or help drive specific action from customers. They’re often one-off or a short series of ads that run over a small period of time.

8. Include a CTA

While building awareness is critical for ads to be effective, it’s not enough in isolation.

That’s why all your ads also need a call-to-action (CTA) that provides information for consumers on what to do next. In some cases — such as an ad on your webpage — the CTA may be simple and direct, such as “sign up for our newsletter” or “click here to buy now.”

If you’re advertising on social sites, meanwhile, reaching for an immediate sale or asking for user contact data may actually drive customers away. Here, your CTA needs to be more subtle but no less clear. For example, you might opt for “click here to learn more” or “explore what we have to offer.” In practice, the goal is to avoid presuming what users want — instead, your CTA provides a path to more information if they’re interested. And if you’ve crafted a great ad, they will be.

9. Don’t Forget the Details

They’re small things — the smallest, in some cases — but can have significant impacts for your ad campaign: The details.

Consider an advertisement for a concert or event that your company is hosting. You’ve done the work: Identified the right market, crafted a great message, and created a CTA that will drive customer action.

But…

You’ve forgotten the details. Your ad doesn’t mention where or when the event is happening. Sure, customers could click through and see the specifics on your website, but there’s no guarantee they’ll take this step. Put simply, when it comes to creating a great ad, you have to account for the forest and the trees: You need big-picture advertisements that are visually compelling, content-rich and engaging, but it’s just as critical to double-check that you’re not missing the details.

10. Create Test Ads

Before launching your ad campaign, it’s worth trying your hand at making an advertisement for your brand. Here’s why: Not all ad designs look as great on the screen as they do in your head. By creating basic mock-ups, you can see what works, what doesn’t, and what needs to improve.

One of the most popular options for simple ad creation is Adobe Photoshop. Not sure where to start? Here’s a quick look at how to make an ad in Photoshop.

How to Make an Ad on Photoshop

Let’s say you want to create a Facebook ad on Photoshop. Follow these steps:

  • Create a new document in Photoshop.

how to make an ad on photoshop

Open Photoshop, select “File,” and then click “New” from the drop-down menu. You’ll see the screen above. Here, you can select the size of your new ad, along with the color profile you want to use.

  • Insert your image.

Next, you’ll want to insert an image to work with. Simply drag-and-drop the image of your choice into the Photoshop workspace and you’re ready to go.

  • Add some text.

how to make an ad on photoshop: add text

Next, add some text to your image by selecting the “T” button in the bottom left-hand corner. You can choose vertical or horizontal text, depending on what works best for your image.

  • Add a CTA.

Once you’re happy with your text placement, consider adding a CTA. Select one of the shape tools from the left-hand side menu and insert that into your image. Resize as needed, then head back to the text tool and insert your CTA.

  • Consider the 20% rule.

Facebook used to have a hard-and-fast 20% rule that stated no more than 20% of your image could contain text. While this is now a strong suggestion rather than an absolute rule, it’s worth keeping your text to a minimum since Facebook rates ads based on their text volume — the more text you have, the lower your chances of getting seen.

  • Save your file.

Finally, save your new ad. Head to “File”, then “Save As,” and then “Format.” It’s worth saving it as both a Photoshop document (.psd) and a .png file, which makes uploading to Facebook easier.

11. Develop Creative Assets

Whether it’s copy for a Google Ad or a flashy landing page from your in-house designers, all ads need creative assets. Chances are, most of the ads you run will need one or more of the following:

  • Short, promotional copy (for image ads and online ads)
  • Long-form copy (for video scripts)
  • Photographs (for online ads)
  • Custom-designed images and/or animations (for online ads and video ads)
  • Video (for…video ads)
  • GIFs (for online ads)

All of these assets can be overwhelming, and if you’re thinking “I’m not a videographer/writer/designer/photographer!”, that’s totally fine. If these resources aren’t available to you in-house to help make your ad, consider hiring a team of freelancers or an agency to help you produce these deliverables and make an outstanding advertisement, or use an online marketing design tool like Canva to help streamline the process.

12. Determine Measurements of Success and Set Up Tracking

No matter if your ultimate goal is Page Likes, online purchases, or promo code uses, you should never launch an ad without first being crystal clear on two questions:

  • What do we want to see in order to call this ad successful?
  • How are we measuring success?

You already thought of your advertisement’s goal in Step 7, so now, make the expectations of your campaign known by setting up the proper ad tracking.

If you’re advertising online, there’s a good chance the platform you’re using — like Facebook, Google, or LinkedIn — has an ad management and tracking platform, allowing you to see how many interactions your ads have had and how much they cost.

However, you’ll also want to take a few extra steps to aid in your analysis down the line:

  • Use an automated free ad tracking platform to measure advertising ROI and see how your ads tie into larger marketing projects and campaigns. You can also use this platform to compare ads from different sites; say, if you were running ads on both Instagram and Twitter.
  • Set up a custom tracking spreadsheet offline to measure engagements with your ad and other data points like cost, conversion, and advertising ROI, especially if your ad is online.
  • Use custom tracking tokens for links promoted in your ad so that you can analyze engagement and conversions on your own website.

13. Launch Your Ad

The stage is set, and you can finally launch your ad for the world to see.

Needless to say, the process of launching an ad on Google is different than on Bing. The same can be said for every social media channel, TV ads, or transportation ads.

Here’s a list of the more detailed, step-by-step process for launching an ad on some of these platforms. Click through to learn more about the platform or platforms that you’re creating an ad for:

14. Track & Analyze Performance

For campaigns that have a set run time (transportation, television, etc.), determine how the ad’s results performed against expectations. Since it’s difficult to draw a one-to-one comparison for these ad types, you may want to look at general business trends, change in revenue, or even social media/press mentions to gauge success.

For online ads, this process is a bit easier. Results start coming in immediately, so you can see how well your ads are performing instantly, and over time. Take note of the ads that are bringing in high numbers at low costs and — just as importantly — ads that are costing a lot but not performing that well.

Remember, you can take the headache out of the manual ad tracking with a free online ads tracking tool.

15. Make Changes, Rinse, and Repeat

Once your ad campaign is over (or if it’s an ongoing online campaign), take your learnings and apply them to your next advertisement.

For instance, maybe you realized your online ads that were wordier performed worse than ads that were more concise, or that YouTube just didn’t work this time around. Lean into what worked (or is working) and abandon what’s not to continue to strengthen your company’s advertising program.

It All Ads Up

And there you have it — our comprehensive guide to planning, creating, launching, and analyzing your new ad.

Looking to streamline the process? Use an advertising planning template to outline your ad campaign, keep all contributors informed, and rally behind the same end goal for your business.

Editor’s note: This post was originally published in October 2019 and has been updated for comprehensiveness.

advertising plan

Categories B2B

Should You Advertise On Snapchat?

In March 2017, Snap Inc., the parent company of the popular social media app Snapchat, went public. To meet revenue expectations, they opted into a self-service ads model, as opposed to direct sales.

It’s no question Snapchat is a popular platform — in the U.S. alone, 87.3 million people use the app. Given this, marketers may be curious about using Snapchat to meet marketing goals, and the advertising options available on the platform. 

In this post, discover the benefits that can come from using Snapchat, whether the platform will help you meet your business goals, and a case study from my experimentation on the platform.Download our free Snapchat guide to learn how to use it for your business. 

Advertising on Snapchat

While it is not as new and emerging as TikTok, Snapchat is not exactly a B2B platform, so you may be skeptical about using it to meet your marketing goals. 

Marketers can create and leverage various types of Snapchat Ads on the platform Like AR experiences, unique business filters for photo overlays, and even 3-minute long commercials. These ads can be used for a variety of different purposes, like general brand awareness, driving sales, or driving website traffic. 

Many people may compare the platform to Facebook, but there’s a significant difference between the two products. Although Facebook’s ads and targeting tools are more robust, Snapchat’s creative studio puts an emphasis on design. While Facebook’s Business Manager can feel initially overwhelming, Snapchat offers a tool that will guide you through the process of getting your campaign up and running. 

Additionally, Snapchat offers templates for creating ads, which can be helpful for businesses that don’t have teams responsible for making creative assets or videos. You can choose from specific templates and create what works best for you, and businesses of all sizes can leverage the tool to build ads and create product catalogs to share with their target audiences. 

Let’s go over some statistics that explain additional facts about advertising on Snapchat.

1. The largest audiences on Snapchat globally are females between the ages of 13-17 and males between 25 and 34. 

Millennials are currently the generation with the most significant purchasing power. Many users in Gen Z are approaching ages where they can begin making purchases for themselves or have already begun to do so. Given this, leveraging Snapchat gives you an in with the generations with significant spending power. In fact,

2. Snapchatters hold $4.4 trillion in global spending power. 

The opportunity to generate revenue on the app is high, especially when advertising products and services. 

spending power

Image Source

3. Foresight Factory Research predicts that in 2025 we’ll see a 37% increase in the proportion of U.S. Gen Z shoppers that use AR before buying a product. 

Snapchat has unique AR tools that set it apart from other social media apps. If you leverage this in your Snapchat Ads strategy, you’ll meet a significantly large audience desire and stay up on the trends.

4. Snapchatters are 63% more likely than non-Snapchatters to have purchased a product in the last month via a mobile device. 

If you’re selling a product on Snapchat, your audience is likely less hesitant to make purchases on social media apps and may be ready to do so again.

5. Snapchat commercials have 5x higher ad awareness than other mobile video ads. 

This statistic shows that the video you create on Snapchat can attract more customers than the ads you make on other platforms. 

Let’s go over an experiment I ran for my business on Snapchat to test out the platform.

42 Agency: A Snapchat Case Study

When I first started exploring Snap Ads, I was a little skeptical whether or not it could work for 42 Agency. Snap is not exactly a B2B platform, and, to my knowledge, didn’t have deep targeting options for companies working on Demand Generation or Growth projects.

For my purposes, I decided to run a simple web traffic objective campaign (Snap also supports app installs, engagement, and other objectives). I wanted to target business-specific audiences, so I focused my efforts on ages 27 and up.

I was impressed with the targeting options available on Snap Ads. Snap has similar categories to Facebook, available from Experian & Datalogix (income, occupation and such), albeit not as exhaustive as Facebook. However, these targeting options are available for the U.S. only. Along with Advanced Demographics, Snapchat’s ad targeting includes options for TV viewing, purchase behavior, lifestyles, and more.

Overall here are the campaign stats:

In this case, the “Swipe Ups” measure click-through rate. Rather than using a click-through link, Snap’s product urges users to “Swipe Up” from the bottom to view the destination URL. In my opinion, this creates higher intent and less risk of mistaken clicks than Facebook or Twitter mobile ads.

If you’re still on the fence, here’s a summary of when you should consider using Snapchat and when your marketing efforts may be best spent elsewhere. 

Should You Advertise On Snapchat? A Final Verdict

There is no right or wrong answer to the question of whether or not you should advertise on Snapchat, as most businesses can find success on the platform. You can easily segment your audience, upload your assets, set a campaign goal, and drive results. In addition, it’s less risky than TikTok simply because of the variety of advertising options available. 

If you’re a SaaS business, you can easily create commercials advertising your products and services. If you’re a clothing retailer, you can create product catalogs so users can see what you have to offer within the app. If you’re a dog groomer, you can use location targeting to get brand awareness for your business among local audiences.

Given this, there really is no set rule for which businesses can and cannot advertise on Snapchat. However, it is essential to the companies that do advertise on the platform to consider the following: 

  • If your audience isn’t younger Gen Z or older Millennials, your audience likely won’t be on the platform. However, if you do, you’ll expose your content to an audience with significant purchasing power.  
  • Snapchat is a visual-focused platform and, if you can’t create unique brand assets, like images and videos, it will be hard to meet audience expectations. 
  • If you don’t have an existing social media marketing strategy for other platforms, it may not be best to focus your efforts on the platform as it is more unique than Instagram or Facebook.

If you’re looking for more information, let’s go over an experiment I ran for my business on Snapchat to test out the platform.

Ultimately, the decision to use Snapchat in your marketing strategy depends on your overall marketing goals and target audiences. Consider the benefits listed above that it can bring to your business, and decide whether it fit into your strategy.

free guide: how to use snapchat for business

Categories B2B

11 Recommendations for Marketers in 2022 [+More Data from Our Marketing Industry Survey]

As many marketers know, the months of November through January can be the most pivotal for a business.

Why? This is when many marketing teams dive deep into planning for the next year. 

At this point, you’re probably starting to get overwhelmed by all the market research, industry news, competitive analysis, and/or team metrics you need to sift through as you plan for 2022. And, this overflow of information can make it incredibly hard for teams to determine what they need to focus on.

→ Download Now: Free Marketing Plan Template

To help marketers plan for 2022, I recently published findings from the HubSpot Blog’s Marketing Industry Trends Survey, where I collected data from more than 1,000 global B2B and B2C marketers — and aimed to answer questions like:

  • Which industry trends and tactics are marketers investing in?
  • What challenges are they facing?
  • And, what are their plans and expectations for 2022 and beyond?

To help readers distill and act on this helpful information even further, I’ve gone deeper through the survey data and made a list of some of the key recommendations marketers should consider in 2022.

Here are just a few suggestions, based on our data:

11 Data-Backed Marketing Recommendations for 2022

1. Produce short-form videos.

Short-form video is popular, effective, and still growing, with 31% of marketers currently leveraging short-form video and 29% planning to leverage it for the first time in 2022.

More than half of marketers (51%) who leverage short-form video plan to increase their investment in 2022, while 38% plan to continue investing the same amount.

Short-form video also has the highest ROI of any social media marketing strategy and 30% of social media marketers plan to invest in it more than any other trend in 2022.

Why do consumers engage with short over long-form content? When done right, short-form content is quick, but still concise, enabling fast-paced web users to get most of the information they need very quickly. And, if a short-form video doesn’t pack all the information a person needs to convert in it, it usually forces marketers to point out the most important facts that will make viewers eager to learn more.

One example of a great short-form video is from the Instagram account Miss.Excel (a company that offers Microsoft Excel courses). In this quick video, company founder and CEO, Kat Norton, demonstrates her credibility as an Excel coach by showing viewers how to convert a list of names in all caps to proper text.

If you plan to leverage short-form content in the next year, read up on the latest trends and tips from experts in the video space to get inspiration for your strategy.

2. Partner with influencers.

Influencer marketing is the most popular and effective trend, with the biggest ROI. This trend will keep growing in 2022 with 21% of marketers planning to leverage it for the first time.

Additionally, 46% of marketers who leverage influencers will increase their investments in 2022, while 40% will continue investing the same amount.

While you might expect brands to invest in high-priced, macro-influencers with the largest following possible, we actually saw that many marketers are instead opting to hire more affordable, but still highly-engaging nano or micro-influencers.

This wasn’t all that shocking to the Blog team. Because nano and micro-influencers aren’t celebrities with the highest budget content out there, they’re more relatable and trustworthy, which can lead to persuasive and effective product or brand endorsements.

Want to leverage influencer marketing, but don’t know where to start? Check out this handy checklist.

3. Prioritize LinkedIn, Facebook, and Instagram — but keep TikTok on your radar.

B2B brands might want to focus their social media marketing strategies on LinkedIn, Facebook, and Instagram — these platforms have the highest ROI for B2B businesses.

Screen Shot 2021-11-19 at 5.45.56 PMWhile just 40% of B2B social media marketers leverage TikTok, 65% of those who do plan on increasing their investment in 2022, the highest increase of any social platform. Meanwhile, 43% and 51% of marketers who use Facebook and Instagram will increase those platform investments in the next year.

In the B2C world, our survey found that 24% of marketers say Facebook returns the biggest ROI, while 19.5% and 12.1% point to Instagram and TikTok respectively. However, 62% of B2C marketers plan to increase investments in TikTok next year, compared to 44% of marketers who use Facebook and 56% of those using Instagram.

4. Leverage audio for engagement rather than ROI.

In the last year, audio platforms like Clubhouse, Twitter Spaces, and Spotify (for podcasting) showed us just how viral audio content can be — even when it’s branded.

And, in 2022, audio trends won’t be toning down.

While only one in three content marketers leverages podcasts or other audio content at the moment, 53% of them say it’s the most effective media format they use.

Investment in podcasts or other audio content will grow in 2022, despite low ROI, our survey found that:

  • 26% of content marketers plan to leverage podcasts or other audio content for the first time in 2022.
  • 51% of those who already leverage podcasts or other audio content will invest more in 2022
  • 43% of those who already leverage these strategies plan to invest the same amount in 2022.

When it comes to audio chat room platforms like Clubhouse or Twitter Spaces, just 14% of social media marketers use them, but 68% of those marketers say it’s the most effective social media marketing strategy they use.

Despite having low ROI, similarly to podcasts and other audio content, investment in audio chat rooms will continue to grow in 2022.

Nearly 50% of marketers who already use audio chat rooms plan to increase their investment in 2022, while 47% plan to maintain their current investment.

5. Go live.

Live video combines the visual and informative benefits of video marketing with the authenticity of unedited and uncensored content. By going live, consumers can see, hear from, and develop an authentic sense of trust from a brand that has decided to put their product, mission, or expertise out on social media for the world to see.

Today, the use of live video is growing, with 32% of social media marketers in our survey planning on leveraging it for the first time in 2022. And, of the 28% of social media marketers who currently leverage live video, 59% say it is the most effective social media marketing strategy they use.

6. Use marketing automation software to streamline strategies.

Automation is no longer a high-priced, inaccessible technology used by giant corporations. In fact, it can help with most areas of marketing, from running complex predictive analytics reports to personalizing marketing emails, to simply streamlining basic tasks to give marketers more time for complex strategies or tactics that require the human touch.

Our survey found that 70% of marketers use automation in their roles, while 33% plan to start in 2022.

7. Champion social responsibility.

While just one in four marketers currently devote resources to social responsibility, professionals we surveyed recognize its importance, with 27% planning to actively embrace it for the first time in 2022.

In 2022, 10% of B2B marketers plan to invest more in social responsibility than any other trend.

As we noted above, social responsibility helps your customers and prospects know what you stand for and that they share similar values or missions as you. For more on why the blog team encourages taking social responsibility, check out this post

8. Use an omnichannel approach.

Today, 81% of marketers leverage 3 or more marketing channels, and 89% of social media marketers leverage 3 or more social channels.

In a separate Social Media Trends survey, which I’ll report on in an upcoming post, we found that 82% of social media marketers repurpose content across various social channels. However, 69% of B2B companies repurpose content across social media channels, lagging behind B2C companies (89%).

9. Align sales and marketing teams with account-based marketing (ABM).

Just over 27% of marketers struggle with sales-marketing alignment, or smarketing, strategies. Although this challenge is not new to companies, tactics like account-based marketing, or ABM, can help.

Account-based marketing is a sales and marketing alignment tactic where marketers create campaigns, assets, and tactics based on data and feedback directly from the sales floor.

Today, 62% of marketers use ABM in their role, but 27% of marketers who haven’t leveraged it plan to start in 2022.

10. Focus on building hybrid strategies.

In 2022, employees might not be rushing back to the physical office full-time. But, many businesses and marketers will opt for hybrid work environments.

At the moment, half of the global marketers we surveyed are hybrid employees, while just 28% are fully remote.

As you plan for 2022, consider building strategies that work best for a dispersed workforce as some employees will work from home or a remote location either part-time or full-time, while others might rush back into the office.

11. Make the most of your marketing budget.

Between 2020 and 2021, 41% of marketers say their budget increased, while 45% of marketers operated on the same budget from the previous year.

Marketers likely saw their budgets stay fully intact or increase from 2020 to 2021 due to the economic and virtual business landscapes that were accelerated by the pandemic.

For example, businesses with high-priced products saw a lack of sales floor performance as decision-makers needed to spend more cautiously. Meanwhile, online marketing provided exceedingly solid traffic and conversion opportunities as consumers and prospects were stuck inside on the web.

As we move into 2022, the events of the past two years have placed more importance on marketing. For this reason, it’s not too shocking that nearly half of marketers (48%) expect their budget to increase in 2022, while 39% expect it to stay the same.

If you’re on a team that has seen an increase in budget, it’s important to leverage it wisely and build effective strategies that will justify more budget considerations for your team in the future. 

Want more recommendations?

After conducting our Marketing Industry Trends Survey, we aren’t just stopping after this recommendations post. To help marketers dive deeper into data-backed tactics, we’ll continue to publish content around specific findings, trends, and strategies highlighted in our survey. 

Below are just a few of the posts we’ve written recently about specific trends and tactics discovered in our research. 

Need even more guidance for your marketing planning? We’ve got you covered with the free resource below. 

Marketing Plan Template

Categories B2B

Why Twitter Fleets Were Discontinued [+Alternatives for Brands That Used It]

The social media landscape is constantly changing with new features being introduced, and old features being retired constantly.

Sometimes though, a new feature doesn’t quite do what the platform developers intended. Maybe it doesn’t work properly, or perhaps it just doesn’t have the outcome they were expecting. When that’s the case, it’s removed to make way for newer and better.

Download Now: Social Media Trends in 2022 [Free Report]

This is exactly what happened with Twitter Fleets. That’s right, after just 10 short months, Twitter Fleets have been discontinued.

The Short Life of Twitter Fleets

When the production team over at Twitter designed Twitter Fleets, they were hoping to increase the number of new people joining Twitter. Fleets were highlighted at the top of the screen and were similar to Instagram Stories and Snapchat in that posts disappeared in 24-hours.

Ilya Brown, VP of Consumer Product said in a Twitter blog post from July 14th that, “We built Fleets as a lower-pressure, ephemeral way for people to share their fleeting thoughts.”

Snapchat has been building loyal followers since it debuted in July of 2011, and Instagram Stories became a thriving feature for users of the platform in August of 2016, allowing them to share images and videos with their audience which disappear within 24 hours. The idea that Twitter users might enjoy the same low-pressure posting seemed reasonable enough.

The main goal for the feature was to attract more users, Brown said, “Although we built Fleets to address some of the anxieties that hold people back from Tweeting, Fleets are mostly used by people who are already Tweeting to amplify their own Tweets and talk directly with others.”

The announcement in early July had many people wondering why Twitter Fleets was discontinued. Well, after implementing the feature and testing it out for several months, they saw no notable increase in the number of new people on Twitter and decided to ax the project.

It’s now back to the drawing board for Twitter as they look for new ways to inspire people to join the conversation, not only by sharing others’ Tweets but also by creating their own. Brown said that they are using what they learned during this experiment to optimize some of their other features and improve the experience for their users. They found that the top of the timeline is still a great spot to highlight what’s happening now so users will still see Spaces up there when someone they follow is “hosting or speaking in a live audio conversation.” They’ll also explore different updates to improve photos and videos such as the full-screen camera, text formatting options, and the use of GIF stickers.

Social media platforms don’t usually act that quickly to remove a feature that’s producing sub-par results. While Twitter Fleets may not have done what it was intended to do, it has shown the world that if something isn’t working, it can be shut down quickly.

Alternatives to Twitter Fleets

With Twitter Fleets gone, many social media users are looking for alternatives. For now, it looks like Snapchat, Instagram Stories, and Facebook stories are the best options for those looking to post quick pieces of content that are live for 24 hours.

For brands looking to stay connected with their communities on social media, Instagram stories are currently best for reach. According to Rival IQ, brands that have the highest engagement on Instagram post stories approximately 16 times per month, sharing one to three frames each time.

As mentioned before, the social media landscape is constantly changing. There could be an existing platform adding new functionality, or an entirely new social media platform in the works as we speak. We’ll just have to wait and see what’s next on the horizon.

New call-to-action

Categories B2B

Why Millions of U.S. Employees are Quitting Their Jobs and How Companies Can Navigate

The past two years have been anything but consistent.

The pandemic left the United States in the worst recession in history. People struggled to adjust to remote work, and what we defined as “normal” varied day-by-day.

And yet: Out of that turmoil and inconsistency, we now see a record number of people quitting their jobs in pursuit of better opportunities.

According to the U.S. Bureau of Labor, 4 million people quit their jobs in April 2021, and July saw another 4 million leave.

Which leads me to question: Amidst the past two years of unpredictability — and a resulting lack of security — why are so many people taking the leap now?

Here, we’ll explore what employee turnover is, how much it could be costing your business, and how to calculate employee turnover. Plus, how employers can minimize the effects of what’s being called the Great Resignation, according to experts.

Download Now: Free Company Culture Code Template 

What is employee turnover?

Employee turnover refers to the percentage of employees who leave your company during a given period of time.

Your company’s employee turnover rate includes anyone who leaves for any reason. This includes resignations, terminations, or retirements. However, turnover rate typically doesn’t include internal movement, such as an employee switching teams or being promoted.

Turnover can cost a business thousands — if not millions — of dollars, and can negatively impact team morale and performance.

All of which is to say: The lower your turnover rates, the better. Low turnover rates signal a healthy, engaging company culture— which is critical for any business’ long-term success.

To determine how your company’s turnover rates compare, let’s explore average turnover rates by industry next.

Employee Turnover Rates in 2020 (By Industry)

Employee turnover rates vary by industry, so you’ll want to do your own research to determine how your company’s turnover rates stack up against competitors.

However, to give you a sense for an appropriate range, let’s take a look at a few turnover rates by industry as reported by the U.S. Bureau of Labor(it’s important to note, these turnover rates are from 2020, which had unusually high turnover rates):

  • Professional and business services: 69.2%
  • Health care and social assistance: 45.2%
  • Trade, transportation, and utilities: 60.5%
  • Retail trade: 69.7%
  • Leisure and hospitality: 129.3%
  • Government: 24.2%
  • Real estate and rental and leasing: 49.4%

Next, let’s look at average employee turnover rates.

Average Employee Turnover Rates

In 2021, the overall turnover rate across industries was 57.3% — but that drops to just 25% when considering voluntary turnover alone.

Voluntary turnover trends continue to rise. In fact, the Work Institute’s 2020 Retention Report states that there’s been an 8% increase in turnover rates since 2018, and an 88% increase since 2010.

Average turnover rates varies significantly depending on your industry. However, a 90% employee retention rate is generally considered good — which means the closer you can get to a 10% turnover rate, the better.

Cost of Employee Turnover

The cost of employee turnover is broken down into the costs of four factors — the cost to terminate, the cost to hire a replacement, the vacancy cost (i.e. how many days the job is open multiplied by the average value of the job per day), and the productivity cost (i.e. how long it takes the new hire to get up to speed).

Josh Bersin of Deloitte says the cost of losing an employee can range from tens of thousands of dollars to 1.5-2X the employee’s annual salary. This means, if you lose an employee who was making $70,000, you can expect to lose upwards of $140,000.

Alternatively, the Work Institute cites the cost of employee turnover at roughly 30%of the employee’s salary — meaning, if you lose an employee who was making $70,000, you’ll expect to lose closer to $21,000.

Employee Benefit News suggests a similar turnover cost at roughly 33% of a worker’s annual salary.

So, whichever way you slice it … you stand to lose a lot of money with each individual employee who leaves. Of course, turnover costs are so difficult to quantify because they’re so specific to each employee’s role and salary.

When determining your own turnover costs, you’ll also want to keep in mind the negative impact high turnover rates can have on company culture and employee productivity — which could lead to even more lost revenue down the line.

How to Calculate Employee Turnover [Plus High and Low Rates]

To calculate your turnover rates, you need to divide the number of employees who leave your company by the total average number of employees, and then multiply by 100.

And, to find your average number of employees, you’ll want to take the number of active employees at the beginning and end of each period, and then divide by two.
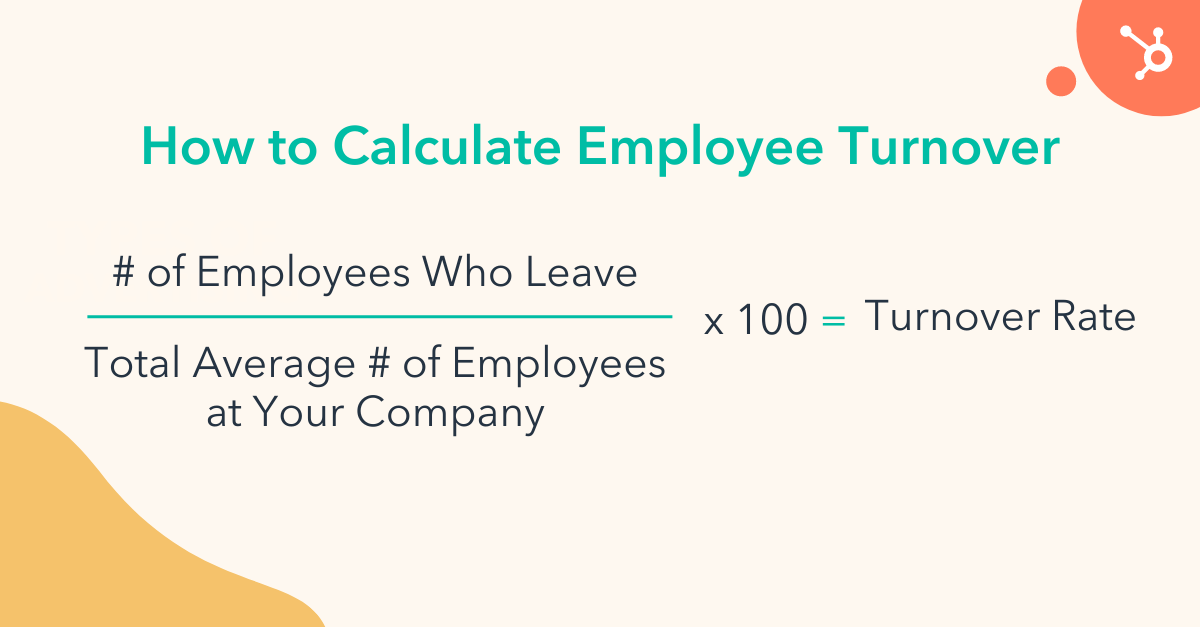
how to calculate employee turnoverTo understand this concept, let’s consider an example. If you have 1,200 employees at the beginning of the month, and 1,250 at the end of the month, your average number of employees on a monthly basis is 1,225 (1,200 + 1,250 / 2).

Now, let’s calculate your monthly turnover rate. In the month of September, if 7 people left your company, your turnover rate formula looks like this:
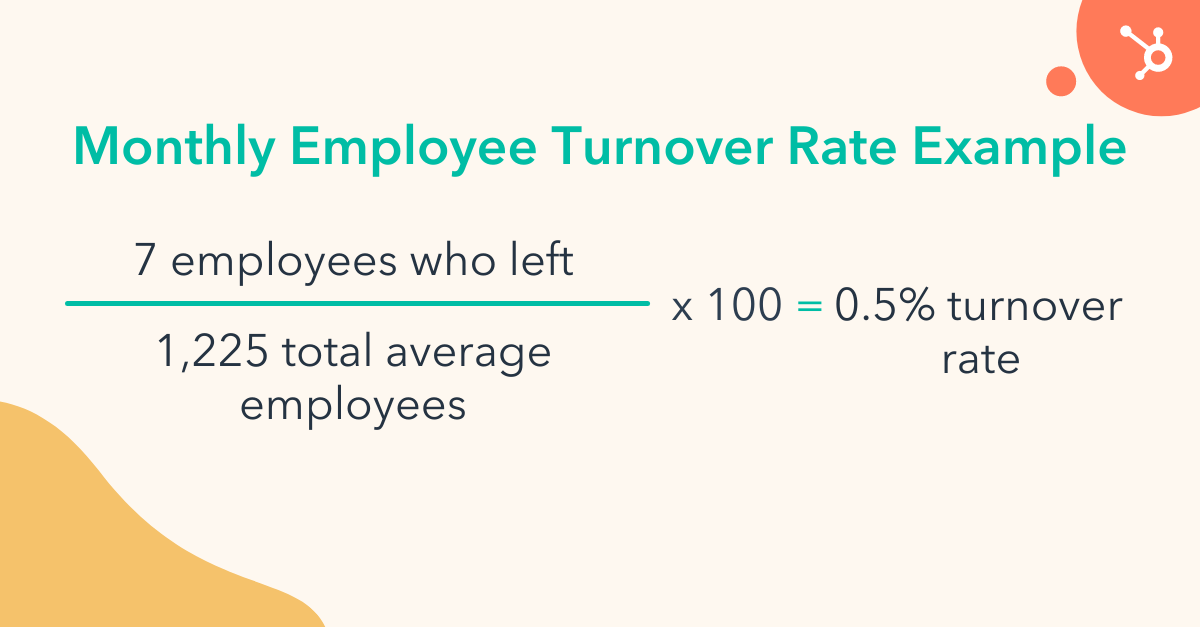
how to calculate employee turnover monthlyTo calculate annual turnover (which is typically the number companies use when assessing employee trends), you’ll want to find your average number of annual employees. If at the beginning of 2021 you had 1,200 employees, and at the end of 2021 you had 1,500 employees, your average number of employees is 1,350 (1,200 + 1,500 / 2).

Now, let’s calculate your annual employee turnover. If you had 200 employees leave in 2021, your annual turnover rate formula looks like this:
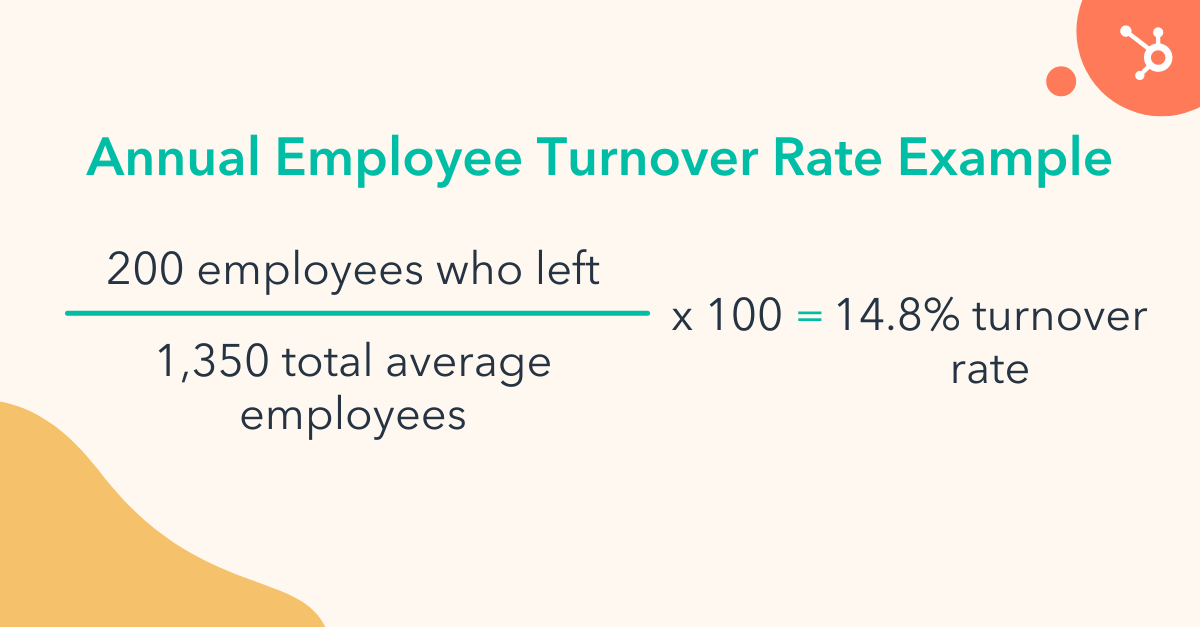
how to calculate employee turnover annualTo put these numbers into context, you’ll want to determine what a high and low turnover rate for your industry looks like, since turnover rates vary greatly depending on industry. For instance, retail and e-commerce saw a 30.7% turnover rate in 2021, while the technology industry’s turnover was roughly 20%, and financial services was closer to 15%.

Why is turnover so high?

To reduce employee turnover, we first need to understand what’s causing it.

For starters, we’re seeing employee turnover increasing on a national scale. The Labor Department reports that job openings outnumbered the unemployed by more than 2 million in July as companies struggled to fill positions.

Additionally, Microsoft’s 2021 Work Trend Index predicts 40% of the global workforce will consider leaving their employer this year.

This extreme workplace shift — being called the “Great Resignation” — is due to a variety of factors.

To better understand the high turnover rates of the past year, I spoke with Lily Zheng, a Diversity, Equity & Inclusion Strategist and Consultant.

Zheng told me, “We call it a great resignation but it’s more of a great correction. These are employees who had already resolved to leave in 2020 but felt they couldn’t.”

Our HubSpot Blog analyst further investigated this issue by polling 500 marketing professionals to learn why turnover was high at their companies. (Those polled belong to both B2B and B2C companies.)

As shown below, 41% of respondents cite lack of work-life balance as the primary reason for high turnover. Another 37% additionally cite a lack of flexible work schedules.
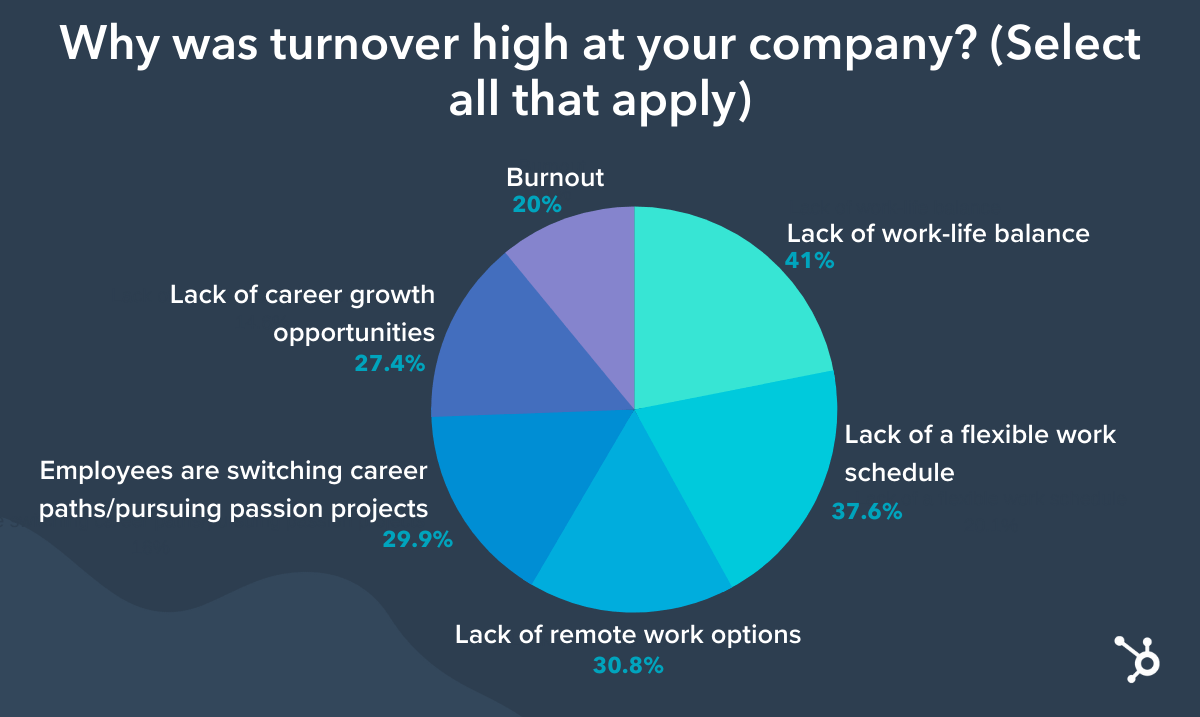
why was turnover high in 2020 and 2021

HubSpot Blog Research

In 2020 and 2021, flexibility, autonomy, and the ability to work from anywhere became a necessity as the world shifted to a pandemic and post-pandemic workforce. And even as offices begin to re-open, we see employees continue to prioritize work-life balance and flexibility.

A few other factors? Lack of remote work options, lack of career growth opportunities, burnout, and employees switching careers to pursue other passions.

For better or worse, the pandemic permanently shifted people’s mindsets when it comes to what they value. And one of the biggest value shifts is a newfound prioritization of time.

Simply put, people will work hard for your company if you enable them to choose when, where, and how they work best.

Next, let’s explore a few tips for reducing employee turnover at your organization.

How to Reduce Employee Turnover

1. Give employees a remote or hybrid option (if conducive to your business and work culture).

Now that people have settled into a remote lifestyle, many of them don’t want to return to the office. In fact, when HubSpot surveyed roughly 500 marketers, 40% of respondents said they’d like to continue working remotely full-time even when given the option to return to the office.

A remote lifestyle enables employees to dedicate more time to priorities outside of work. For instance, I have one colleague who now spends her mornings journaling and meditating — which greatly outweighs her old mornings of being stuck in traffic on her commute to work.

I have another colleague who spends lunch break with his kids.

People have recognized the amount of valuable time they win back when they’re fully remote. So if your company doesn’t offer remote or hybrid options, some of your employees will inevitably leave.

2. Prioritize your employees’ well-being.

Promoting wellness at work has been proven to result in better productivity and less employee turnover — which is why it’s a critical strategy to consider when aiming to reduce turnover.

As Lily Zheng writes in her LinkedIn post with over 19,000 reactions, “Your employees aren’t leaving just because they’ve found better opportunities elsewhere. They’re leaving because this is the first chance they’ve gotten to re-balance the scales of their own wellbeing and success, scales that you and your company swung out of whack during the pandemic.”

Seeing as the post received over 19,000 reactions, I’m willing to bet many employees — and employers — agree that, in some instances, well-being wasn’t prioritized by companies in 2020.

To invest in your employees’ well-being, consider creating a wellness program, which includes strategies aimed at increasing physical activity, reducing employee stress, and offering information on nutrition and health.

Additionally, a few big factors that contribute to a positive workplace experience include flexible work hours, an emphasis on autonomy, an investment in diversity and inclusion, and a focus on employees’ mental health and psychological safety above all else.

3. Foster a sense of belonging.

If you want to reduce turnover, take belongingness seriously.

A sense of belonging is undeniably critical for long-term employee satisfaction. In fact, there’s a 91% correlation between employees who say they belong and those who stay engaged at work, and a 50% drop in attrition among employees who report a sense of belonging.

As Belonging Strategist and Managing Director of BelongingIQ Abam Mambo puts it, “Employees who feel a sense of belonging tend to stay engaged, productive, and are far less likely to leave than those who feel excluded. So if you want your good employees to stay, invest in belongingness.”

How can you invest in belongingness? While this list isn’t exhaustive, Mambo lists a few strategies you can implement to begin facilitating a sense of belonging on your team:

  • Appoint and pipeline inclusive leaders
  • Recruit and empower a diverse workforce
  • Implement fair and equitable employment practices
  • Reward performance
  • Reframe your ‘speak-up’ program to ensure employees are heard, treated fairly, and not retaliated against

Ultimately, a sense of belonging contributes to an employee’s sense of pride, happiness, and satisfaction at work. So investing in belonging won’t just help your turnover rates — when done right, it will also positively impact your bottom line, as employees who belong are also employees who are engaged.

abam mambo quote on turnover rates-1

4. Use a net promoter score to measure employee satisfaction.

A net promoter score (NPS) survey can help you measure your employee satisfaction, and how likely your employees are to suggest your workplace to friends or family.

The survey uses a 0-10 scale, and those in the high range (between 9-10), are your most loyal and engaged employees who will help fuel your growth through word-of-mouth. The next batch (scoring between 7-8), are satisfied but slightly more indifferent — these are employees who are more susceptible to competitors’ offers.

And, finally, you have your lower scorers (between 0-6). This signifies a group of employees who aren’t fully satisfied at your company. These people are less engaged and more willing to leave.

To lower turnover rates, it’s vital you determine what’s working for your employees, and what isn’t. If you aren’t measuring employee satisfaction, there’s no way for you to know how to improve it. A NPS can help you determine weak spots in your current culture and opportunities to strengthen your employee offerings, which will enable you to keep more employees around for the long-haul.

5. Offer competitive pay and benefits.

Earning more money is the top reason people leave jobs. In fact, PayScale research found 25% of people surveyed left their jobs for higher pay — ranking far above people who left because they were unhappy, wanted more flexibility, or needed to relocate.

Offering competitive pay depends on a variety of factors. You’ll want to consider your geographic area and industry to determine a baseline competitive rate.

Additionally, it’s important to keep in mind the level of expertise for which you’re hiring, as well as supply and demand — for instance, if you’re looking for a senior developer and you know the pool of developers is relatively small in your area, you might need to increase base pay to compete.

If you can’t increase base rate, consider offering competitive benefits packages, instead. Tuition reimbursement, PTO, flexible hours, fitness discounts, and parental leave are all factors to consider when creating a comprehensive employee benefits package.

6. Provide professional development opportunities.

Learning and professional development matters for long-term employee satisfaction.

Consider, for instance, how 94% of employees would stay at a company longer if the company invested in helping them learn.

Additionally, did you know Gen Z learners watched 50% more hours of learning content in 2020 compared to 2019?

Ultimately, the desire to learn and grow is fundamental to human nature. So investing in training and development opportunities is vital for reducing employee turnover.

As Greenhouse’s Director of Talent Acquisition Ariana Moon puts it, “Investing in growing and up-skilling employees is especially important in the context of our rapidly evolving digital environment today.”

Moon says, “Recognizing the talent you have and prioritizing internal mobility is not only key for retention and engagement, but also a win-win for your company due to opportunities to cross-pollinate knowledge and skills across teams.”

While Moon acknowledges the hesitations some team leaders might feel when considering internal mobility programs (due to anxiety about vacancies they’ll have if people move off their teams), she says it’s ultimately critical for the success of the business as a whole. 

As Moon puts it, “Companies need to think holistically about how internal movement can benefit the overall business — through improving morale and productivity, elongating tenure due to new opportunities for growth, and developing employees who have multifaceted skill sets and are more resilient to change.”

At HubSpot, we offer development and training courses that focus on clear communication, leading effectively, giving and receiving feedback, and expanding impact. These trainings are offered by HubSpotters, for HubSpotters.

To create an effective learning and development program, you’ll want to map out a clear career growth plan for each department. Next, you’ll need to determine which skills are vital for each role. Once you have a list of skills, you can begin mapping out a plan that includes training and development opportunities for each of those necessary skills.

7. Be thoughtful and strategic when hiring new candidates.

Retention rates will vary greatly depending on your hiring process. The more time and effort you can put into finding the right candidate(s) who will fit well into your existing organization, the less likely you are to see high turnover rates. 

As Co-Founder and CEO of Crosschq Michael Fitzsimmons puts it, “Historically, hiring managers have been incentivized to increase headcount as fast as possible, but the data shows that approach is a losing proposition. As recruiters work quickly to keep pace with filling roles, they rely on imperfect gauges for candidate quality — including resume claims, interview feedback, and perhaps traditional reference checks.”

“Unfortunately, these methods are scattered at best, introducing bias and frankly, noise. In fact, Crosschq’s research has shown only a 9% correlation between interview scores and the quality of a hiring decision.”

Fitzsimmons adds, “The finish line isn’t the new hire’s first day on the job … it’s the productivity, culture fit, and retention of that hire for months and years to come. It’s important to align what you’re hiring for with what you’re expecting on the other side.”

To improve your hiring strategy, Fitzsimmons recommends modernizing your hiring tools and processes to better leverage data insights for improved hiring decisions. 

Additionally, it’s vital you’re clear and honest upfront with candidates about a role. Even though it might be tempting to paint an unrealistic picture of a role to secure high-quality candidates, it’s better in the long-run if you ensure your candidates are fully aware of both the perks and challenges of each role before they’re hired.

Ariana Moon agrees that hiring is vital for long-term retention — as is onboarding.

She told me, “Many industry surveys have shown that over 85% of new hires make the decision [to stay or leave] within the first six months of employment. That number can be traced back to the onboarding experience. 69% of employees will stay for longer than 3 years if their onboarding experience is good, while 1 in 5 will leave within 45 days if it’s bad.”

To improve your onboarding process, Moon suggests taking a hard look at your programming through the lens of various employee personas, and focus on creating experiences where each new hire can feel heard, represented, supported, and enabled for success.

8. Develop an inclusive culture for distributed teams.

Inclusivity is undeniably paramount for ensuring each employee feels valued — but as the workplace changes, you’ll need to adjust your approach to ensure you’re still creating an inclusive environment for a hybrid or fully remote team.

“To create an inclusive culture,” Zheng told me, “I’d first encourage employers to show humility and admit you don’t know the best solutions for a new, hybrid environment. Host focus groups and listening sessions, and ask your employees what would be ideal for them — and then collect the data.”

As Zheng describes, an inclusive workplace will look different for everyone. Perhaps your data shows your team wants to return to the office — in which case, the ideal solution is to support a return-to-office policy.

Alternatively, maybe your workforce has people who want to feel a greater sense of connection, but don’t necessarily want to return to the office. “In that case,” Zheng says, “maybe you’d benefit from considering a model where you ask people to come back to the office for social activities or team-building activities, but outside of those activities you support remote work.”

Of course, if you have a distributed team with employees across the globe already, you’ll want to brainstorm how you can create a more inclusive culture in a fully remote environment.

Reducing employee turnover will likely require more than just the eight tips mentioned above. Employee satisfaction varies between industries and individual companies, so you’ll want to take the time to research what truly drives people towards — or away from — your business.
lily zheng quote on turnover rates

And, as Zheng reminds me — reflection is key. “It’s important for employers to recognize that employees have a lot of power right now, and so it’s not the time to be complacent … And, [as you reflect on your employees’ experience], go back and consider which aspects of the ‘status quo’ have always failed a large portion of your workforce. What do you need to reckon with if you want to survive into 2022 and beyond?”

Ultimately, the pandemic shifted people’s perspectives and values when it comes to work. And that’s not necessarily a bad thing. If you notice your turnover rates are higher than normal, consider what you need to change to remain competitive in a post-pandemic landscape.
company culture template