Categories B2B

How to Come Up With a Brand Name [+Where 3 of Our Favorites Came From]

Coming up with a brand name is one of the most important steps in starting a business. A well-thought-out name can propel your company forward, and the wrong name can become a marketing nightmare. Where would Amazon be today if it stuck with its original name, Cadabra?

Oftentimes, founders think they know what makes a good brand name. But choosing a vague reference or visionary ideal (like Cadabra) for a name can confuse customers.

Naming a brand isn’t as simple as creating a made-up word or picking a name that looks great on paper.

Fortunately, setting up a brand naming process can ensure your name is relevant, memorable, and meaningful. It helps you select a name that catches people’s attention and is easy to remember, which makes marketing, sales, and brand awareness that much simpler.

To help your business become a household name, we’ll explore how to come up with a brand name, cover brand naming guidelines, outline a brand naming process, and share examples of how popular companies decided on their brand names.

What Makes a Good Brand Name

A good brand name is a blend of creativity and strategy. It highlights your company’s mission, vision, and values while showing off personality and creativity.

Josh Reeves, the CEO of Gusto, put it best when describing how his team came up with the company’s name. “Choosing your name…will power everything else forward – the visual design, the way you message it to the team, the way you talk about it with customers. So if you’re going to sink your time and energy into anything, it should be this.”

Strong brand names tend to fall under one (or more) of these categories:

  • Descriptive: Brand names that tell potential buyers exactly what you do or make. Examples: Dude Wipes, The Weather Channel, Booking.com, and PayPal.
  • Evocative: These names use metaphor and suggestion to express a company’s creativity, hint at its values, and tell a brand story. Examples: Nike, Amazon, Virgin, Uber, and Patagonia.
  • Blends: Names that combine two words to make a new word are popular today, and they can be considered descriptive and evocative. Examples: Photoshop, WhatsApp, Headspace, Airtable, and YouTube.
  • Invented: Made-up names are a good way to differentiate your company and show your unique brand identity. But you’ll have to do more work to tell the story of your company and educate customers on your offering. Examples: Google, Pixar, Garmin, Slack, and Zoom.
  • Acryonymic: Good brand names are short and memorable, so it may make sense to use an acronym if you want a long name. Keep in mind that meaning is often removed with an acronym, so it’s not the best option for storytelling. Examples: VRBO, BMW, IKEA, UPS, and IBM.

Brand Naming Guidelines

Boundaries are necessary when picking a company name. Without a structure or limits, you can end up with wacky names that have nothing to do with your brand. These brand name guidelines can help you stay on track throughout the process so you wind up with a name that fits your business.

Easy to pronounce and spell.

Even famous brands run into issues with mispronunciation. But you don’t want stakeholders, potential customers, or employees scouring the internet to understand your company’s name. Keep it simple to say and spell, so it doesn’t distract people from your products or services.

examples of brand names with confusing pronunciation

Image Source

Memorable

I don’t know about you, but I never run to the store for “facial tissues.” Brands like Kleenex, Chapstick, and Band-Aid are such noteworthy names, people use them as generic terms. So when you come up with a brand name, choose one that sticks in people’s minds to help raise your awareness above competitors.

band-aid: an example of a strong brand name

Image Source

Meaningful

Brand names that hint at company stories make it easier for customers to connect your values to the brand. Think of the investing platform, Robinhood. The fictional story is about a bandit who steals from the rich to give to the poor, which aligns with the company’s ethos of “Investing for Everyone.”

Robinhood, an example of a meaningful brand name

Image Source

Strong Visual Identity

Words have power, but it takes about 10 seconds of looking at a logo for someone to form an impression about your brand. Beyond the other elements, your brand name must look great on paper and online. Experiment with text logos and graphics to see if the name is too long or difficult to design around.

How to Name a Brand

Now that you have name inspiration and guidelines to follow, it’s time to explore the details of how to name a brand. This approach is most effective when paired with your brand positioning strategy, so take time to do that work before jumping into the naming process.

1. Outline your brand goals and identity.

Defining your identity and goals solidifies what sets you apart from the competition and how you plan to position your company. You can pull this information from your positioning statement. If you don’t have one yet, ask yourself the following questions:

  • Why does your company exist? This is your vision.
  • What does your company do? This is your mission.
  • How do you do what you do? This refers to your values. Fun fact, 89% of shoppers are loyal to brands that share their values.
  • What brand identity do you want to create? This is your brand personality.
  • What do you want to accomplish with the brand name? Maybe you want customers to immediately understand your offering, or maybe you want to highlight your innovative spirit.

Once you answer these questions, it’s time to look outward.

2. Consider your customers and competitors.

No brand succeeds in a silo, so it’s essential to pick a name that resonates with your audience and within your industry. That’s because people often identify themselves with the brands they buy. This is good news for companies, as customers with an emotional relationship with a brand have a 306% higher lifetime value.

When coming up with a brand name, consider customer reviews and surveys. This feedback can show how people perceive your brand, which is helpful when brainstorming names. If customers talk about how fun it is to work with your team and use your product, it wouldn’t make sense to adopt a serious brand name or persona.

Another crucial consideration is your industry. What are the naming norms? What are your competitors doing? Based on your brand positioning, you have to decide whether to follow the industry formula or choose an unconventional name that makes your brand stand out.

3. Brainstorm and discovery.

Yes, it’s time to break out the whiteboard. But before you jump in, put together a team for ideas and approvals. You need to define who is involved in the decision-making process. If you’re a solopreneur, you can ask a few trusted peers or colleagues to take part.

Fill up your board with whatever ideas come to mind, and if you get stuck, think about:

  • The adjectives that describe your service, product, or brand
  • How customers feel about your brand, or how you want them to feel
  • Words that you want to associate with your business

As you ideate, reflect on what you think makes a good brand name and consider any major concerns you have about naming. Feeling stuck? Try Shopify’s business name generator tool.

4. Refine your ideas.

You probably have a long list of brand names — and that’s a good thing. It’s easier to chop than to create. Start culling down your list by considering the following factors for each name:

  • Does it fit your brand personality?
  • Does it have emotional resonance?
  • Does it have meaning or connect to your company story?
  • How does it look on paper and on a screen?
  • Are there any trademarks for it?
  • Are the domain name and social media handles available?
  • Does it stand out from the competition?
  • Is it short, memorable, and easy to spell and pronounce?

Create a shortlist of 10-15 names for the next step. If you have less than this, that’s okay — just aim for three to five options.

5. Get feedback.

There’s nothing like asking your team, customers, stakeholders, or peers for feedback. You’ll quickly learn if a name contender is difficult to pronounce or rubs people the wrong way. If possible, ask a diverse group of people for their opinions individually so you don’t run into groupthink issues.

Once you’ve collected feedback, it’s wise to see how the final options translate across languages. Consider where your company will operate and where you hope to expand. Wix learned this lesson the hard way, but the humor-oriented brand handled it well.

Before making a final decision, take a look at how a few popular companies came up with their brand names.

How Three Companies Came Up With Brand Names

From spelling errors to company-wide brainstorms, there are plenty of stories that highlight the creativity and complexity of the brand naming process. Check out how these three brands decided on a name.

Gusto

Originally named ZenPayroll, Gusto rebranded three years after its launch. The company had thousands of customers and a team that questioned if a new name was essential. Josh Reeves, CEO, and co-founder said the original name was chosen out of convenience. But the founders knew it was temporary.

To expand beyond payroll service into health insurance, ZenPayroll needed a new name and logo. The team wanted to combine their values at the time — peace of mind, calm, warm, trusting, and vibrant — with their vision for the future. “We wanted to capture our emphasis on the people doing the work,” said Reeves.

The result? Gusto, which means enjoyment or vigor in doing something; zest. Here’s the evolution of Gusto, from the original brand to today’s identity.

zenpayroll, the original brand name for Gusto

Gusto's logo shortly after rebranding

Gusto's current logo

Image Source

Warby Parker

“Coming up with the name ‘Warby Parker’ was one of the hardest things we did as a founding team,” said Neil Blumenthal, the company’s co-founder, and co-CEO. As the story goes, the team came up with over 2,000 ideas over the course of six months before choosing the final brand name.

Their inspiration? A Jack Kerouac exhibition at the New York Public Library that contained a journal with two interesting characters: Warby Pepper and Zagg Parker. The founders had all been inspired by Kerouac and the beat generation ethos of taking the road less traveled. Soon after, the rebellious Warby Parker brand was born.

how to name a brand - Warby Parker example

Image Source

HubSpot

As fellow graduate students, HubSpot co-founders Brian and Dharmesh noticed that consumers had gotten really good at ignoring interruptive ads and bids for their attention. They started HubSpot on the idea of “inbound,” the notion that people would rather be helped than harassed by marketers and salespeople.

According to the book, “Marketing Lesson from the Grateful Dead” by Brian Halligan and David Meerman Scott, the name HubSpot sprung from the vision to create a hub-based ecosystem that united software, education, and community to help businesses grow better. That idea, “combined with the double-entendre for Boston (nicknamed The Hub [of the Universe])…made it a good choice.”

What’s Next?

With a powerful brand name, you’re ready to design the visuals that bring it to life. Learn how to make a unique brand identity that draws in customers, successfully launch a product, and create a brand that keeps people coming back.

brand consistency

Categories B2B

The Best Social Media Channels for Marketing in 2022, According to Company & Consumer Data

Every day there’s something new on social media.

Recently, Twitter introduced Twitter Blue, a premium subscription-based version of its platform.

Download Now: Social Media Trends in 2022 [Free Report]

TikTok took the social media world by storm back in 2020 and still remains the most downloaded app of 2021, according to Social Media Today. Instagram is regularly adding new features to its platform, recently testing a new affiliate tool for influencers.

The question is, how are these changes impacting how consumers behave online? Are users moving away from Facebook?

Let’s see what the data says and what it means for brands.

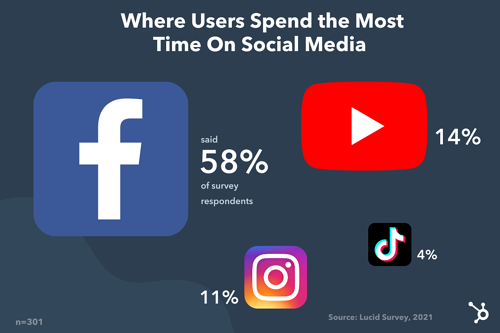
We surveyed 301 people in the United States and asked, “Which social media platform do you spend the most time on each week?” The response was kind of surprising.

Where users spend the most time on social media

Despite YouTube’s steady growth over the past year and the rise of TikTok and Clubhouse, Facebook remains the top social media platform. YouTube follows, with the gap between the platform and Facebook much smaller in larger surveys.

So, what does this information really mean?

Well, in a broad sense, it means you should consider having a presence on these platforms. However, don’t delete your Instagram account just yet – better yet, don’t delete it at all.

I’ll explain why later.

Which Social Media Platforms Marketers Are Prioritizing

In 2022, Facebook is the number one social media platform marketers are focusing on, according to HubSpot Blog Research.

When asked which social media platform they plan to invest the most in for 2022, 25% answered Facebook, 20% said YouTube, 16% said Twitter, and 15% said Instagram.

Facebook seems to generate the highest quality leads for marketers, according to the data, which explains why marketers are leveraging this platform the most.

TikTok is another popular platform that 52% of marketers surveyed plan to increase their investment in. There are two reasons for this: The first is that short-form video is growing and increasingly becoming the number one content format. In fact, it’s the format 26% of marketers are leveraging the most in 2022.

In addition, 46% of marketers surveyed said that TikTok offered the highest ROI among other platforms like Twitter and YouTube.

When it comes to emerging platforms and/or features, marketers are keeping an eye on YouTube Shorts. According to 2021 HubSpot Blog Research, 83% of marketers plan to increase their investment in the short-form video feature, a TikTok competitor.

Facebook Live Audio and Twitter Spaces are also top features marketers plan to increase their investment in for 2022.

This focus on audio and short-form video platforms reflects 2021 HubSpot Blog Research that revealed that marketers are investing most in short-form videos and live audio chat rooms in 2022.

According to the data, most marketers (over 60%) say short-form videos are the most effective format and offer the highest ROI, followed by live videos and live streaming. As for audio, 44% of marketers plan to leverage it for the first time in 2022.

The key takeaway is that audio and short-form video platforms will play a much bigger role in marketers’ strategies in 2022 than they have in the past.

Which Social Media Platforms Are Losing Steam

When Clubhouse first launched in 2020, it gained steam very quickly with its unique live audio concept. Its invitation-only model also helped build excitement around the platform.

Today, the platform is open to the public and seems to have lost its edge, as other (and bigger) social platforms launch their own version of live audio.

HubSpot Blog Research conducted in 2021 found that 15% of marketers plan to decrease their investment in the app for 2022.

Snapchat is another platform that marketers are divesting from. Our research found that when it comes to influencer marketing this year, 20% of marketers are planning to decrease their investment in Snapchat.

It also revealed that Snapchat offers one of the lowest ROIs, behind Pinterest and Twitch.

So, does this mean you should stop marketing on Clubhouse and Snapchat? Not if your audience lives there and your brand sees an average to high return from it.

Take this data as a guide to keep you informed on industry trends and insights, not a strict playbook. So, if your data suggests that these platforms are worth investing in, continue to do so.

Should brands limit their efforts to the most popular platforms?

There’s no single, clear-cut answer to this… but typically, no.

While most consumers may spend most of their time on Facebook and YouTube, that doesn’t mean you should dedicate all your efforts entirely to those platforms.

Why? That may not be where your audience lives.

Generality is the enemy of marketing. Imagine running a social media ad that targets everyone. Or having a target audience comprising all of Gen Z.

This sort of one-size-fits-all isn’t conducive to your brand’s growth. In fact, it is likely keeping you from making progress, as you waste time and resources on broad strategies that may not work for your specific market.

It’s like going to a party and only getting an address for the neighborhood. Sure, you could drive around and knock on every door until you find the right one, but by that point, you might be tired, hungry, and out of gas.

When you zero in on a specific audience and strategy, you can gain more valuable insights and get a higher return on investment.

Data, just like the one above, should be used as a general guide to understanding consumer behavior. However, it shouldn’t dictate your entire strategy. Your own consumer data and user persona(s) should.

For instance, let’s say you’ve discovered through market research that your audience enjoys consuming information mostly through blogs and podcasts. That’s a good indicator of where you should focus your efforts. In a few years, that data may change, in which case, your team should be flexible and move to where your audience is going.

Here’s what you should consider when determining where to direct your efforts:

  • Where your audience lives
  • The type of content you’ll be creating
  • The channel that converts the best

There are a few ways to figure out where your audience “hangs out” online. First, you can check the demographics by platform – this will give you a general idea of the audience.

For instance, TikTok mostly caters to a younger audience between 10 to 29 years old while most Instagram users are between 18 to 34 years old.

You can also reach out to your target audience directly through polls and survey to find out where they spend their time. In addition, look to your competitors.

See where they’re focusing their efforts and if they are successful, that may be a good indication of where you should be. Like when you’re not sure you went to the right place but see someone you know parking and you can let out a sigh of relief.

Next is the type of content you’ll be creating.

Say your audience enjoys video content the most (think webinars, lives, video tutorials). In this case, your audience would be well suited for YouTube, Instagram, and TikTok, all of which have video editing and publishing features. You can then repurpose your content for each platform.

Another factor to consider is how each channel is contributing to your goals. This is where the importance of data comes in.

You may be posting every day on TikTok and find that the rare times you post on Facebook, you get much higher engagement and conversion rates. While there could be several reasons for this, you may want to redirect your attention to Facebook as it is providing the best return on investment.

Next, we’ll cover what software can help you keep track of your social media data.

Top Social Media Analytics Software

1. HubSpot

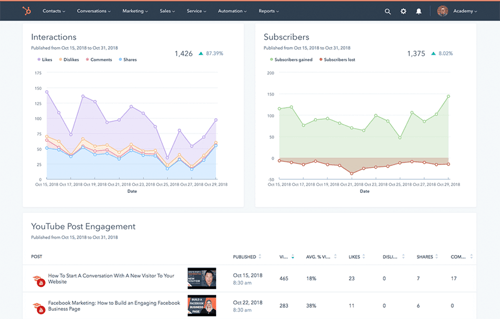
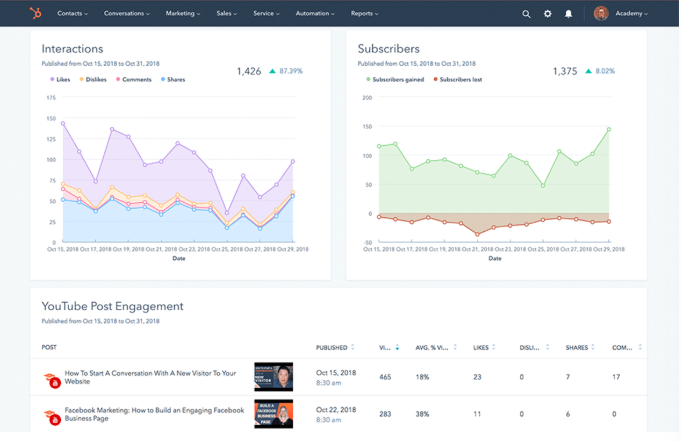
With HubSpot’s social media management software, you can track your social strategy from beginning to end.

HubSpot social media software

Image Source

With a user-friendly dashboard, you can see exactly how your published posts are performing, which channels are bringing traffic to your website and generating leads, and more.

You can also filter your reports by campaign, account, and date range so you can narrow down the exact information you’re looking for.

In addition, HubSpot’s social media software allows you to:

  • Schedule posts.
  • See how your competitors measure up.
  • Track and monitor conversations surrounding your brand on every platform.
  • Export and analyze relevant reports.

The social media tool is available within HubSpot’s all-in-one CRM platform for mid- to large-size businesses.

2. HootSuite

HootSuite empowers your team to make decisions quickly with real-time data on your social strategy.

Hootsuite social media software

Image Source

The social media software takes some of the guesswork out so that you can focus on the most important insights. With customizable dashboards, you can also get a quick overview of your key metrics and identify what’s driving traffic and sales.

Ranging from $49/month to custom pricing for enterprise-level businesses, you can find a plan that meets your needs and is scalable.

3. Sprout Social

If you have multiple social channels running at full speed and you’re overwhelmed with the data, Sprout Social can help.

Sprout Social social media software

Image Source

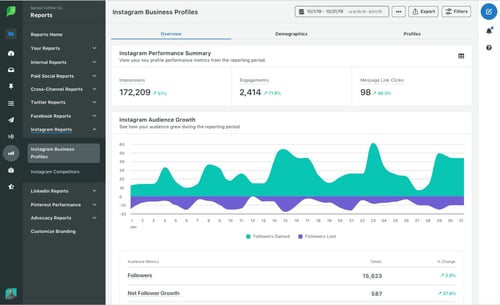
The platform helps you manage your data and create ready-to-go reports to share with stakeholders.

In addition, you can use competitive intelligence to benchmark your performance and make informed decisions that will promote your brand’s growth.

Sprout Social’s pricing is based on a subscription model and ranges from $99 to $249 a month.

Now that you know where consumers spend their time online, the real work begins. Experiment with various strategies to see what resonates best with your audience, always using data and your user personas to inform your decisions.

Editor’s Note: This post was originally published in July 2021 and has been updated for comprehensiveness.

New call-to-action

Categories B2B

Which Social Media Metrics Are Marketers Tracking? [New Research]

We get it: Social media metrics are important. Getting data and ROI is really important. However, if you spend too much time trying to figure out which metrics are important for your business, you won’t have any time to analyze and act upon them.

That’s why we’ve made a list of the social media metrics that are essential to track, so you don’t miss out on important numbers that can help you later. These metrics will give you insight into customers, how to track ROI, improve your brand presence online, and walk away with happier customers.

Social Media Metrics are imperative to social strategy. They give you an inside look at how your channels are performing and how you are perceived by your target audience. They can also give provide you with ways to improve upon your strategy.

Download Now: Free Social Media Calendar

1. Audience growth rate

To measure your audience growth rate, begin by selecting a reporting period. Then, calculate your new followers over that specific period. After that, you’d need to divide your new followers by your total followers.

So let’s say your brand’s Twitter account has 6,000 followers in September, at the end of Q3. For Q4, you want to measure your audience growth rate from October 1st to December 31st. If by December 31st, you have 8,657 followers, then your audience growth rate for Q4 is 69%.

2. Social Media Impressions

Let’s say you decided to run a paid ad campaign across your company’s key social media platforms. Do you know how many people came across your ad? Social media impressions measure how many users were exposed to your content, and it’s a metric worth tracking.

Understanding your social media impressions is important because this data can provide valuable insight into how far your ad spend can go and can help inform future paid ad spend so you can maximize your budget.

However, even if paid ads aren’t a part of your strategy, you may still want to look into how many impressions your social media content is gathering over time. This data can tell you how different types of content are resonating with your audience across platforms.

It’s also worth noting that each social media platform measures impressions differently. For example, on Twitter, each user that sees a tweet is considered an impression. On Facebook, each time a paid ad is seen on screen, it is considered an impression. Instagram counts an impression each time a user views a piece of content (such as a static post, story, Reel, or IGTV). On TikTok, there is not an “impressions” measurement defined in the app’s analytics section, however, for your own data you could consider each video view an impression.

3. Social Media Conversion Rate

Your conversion rate is made up of the number of visitors to your website that take your desired action. This might mean that they downloaded your eBook, signed up for your newsletter, or clicked “Play” on your podcast. Conversion rates show how relevant your content is to your audience.

If you want to calculate the conversion rate, start by making sure your call-to-action link is trackable. You can do this by using a free, online URL shortener like Bitly. Next, analyze your campaign to identify the number of clicks and conversions your page has gained.

After that, divide your conversions by total clicks and multiply it by conversion rate. If your webpage has about 750 clicks and 200 conversions, then your conversion rate is 26.6%. Keep in mind that conversion rate numbers are not mutually exclusive, and can be low even if traffic is high.

4. Social share of voice

How many people are talking about your brand on social channels? Let’s find out.

Your social share of voice measures this data and shows how visible your brand is on social media. Finding these numbers could tell you whether you need to update your social strategy or not.

To calculate your social share of voice, measure your mentions across your social networks. Hint: Your social media analytics tools can be helpful when calculating this number. Next, add your mentions in tandem with the mentions of competitors, which can be tracked using an online social media tool like Sprout Social. This gives you the total industry number of mentions. Here is an example of what metrics of engagement would look like:

Engagement data exampleImage Source

After you divide your brand mentions by the total industry number, multiply this number by 100 to get the social share of voice percentage.

Let’s put this in perspective. Over a week, your brand has been mentioned directly and indirectly 100 times. Three competitors have 500 mentions, plus yours equals 600. Taking 100 divided by 600 and multiplying that number by 100 means your Social Share of Voice is 16.67%.

5. Social Media Engagement Rate

According to Kelly Hendrickson, Senior Manager of Social Media at HubSpot, engagement is a crucial metric for understanding social media performance.

She says, “No matter the scale of your business or social audience, quality engagement is what I always focus on. Where best-in-class social media marketing is a delicate balance behind providing your audience value while meeting business needs, your engagement rate is an indicator if you’re tipping the scales in the wrong direction. Audience first.”

Social media engagement is the total number of likes, comments, shares, and general interactions a piece of content or social media account receives relative to the size of the audience. Having a large following isn’t useful if the audience isn’t regularly interacting with the content they follow.

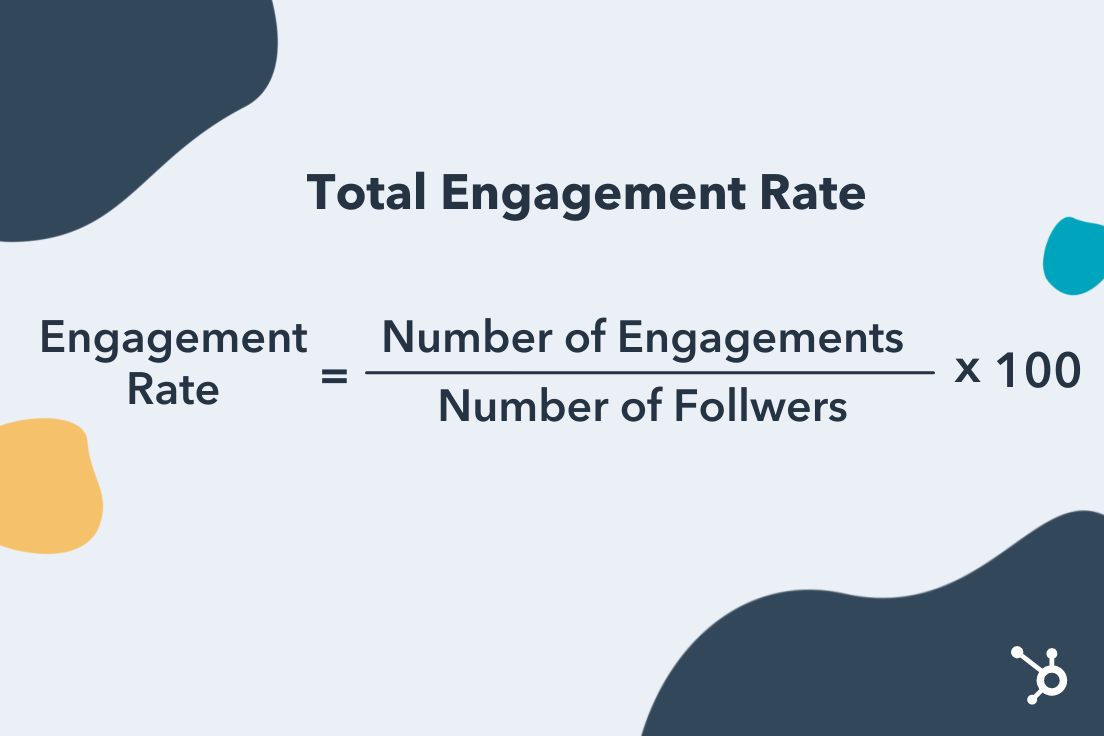
To measure the overall engagement rate of a social media account, you can use the following formula:

Engagement Rate = Number of Engagements / Number of Followers x 100

Social Media Metrics: how to calculate total engagement rate

Here’s how each major social media platform measures engagement:

  • Instagram: Likes, Shares, Saves, Comments, Direct Messages
  • Facebook: Click-throughs, Comments, Reactions, Shares
  • TikTok: Likes, Comments, Shares
  • Twitter: Likes, Comments, Retweets
  • Pinterest: Pins, Likes, Comments
  • LinkedIn: Reactions, Comments, Shares, Click-throughs
  • YouTube: Likes and Dislikes, Comments, Shares

6. Keywords

Tracking keywords can grow your social share of voice and audience growth rate. Keywords are certain words that search engines identify and target based on what audiences are searching for. A marketer in the tech industry might see the keywords, “Media Marketing,” and “Tech Channels.”

By tracking keywords, you can optimize your content to rank higher on search engines and grow your audience. You can track keywords by using social media analytics software, like Google Analytics or SEMrush.

7. Customer response rate

Customers love to engage with brands via social media.

In fact, in a survey done by Sprout Social, 74% of respondents engage with brands they follow on social media. Whether they’re asking your customer service team questions or leaving your business reviews, make sure you’re answering as many mentions as possible on social media. To track how you’re doing here, check your customer response rate.

To calculate your customer response rate, divide the number of responses you give to your followers/customers by the number of people who engaged with your brand and multiply this by 100.

For example, if you measured a week of engagement, and the number of customers who engaged with your brand was 50, and you responded to half of them, your customer response rate would be 50%.

8. ROI data

This is the big metric, the one you want to see from day one. Depending on your company and industry, ROIs can differ greatly. For social media, you probably want to know if the time and money you’ve spent on social media is turning into customers, sales, or brand awareness.

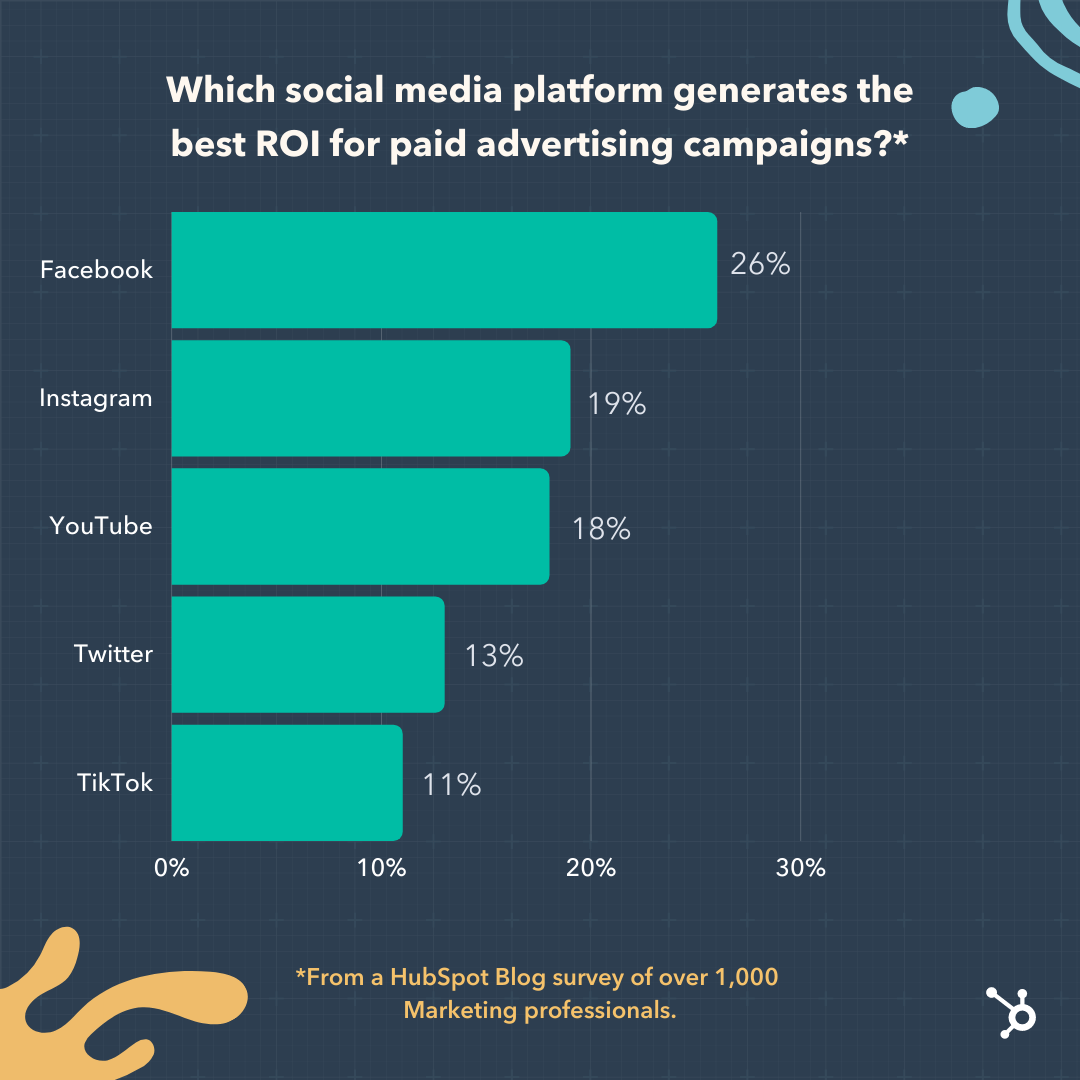
According to a group of 1,000 marketers surveyed by the HubSpot Blog, the following social media platforms generated the biggest ROI for paid advertising campaigns:

  • Facebook (26%)
  • Instagram (19%)
  • YouTube (18%)
  • Twitter (13%)
  • TikTok (11%)

Social Media Metrics: which platforms generate best ROI for paid advertising campaignsIn that same survey, marketers said the following metrics were their primary markers of measuring social media ROI in 2022:
  • Traffic to Their Website (35%)
  • Impressions/Views (31%)
  • Clicks (31%)
  • Sales (30%)
  • Likes/Comments (28%)

Since ROI looks different from one business to the next and calculations are based on your business goals, not every formula will look the same. But, use this formula to figure out a basic ROI. Let’s say you made $1500 in revenue from social media ads or eCommerce and your investment was $500. Your ROI is revenue subtracted from investment (1500 minus 500), which makes your profit $1,000 and your ROI 200%.

9. Channel reports

Keeping track of social media data is important so that you know where and how to focus your strategy. For instance, if one of your accounts just isn’t hitting their numbers, a report would let you know and allow you to proactively step in and troubleshoot.

If you need an update about say, channel performance, and follower counts, consider conducting a social media audit or using a social media analytics tool that conducts an audit for you.

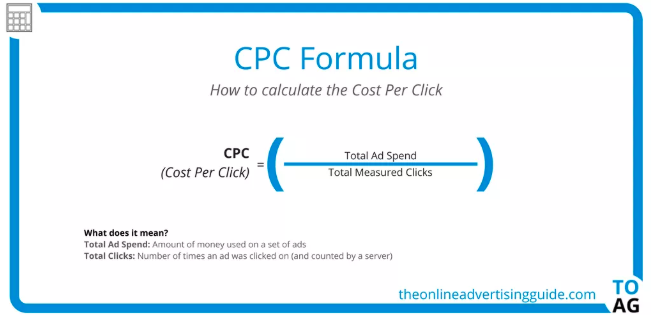
10. Cost-per-click (CPC)

This is an important metric if you’re investing in social media. Cost-per-click (CPC) is what you pay per click on a sponsored social media post, like a banner ad. CPC is helpful when determining if your investment is worth continuing.

Screenshot of CPC formulaImage Source

Here is the CPC Formula from The Online Advertising Guide. To view this as an example, say you want to calculate the CPC of your latest round of ads. Divide the total money spent on your ads by the total number of times the ad was clicked on.

11. Net promoter score (NPS)

Net Promoter Score (NPS®) measures customers that are loyal to your brand. It’s the answer you’re looking for when asking customers how likely they are to recommend your business to a friend. Tracking NPS is easier than it seems.

There are three categories that go into tracking NPS. When you ask customers to rate your business 1-10, scorers that answer 9-10 are “Promoters.” “Passives” score 7-8, and “Detractors” are 0-6.

Identifying your NPS is as simple as subtracting “Detractors” from “Promoters” and dividing that by the number of total respondents. Then, multiply that number by 100. So, if you have 50 “Promoters” and 10 “Detractors” from a survey with 70 respondents, your NPS would be 57%.

12. Influencer Campaign Metrics

If your company leverages influencer marketing, you’ll want to measure the effectiveness of your influencer marketing efforts to inform future campaign strategies.

According to the same HubSpot Blog study, the marketers said the most important metrics for measuring the effectiveness of an influencer campaign are:

  • Revenue/Sales (40%)
  • Brand Awareness (37%)
  • Impressions/Views (33%)
  • Brand mentions/Hashtag Use (33%)
  • Clicks (32%)

As you define the objectives of your influencer marketing campaigns, keep these metrics in mind.

13. Traffic to Brand’s Website

Depending on the nature of your business and the social media platforms your company focuses on, increasing traffic to your website could be a top priority. 41% of marketers surveyed by the HubSpot Blog said traffic to their website is a high-priority metric. If your company relies on web traffic as part of its business strategy, you’ll want to consider measuring how many of your page views are coming directly from social media.

Key platforms for this focus include Facebook, Twitter, and Pinterest. You can use a web traffic tool such as Google Analytics to measure how much of your traffic is coming from organic social media.

14. Audience Insights

Earlier we discussed the importance of understanding your audience growth rate. But how much do you know about the audience you already have? Understanding your followers can help you hone in on finding the right target audience, empowering you to share content that resonates with them resulting in higher engagement and increased ROI.

Key audience demographics to consider include:

  • Age
  • Location
  • Gender
  • Education Level
  • Job Title
  • Marital Status
  • Number of People in Household

These demographics can be found on social media platforms such as Instagram, Facebook, and TikTok.

Tracking metrics can sometimes be easy. Sometimes, businesses realize that it’s worth the investment to invest in social media tracking tools to help them run more smoothly.

To learn more about which social media metrics are most important for your own business, check out our video on how to set social media goals:

Next, we’re going to get into some tools that can help you track these metrics.

1. Keyhole

Price: $179/month
Why it’s great: Social listening metrics

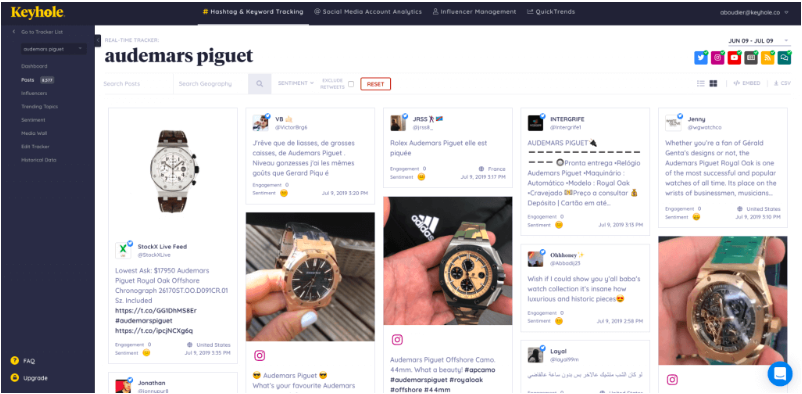
Keyhole allows you to see impressions, engagements, reach, and posts that either your accounts or hashtags are getting in a graph format. Keyhole also tracks the demographics of your customers and breaks down their engagement.

When you use Keyhole, all of your accounts are displayed on your dashboard, as pictured below.

keyhole dash screenshotImage Source

The software shows you what type of content catches the eye of your consumers and provides suggestions on how to improve social presence.

2. Meltwater

Price: By contact
Why it’s great: Timely reporting from dashboard

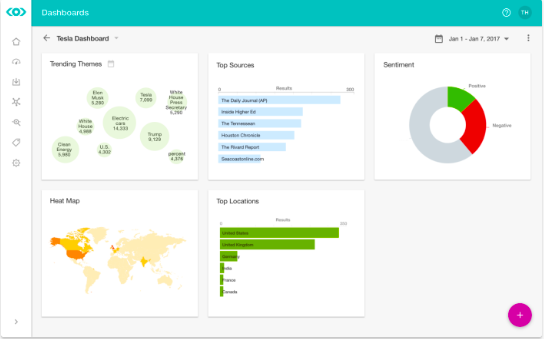
Meltwater’s program tracks your accounts in real-time, which is accessible from the dashboard of its users. You can also get metrics on your brand’s impact on the web. Meltwater lets you see your insights and user-generated content in one place, like the photo below.

meltwater social report example

Image Source

This photo shows where a brand is trending around the world, which themes are trending the most, and SEO results in a couple of different graphs. Meltwater combs the internet for mentions of your brand and even suggests influencers to connect with.

3. NetBase

Price: $300-$1,000/month
Why it’s great: Global insights + tracking

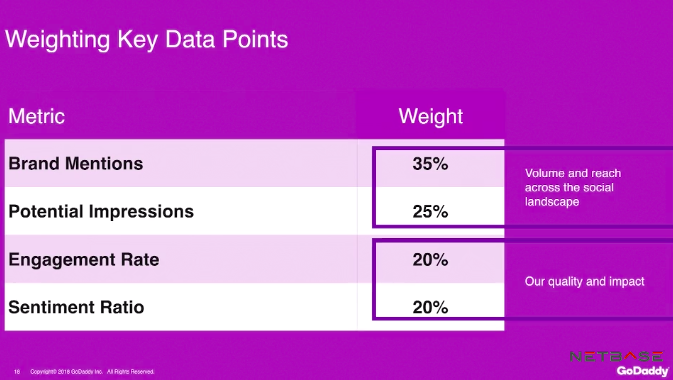
NetBase provides analytics on conversations happening with your brand from around the world. They provide real-time analytics and give you insights that’ll help you track ROI. Like in this photo below, NetBase provides you with data about how your campaigns carry weight with customers.

godaddy netbase resultsImage Source

With Netbase, you can track the performance of a campaign and specific elements about certain campaigns that make them stand out. This metric analysis from GoDaddy shows their impact and engagement with customers, as well as the audience they’ve reached.

4. quintly

Price: $300/mo
Why it’s great: See competitor performance

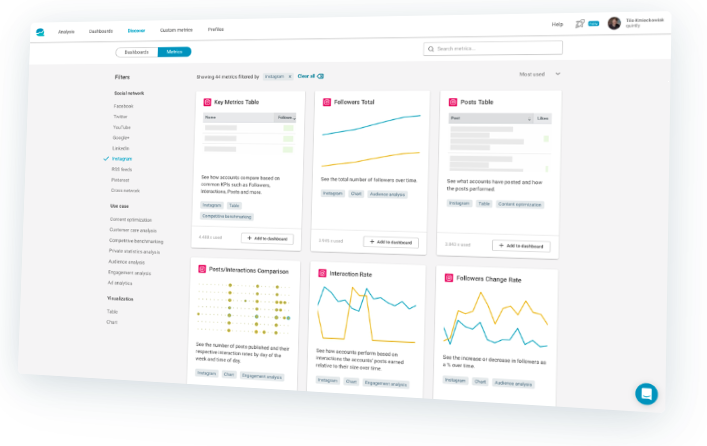
When using quintly, you can not only track your social media performance but gain insight into the performance of your competitors. This will help you see what you can do to improve your campaigns and what your competitors are doing that works. This photo is an example of the insights the software provides.

quintly example of benchmarks

Image Source

Quintly is also great for agencies with multiple clients. They can use it to manage the accounts of their clients and track their social media pages. Quintly also has reporting and benchmark data to measure campaigns.

social media content calendar

Categories B2B

3 Tests Our Content Team Ran in 2021 & How They Impacted 2022 Planning

2021 was a big year for the HubSpot content team.

Our team grew, we faced challenges, and we had some fun with experiments.

Experiments can teach you a lot about your audience and help you unlock growth opportunities. Here are some experiments we ran in 2021 and what we learned from them.

Free Resource: Content Marketing Planning Template

Conversion Rate Optimization

In January 2021, the web strategy team decided to run a form optimization experiment to understand how altering our forms would affect our users, ahead of a blog redesign.

When evaluating the current form, the team found that it was breaking several best practices relating to user experience (UX). For instance, the form used asterisks when all fields were required and users were unable to tab through the fields, taking longer to go through the form.

This issue with the UX was further validated with high dropoff rates on offer pages. This meant that a secondary goal was clear: Improve the user experience of the forms on our content offer pages, which would then improve our conversion rate.

With every experiment comes a hypothesis and this one had two, one for each goal:

  • By redesigning the forms, we will learn the best approach to form design ahead of the blog redesign.
  • By optimizing content offer forms’ design and functionality, we will improve the user experience and increase user clarity, which will lead to an increase in content leads’ CVR.

When it came to designing the experiment, the team chose an A/B/C/D/E test, leading 20% of traffic to each of the five treatments:

  • 20% would see A, the control – a modal form.
  • 20% would see B – a redesigned, standard version of the form.
  • 20% would see C – the split-screen with a two-column form.
  • 20% would see D – the multi-step form.
  • 20% would see E – the split-screen with single-column form.

Wondering how they came up with these variants? User testing. Earlier in the year, the team had already gathered valuable insights from a user test, in which they learned about users’ preferences and expectations when using forms.

They used this data to design their experiment, something that Principal Marketing Manager at HubSpot Rebecca Hinton says highly contributed to their success.

The test ran on the top 20 converting offer pages and had to run for two weeks to get a reliable sample size for each variant and launched only 33% of traffic to mitigate risk to content lead goals. It ramped up to 60% of traffic during the experiment.

The primary metric used in this experiment was the conversion rate on the content offer form submission and the second was engagement.

“What we found is that displaying a multi-step form vastly outperformed the other treatments we tested, showing a 20% improvement over the control,” said Hinton.

It’s worth noting that the winning variant, D, had a much higher conversion on mobile than it did on desktop. However, the multi-step form performed well on both device types.

“The multi-step form was so successful that we’ve decided to implement it ahead of the pages being redesigned, so we can capitalize on its strong performance,” said Hinton.

A key takeaway here is that one test can (and should) inform another. If you collect user data for a particular feature or project, make sure you keep good documentation as that can serve a purpose later on.

Channel Promotions

Back in June 2021, HubSpot community manager Jenni Kim, then marketing manager on the Channel Promotions team, ran an experiment to explore opportunities for cross-promotion between the YouTube team and the blog team.

Kim described both channels as having an on-and-off relationship, crossing paths from time to time covering the same content and even collaborating at times. However, there was no consistency. This experiment would assess the value of embedding YouTube videos from HubSpot’s channel into relevant blog posts.

The hypothesis was that adding videos to blog posts would enhance the blog reader’s experience and drive meaningful growth for both channels.

Setting up this experiment required cross-collaboration between YouTube, Blog, and SEO teams to design a process while keeping in mind content lead goals, user reading experience, and SEO implications.

Now, let’s dive into the specifics.

One consideration they had to make was which YouTube videos would go and where. Here’s the breakdown they settled on:

  • Existing Blog Post + Existing YouTube Video (9 blog posts, 9 videos)
  • Existing Blog Post + New YouTube Video (6 blog posts, 3 videos)
  • New Blog Post + Existing YouTube Video (4 blog posts, 4 videos)
  • New Blog Post + New YouTube Video (5 blog posts, 3 videos)

They found that using existing blog posts and videos would offer the most clear results, as you could compare pre- and post-experiment metrics.

Key metrics:

  • Total organic clicks (TOC) – The blog traffic coming in from the web results tab on Google
  • Total organic clicks from the video tab – The blog traffic coming in specifically from the video tab on the SERP.
  • Content leads/CVR – The number of viewers who converted through a blog post by signing up for an offer and the view-to-lead conversion rate on the blog on a post-level.
  • Organic video views – Videos that came directly from the blog post embed.

The experiment ran for roughly three months, as that would be enough time to measure the SEO impact.

The results found that embedding YouTube videos into relevant blog posts had a positive impact on both YouTube views, contributing 15% of total views. Leads and CVR stayed consistent, which is considered a win, as the experiment didn’t negatively impact conversion.

As for TOC from the video tab, an average of 8% of clicks came from this section – making it a solid SEO opportunity for both channels.

The most challenging part for Kim was the adaptability they needed to exercise to start this experiment.

“A lot of the teams were all working pretty independently,” said Kim, “So, we had to understand everyone’s processes and then try to find that middle point to bring everyone together.”

As a result of this experiment, both teams developed a sustainable collaborative process to help both teams generate more traffic.

Audience Growth

When it comes to blogging, one of the most important metrics is organic traffic. This refers to the non-paid traffic that comes from search engines.

On the HubSpot Blog, the team also leverages non-organic content coming from sources like email, social media, and other websites.

Pamela Bump, senior marketing manager responsible for audience growth on the blog team, shares that the HubSpot Blogs already had incredible success from our non-organic content, creating clickable, shareable blog posts with original research, quotes from experts, and insights on industry trends.

“Not only did our non-organic program help to increase our non-search traffic, but we also were able to write posts that eventually began to rank on search because we were ahead of trends,” said Bump.

To capitalize on this success, Bump led an experiment to create hybrid posts, combining the shareability of non-organic content with the SEO of organic content.

“The goal of this experiment was to see if our blog posts could pull in the sudden bursts in traffic from non-search channels that non-organic blog posts achieve soon after publishing,” Bump said, “while also gaining more evergreen traffic over time search as these posts begin to rank on search result pages.”

She called this the “Hybrid Effect.”

“These assignments were laid out by both myself and our SEO strategist and combined SEO elements, like keyword optimizations and search-driven formatting,” said Bump, “while still including non-organic elements like quotes from experts, original data, news mentions, and trend coverage.”

The result? In the first year of testing hybrid content, Bump says it has led to huge benefits for the blog, pulling in strong numbers comparable to organic traffic.

“The average views we get from hybrids in their first month is about 10% lower than that of non-organic piece,” said Bump. “However, it can be more than 30% higher than the first month’s traffic of a completely organic piece of content.”

In the long term, Bump says that the average hybrids and non-organic piece published in 2021 only had about a 1,000 to 2,000 view difference while gaining more keywords on average than a non-organic piece and gaining faster traffic than an organic piece in its first year.

Because of this success, the team has made the hybrid model a permanent strategy on the blog team.

“In 2022, we plan to increase our investment in hybrid content by 10% while also training writers on how to optimize organic pieces with non-organic elements for hybrid growth,” said Bump.

In every experiment mentioned above, there’s something to learn – whether it’s the importance of collaboration or the value of historical data. If there’s an experiment you’ve been thinking of running, take this as your sign and use these insights to guide you.

Blog - Content Mapping Template

Categories B2B

How the Pandemic Changed Social Media: 6 Quarantine Trends Here to Stay [Data + Expert Insights]

At the beginning of the lockdown, many of us were unable to see family or friends. All social plans were cancelled — practically overnight.

And, in the midst of so much stress and chaos, many felt more alone than ever.

Which is why people turned to social media in an effort to find a sense of connection and community. 

Social media became a refuge — a place to post authentic, relatable content and form relationships virtually when in-person wasn’t an option. 

And as Lala Fevrier, Wayfair’s Senior Associate for Influencer Marketing, puts it, “When restaurants, schools, and businesses shut down, the only place left with a 24/7 open sign for communication and creativity was social media.”

All of which is to say: Quarantine, and the pandemic at-large, greatly impacted social media. And those changes have permanently shifted users’ expectations and preferences when it comes to their social platforms.

Here, we’ll explore six trends we’ve seen as a result of the pandemic — and why they’re here to stay.

Download Now: Social Media Trends in 2022 [Free Report]

How The Pandemic Changed Social Media  

1. Quarantine increased time spent on social media, as well as social users worldwide.

Between 2019 to 2021, the amount of social media users worldwide increased by 11% — from roughly 3.4 billion in 2019 to 3.78 billion in 2021.

As lockdown orders went into effect, many sought out new opportunities to connect with friends and family. In fact, we saw a 5% jump in global users from 2019 to 2020 alone.

People were also bored, which significantly increased the time spent on social media apps. Consider, for instance, the sudden popularity of bread baking in March, or the random challenges across social apps, like the “flip the switch” challenge that exploded on TikTok in 2020:

I know this boredom first-hand: During the beginning of the pandemic, I spent roughly 4 hours each day on Instagram. Rather than grabbing dinner with friends after work or chatting with colleagues on my lunch break, I scrolled through people’s IG Stories.

I’m not alone. In the U.S., social media users jumped from spending 56 minutes per day on social media in 2019 to 65 minutes in 2020 and 2021. And, globally, people spent 145 minutes per day on social media in 2020. (It’s important to note: That number has decreased to 142 minutes per day in 2021, suggesting a slight decline in social media use as some of the world re-opens.)

Social media became a place to escape the turmoil of the real world. Along with a spike in social media users, engagement increased on certain platforms, as well. On Instagram, for instance, the average engagement rate for brands increased by roughly 6% in 2020.

For Sarah White (@thecoastalyogi), a Boston-based fitness instructor and influencer, the pandemic was a catalyst for her to launch virtual offerings and leverage social media as an opportunity to create a strong sense of community.

White told me, “Virtual offerings were a side of my business I had considered, but had never seen a need for until March of 2020. Since then, my virtual subscriptions have become a major part of my business and are the primary way I interact with my clients.”

White adds, “My Instagram is my primary source of marketing so my posting has definitely increased. I am intentional about answering every message I receive from clients as I know it’s this type of relationship-building that differentiates a following from a community.”

2. Quarantine impacted video consumption.

2020 was an impressive year for video. In fact, media uploads increased by a staggering 80% year-over-year — peaking at 103,603 video uploads on April 22.

The minutes people spent watching videos in 2020 also increased by 85%.

The pandemic greatly impacted how quickly video rose in popularity. It’s now the most popular type of content, and has been for two years in a row.

Additionally, in a HubSpot Blog survey, 42% of respondents said “I watch more videos on social media” in response to the question, “How do you use social media differently now as a result of the pandemic?”

In particular, TikTok, the popular short-form video platform, saw exponential growth as a result of the pandemic. This can be attributed, in large part, to the authenticity of the content produced on TikTok.

As HubSpot’s Senior Social Media Strategy Manager Leslie Green puts it, “A huge platform shift that happened during the pandemic was that tastemakers and culture shifters were born on TikTok — not Instagram. TikTok lifted the hyper-filtered veil off of social with short-form, intimate, and authentic video content.”

Green adds, “TikTok, largely due to it’s For You Page, became a place where anyone could be found. And in the last year many small creators blew up because they were able to create content that spoke poignantly to people’s lived experiences and feelings.”

If your business hasn’t considered it already, 2022 is a good time to test out new types of short-form video content to see how it resonates with your audience. 

Another increasingly popular option for video is live streaming. 

Mari Smith, Premier Facebook Marketing Expert (often referred to as the ‘Queen of Facebook’) and Top Social Media Thought Leader, suggests brands lean more heavily into live streaming in 2022. 

Smith says, “Embracing live streaming — whether Facebook, Instagram or LinkedIn Live — can go a long way towards creating more intimate relationships with your followers. Think of your live videos as ‘mini webinars’ and always strive to add nuggets of valuable, educational (and/or entertaining!) content, before adding your call-to-action.”

In 2022, consider testing different platforms and content types — such as TikToks, Instagram Stories, YouTube videos, or Facebook live streams — to find out which video format performs best with your audience.

3. The pandemic impacted the best times to post on social.

Nowadays, many people work from home and have chosen remote work as their preferred lifestyle moving forward.

Suffice to say, the pandemic permanently shifted people’s work schedules.

And, as the typical 9-to-5 work hours changed as a result of the pandemic, social media peak hours adjusted, too.

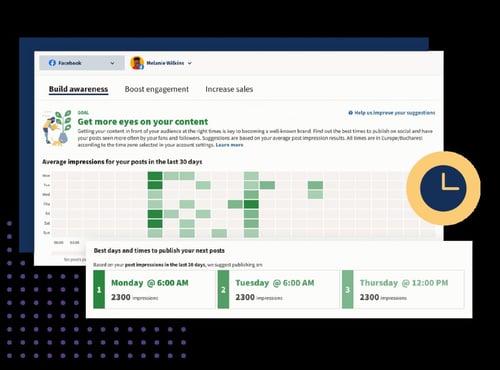
For instance, Sprout Social found the new best times to post on Facbook are Monday, Wednesday, and Friday from 10–11 a.m.; Monday, Tuesday and Friday at 11 a.m. and Tuesday at 2 p.m. are the best times to post on Instagram.

And currently, the best times to post on LinkedIn are Wednesday at 3 p.m, Thursday at 9–10 a.m., and Friday from 11 a.m.-noon.

It’s important to consider how the pandemic changed the way people work, and when. For instance, now that I’m working from home, I take a regular social media break every day around 10 a.m. while I eat my breakfast, since I don’t have colleagues around to chat with.  

In 2022, you’ll want to conduct your own tests to determine which times are most popular with your audience — and on which channels.

4. The pandemic impacted the most popular types of content.

During the stress and uncertainty of quarantine and the beginning of the pandemic, many turned to social media to escape the real world. Which is why fun, lighthearted types of content won out.

In fact, in 2020, roughly half (42%) of Gen Zers said they wanted content described as fun — which surpassed Gen Zers’ interest in romantic content (29%) and exciting content (27%).

As boredom as a result of quarantining ensued, social media consumers wanted bright, playful, light-hearted content to cheer them up.

Even now, two years later, 34% of HubSpot Blog Survey respondents said they still seek out more positive and uplifting content than they did pre-pandemic.

Along with more colorful, lighthearted content, we also saw an increase in authentic, user-generated content in 2020. Between March and April, during peak lockdown period, a Lightricks study found Americans spent over 90% more time using apps to create and edit images, videos, and visual content.

how the pandemic changed social media according to leslie green

Green says, “The pandemic leveled the playing field for social media because everyone was stuck at home making the most of what they had in front of them: free time, hobbies, interests, and their personality. Content became more approachable and more human. Every day users created posts that spoke to real lived experiences rather than a curated image.”

Neal Schaffer, Digital & Social Media Marketing Consultant, Speaker, and Author, agrees that the pandemic shifted the types of content that perform best.

He says, “One major impact that COVID had on social media was in keeping content real. When we couldn’t go out for photo shoots, it required celebrities to turn their homes into studios and influencers to post more of their raw selves.”

Schaffer says, “As human beings, we sought out people who were having similar experiences to us … This made social media content more raw, believable, and authentic — and, as a result, further democratized content creation by lowering the threshold of what was required to create content.”

Schaffer adds, “Combine this with the popularity of short-form video, and a whole new generation of content creators was born.”

I’d argue we’re all better off in a world in which social media users post authentic, non-filtered images to depict the realities of life. These #real posts help audiences feel less alone, and can foster a much stronger sense of community.

Which is why it’s vital your team focuses on creating more authentic, behind-the-scenes content in 2022. In fact, many of you already plan to — HubSpot’s Blog Research found 79% of B2B and 54% of B2C plan on increasing investments in authentic/behind the scenes content in 2022.

5. Quarantine sped up influencer marketing’s popularity.

Influencer marketing grew exponentially as a result of the pandemic.

The influencer marketing industry went from $1.7 billion in 2016 to $9.7 billion in 2020 — a staggering 470% increase — and is expected to jump to $13.8 billion in 2021.

I spoke with Jesse Leimgruber, CEO of influencer marketing agency NeoReach, to learn his perspective on how the pandemic impacted the influencer marketing industry.

Leimgruber told me, “The pandemic boosted the creator economy into the spotlight. Millions of new creators joined the scene, and many found new ways to earn and support their craft. This extra attention on social media allowed influencers to earn money and turn a hobby into a profession.”

how the pandemic changed social media according to jesse

He adds, “Sponsored posts, partnerships, merch sales and fan donations have proliferated in the last two years. Venture dollars into the creator economy are at an all-time high, and public interest in the space is just getting started. In 10 years, we’ll look back and see the 2020s as the decade the creator economy changed the way people work, live, and interact.”

At the beginning of quarantine, we saw brands pull away from influencer marketing as the economy became more uncertain and volatile. This makes sense: As a relatively new form of marketing, influencer marketing can seem like a riskier investment to teams struggling to stay afloat.

However, as the world adjusted to lockdowns and remote work, influencer marketing began rising again in popularity. Influencer campaigns increased by 37% between Q2 and Q3 of 2020, and rose by an additional 34% between Q3 and Q4.

And influencer marketing’s popularity isn’t slowing down. In 2021, sponsored content increased by almost 27%.

Wayfair’s Lala Fevrier agrees that the creator economy has skyrocketed — and, she adds, this creator economy is largely made up of Gen Z influencers. 

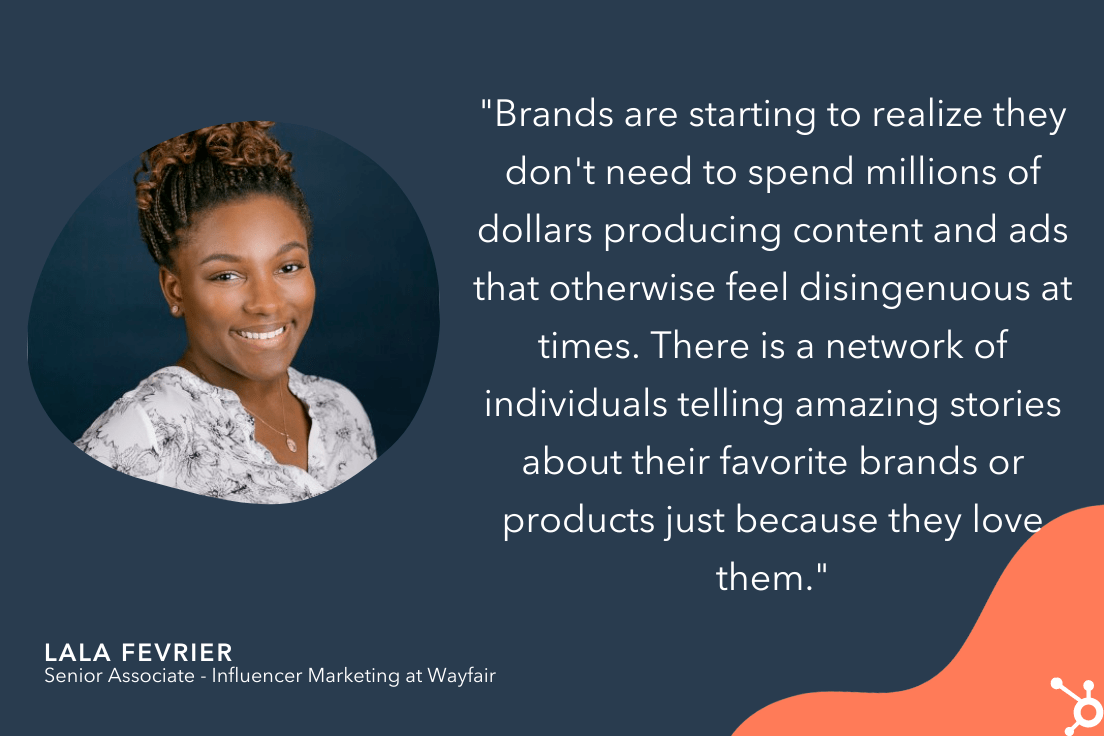
Fevrier says, “The largest group to take advantage of social media’s accessibility is Gen Z influencers. Because of their efforts, brands are starting to realize they don’t need to spend millions of dollars producing content and ads that otherwise feel disingenuous at times. There is a network of individuals telling amazing stories about their favorite brands or products just because they love them.” 

how pandemic changed social media according to lala fevrier

If you’re interested in getting started with influencer marketing, consider the power of micro-influencers to engage directly with your intended audience and see more ROI than you might with a bigger celebrity. HubSpot’s Blog Research surveyed marketers who already work with influencers, and found 67% of them work with micro-influencers (10K-100K followers/subscribers), followed by 58% who work with macro-influencers (100K-1M followers/subscribers).

6. The pandemic increased the need for community — and new platforms are rising, as a result.

Being stuck at home made it difficult — if not impossible — to feel a sense of community. 

Pre-pandemic, many people turned to the office, fitness classes, parks, or other public spaces to feel connected to a larger group. 

Overnight, those were no longer an option.

Fortunately, when used correctly, social media can fill in the gaps and help serve the fundamental human need of connection.  

As Mari Smith told me: “You absolutely cannot beat the power of building a fiercely loyal community where members bond with one another — and with you.”

Smith adds, “Certainly, [community] can be cultivated over time through a Facebook Group linked to your Facebook Page. However, community platforms are on the rise as users and leaders alike seek out different platforms on which to build and join tribes.”

Smith says, “I surveyed my Facebook audience in October last year on this topic. Both Mighty Networks and Circle are growing in popularity in terms of an alternative to Facebook Groups. I predict we’ll see a slight rise this year in community leaders choosing to migrate away from Facebook towards one of these other platforms in order to cater to their tribe members who’ve lost trust in Facebook.”

Facebook Groups is still a viable option for creating a stronger sense of community and building relationships with your prospects and customers, but in 2022, you’ll see brands experiment with other community-building platforms.

In 2021, social media became the #1 channel used in marketing. It’s vital you learn how to pivot with these trends to continue to see growth and success across platforms.

The good news? Social media users are craving authenticity now more than ever. So the more your brand can lean into its own uniqueness, the better.

New call-to-action

Categories B2B

12 Best Pricing Page Examples To Inspire Your Own Design

Your pricing page is a prime opportunity to take control of the price conversation and make it even easier for people to buy.

Searching for a product’s price is a natural part of a customer’s buying decision. The majority of people who have made it down the funnel far enough to consider buying from you will likely look at your pricing page.

What does a great pricing page look like? To inspire you, we break down the must-haves of a good pricing page and share the best examples of pricing page design. Check them out below.

Free Download: 77 Examples of Brilliant Web Design 

What makes a great pricing page?

If your pricing page isn’t well-designed and user-friendly, you risk losing people before they click the “Buy Now” button. You’ll notice the best pricing pages have clean layouts, use simple language that speaks to the customer, and aim to inspire trust between the business and the user.

Let’s take a look at the must-have features of a high-performing pricing page.

User-Friendly Layout

The best pricing pages are easy for users to navigate. This doesn’t mean you need to design your pricing page in the same way you would a landing page, which are often pared down for the purpose of getting a form submission.

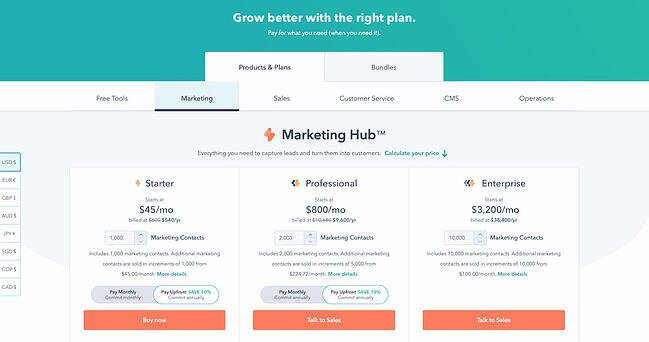
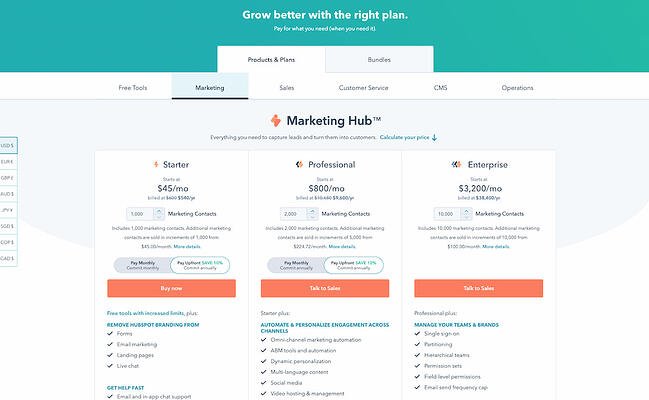
You can still include plenty of information in your pricing page, but the fonts, colors, links, and buttons must be easy to follow with the eye. Even if you have multiple products and packages — like HubSpot does — it should be clear where users have to click to see the pricing for their desired product.

best pricing pages: hubspot marketing hub

Remember to keep important information above the fold, such as a value proposition and at least one call-to-action button.

Hot tip: Interested in learning more about marketing terms such as “above the fold” and “call-to-action”? Check out our podcast below, and make sure to follow for more useful content. 

Simple Language

The pricing page can be a good place to get fancy with jargon, especially if your target customer is an advanced professional in their field. But for at least one package, consider keeping the information accessible and jargon-free — so that someone who’s not an expert in the field can tell which package would work best for their team.

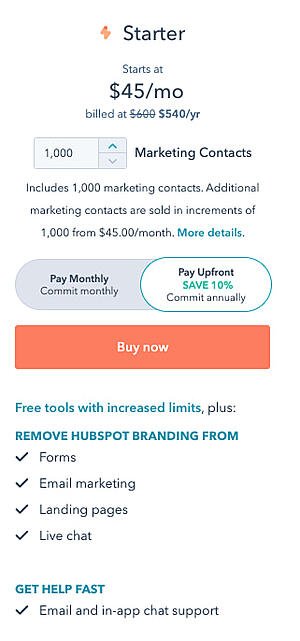
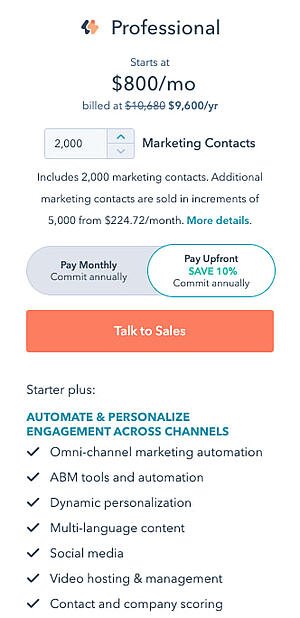
You can toy with this rule depending on the package, too. For instance, on HubSpot’s pricing page, the starter package for Marketing Hub uses extremely simple language. “Forms,” “email marketing,” and “live chat” are easy to understand. Non-marketers will immediately know what they would get out of a starter subscription.

best pricing pages: hubspot marketing hub starter

For the professional package, however, the story is different. “ABM tools and automation,” “A/B testing,” and “Omni-channel marketing automation” are highly specialized terms that only the most experienced marketers will understand.

best pricing pages: hubspot marketing hub professional

Your language will differentiate your packages and make it clear to a user which one they should choose.

Crystal Clear Pricing

The best pricing pages have clear packages that accommodate a wide variety of company sizes and budgets. Or, if you serve primarily enterprise firms, you’ll make it clear through your language that you only serve that segment. Instead of including pricing, for instance, you might instead include a “Talk to sales” button so that enterprise buyers can get a quote.

Consider including both monthly and yearly subscription terms, especially if you sell a SaaS product. If you’d like to acquire customers abroad, give users the ability to see pricing in their local currency, too. These small changes will ensure that there are no barriers to conversion. Remember to A/B test your pricing to find out what works best for your customers.

Ready to look at some of the best pricing pages online? We’ve curated the best ones below.

Pricing Page Examples

1. HubSpot

pricing page examples: hubspot

The HubSpot CRM platform is comprised of five products: Marketing Hub, Sales Hub, Service Hub, CMS Hub, and Operations Hub. The pricing page, however, keeps it simple by offering each one individually, giving users a chance to choose the one that most applies to their needs. If users are interested in a bundle, they can toggle the tab at the top to get bundle pricing.

Note the differences in call-to-action buttons, too. Everyone can get immediately started with a Starter subscription through the self-service “Buy now” button. But if you’re interested in a more advanced suite, the page prompts users to “Talk to sales” instead.

This is an excellent example to copy if you sell multiple products within one suite, and especially if you serve a wide range of customers, starting from freelancers all the way to enterprise companies. The calls-to-action should be different for each one.

2. Box

pricing page examples: box

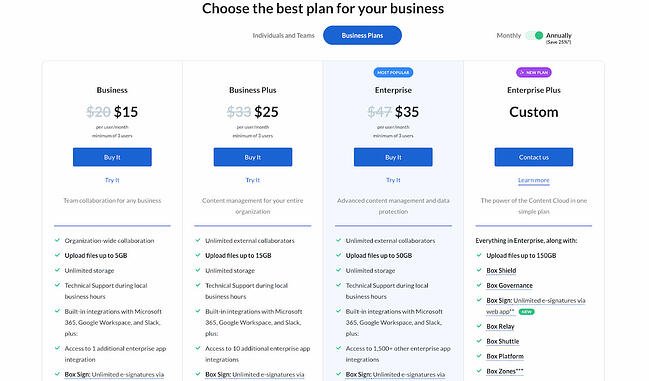
Box’s pricing page is informative, intuitive, and actionable — starting with the heading right at the top of the page, which prompts users to “choose the best plan” for their business. One thing they did really well was allowing users to choose their buyer persona by offering two call-to-action buttons at the top: “Individuals and Teams” and “Business Plans.” This makes the user experience far simpler. After all, if you’re thinking about buying Box for your business, there’s really no reason you’d need to see the personal pricing plans (and vice versa).

Another thing they do well is highlight the most cost-effective option on the page — not only by labeling it “Most Popular,” but also by designing that option to pop out. That’s a great way to generate more click-throughs on that package.

3. Zendesk

pricing page examples: zendesk

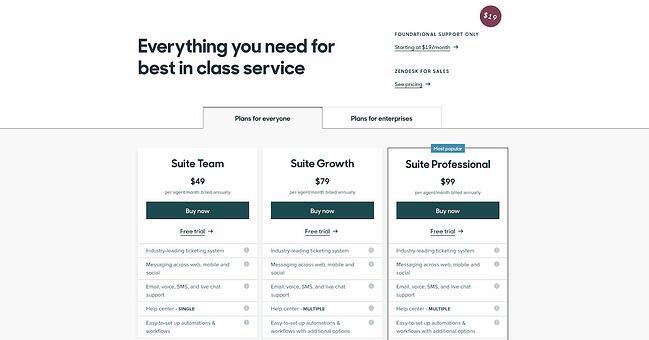
The first thing you see when you arrive at Zendesk’s pricing page is the header text: “Everything you need for best in class service.” Pricing pages can sometimes make users a little uncomfortable, and it’s reassuring copy like this that builds trust between a business and its prospects.

We love that the pricing page is divided among several sections: “Plans for everyone,” “Plans for enterprises,” and “Frequently asked questions, answered.” Providing a lot of information like this on your pricing page is really helpful for your users, but it can be hard to do it in a way that doesn’t confuse people or create clutter on the webpage. Dividing the information into clearly marked tabs and sections is a great way to make the information manageable for your users.

Finally, if you scroll down a little on Zendesk’s pricing page, you can find a prompt to see the plans compared. We love how they show the full list of features and what you get with each plan — all without the user navigating away from the page. This sort of transparency help your salespeople sell the right product to the right customers, which ultimately helps satisfy customers long-term and reduce churn.

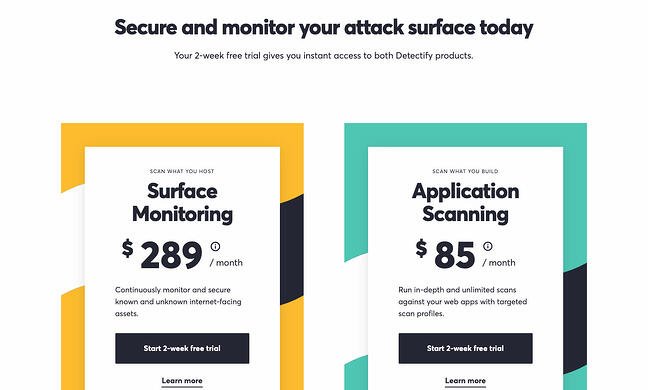
4. Detectify

pricing page examples: detectify

Detectify’s pricing page design is a little out of the ordinary, but it makes for a really cool user experience. Users can choose between two simple options, depending on their use case. Users can either buy a security subscription for websites they’re hosting, or for applications they’re building. This works really well for a single product with a price that only changes depending on what you’re using it for.

Plus, we’re suckers for simple calls-to-action. Both of the buttons prompt the user to start a free trial, making it simple for visitors to understand what they need to do.

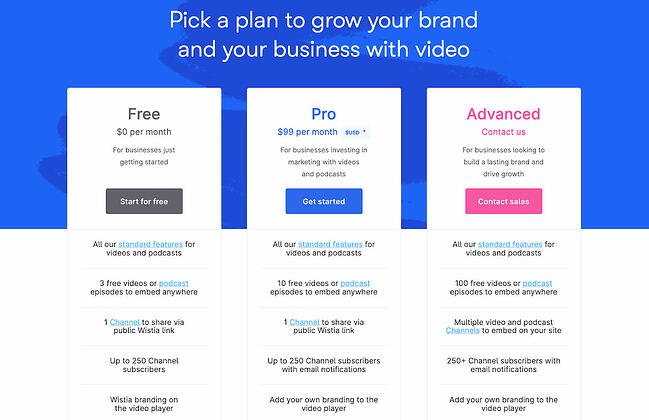
5. Wistia

pricing page examples: wistia

Like any page on your website, design is just as important as the information you provide. Wistia has one of the most visually pleasing pricing pages we’ve seen thanks to a nice, clean, and colorful layout, and whimsical lines that align with their playful brand.

They also use language that makes it easy for visitors to find a pricing plan that suits their needs. Under each option, they provide a short description of the ideal customer for that option. For example, the Pro version is “For businesses investing in marketing with videos and podcasts.”

Finally, we love that the amount of videos you can create is included in the feature comparison. Why? Because it clearly states the value of each subscription; there’s no guessing. Wistia successfully speaks their customers’ language.

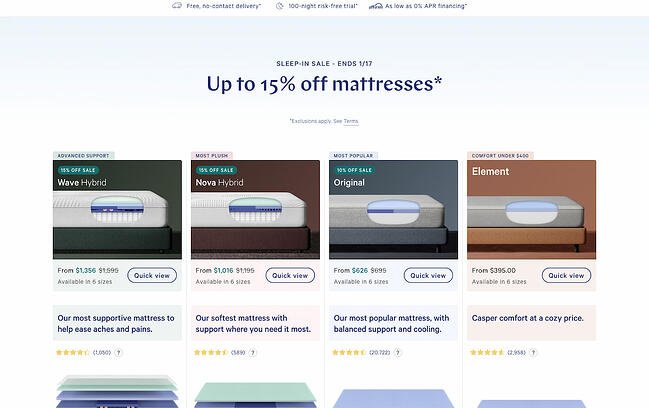
6. Casper

pricing page examples: casper

Thanks to minimal copy and great use of negative space (i.e. the blank space surrounding objects in design), this page is both well-designed and easy to follow. But what we really love on this page is their well-worded refund policy: “After you buy your mattress online, we’ll ship it for free. If you’re not in love, we have a 100-night trial. We’ll pick it up and give you a full refund after the 30-Night Adjustment Period. “

The fact that the company will go to a dissatisfied customer’s house and pick up the mattress for no charge, along with giving a full refund, is a great testimonial to their dedication to customer service. This serves as a way to build trust with prospects before they even buy, and is sure to help create advocates down the road.

If you have a refund policy, be sure to include it on the pricing page to reassure users who may be on the fence about buying.

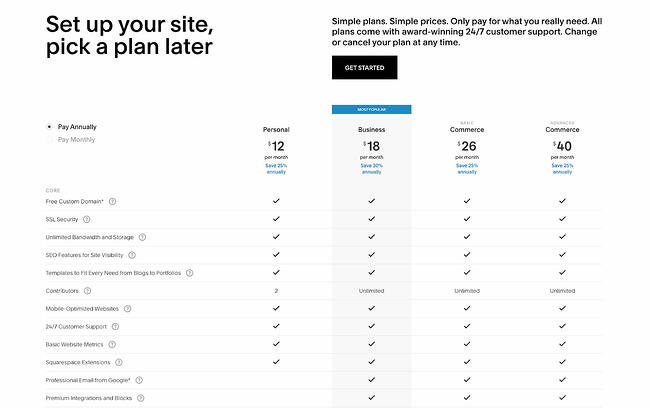
7. Squarespace

pricing page examples: squarespace

Like Zendesk, Squarespace employs strong header copy: “Set up your site, pick a plan later.” Right away, they’re reassuring users that they don’t have to pay just to try it out; visitors can immediately try the platform by clicking the “Get Started” button.

We also love that they include frequently asked questions right on the same page as the pricing matrix. That way, users can get many of their questions answered without having to dig for answers.

8. Ticketleap

pricing page examples: ticketleap

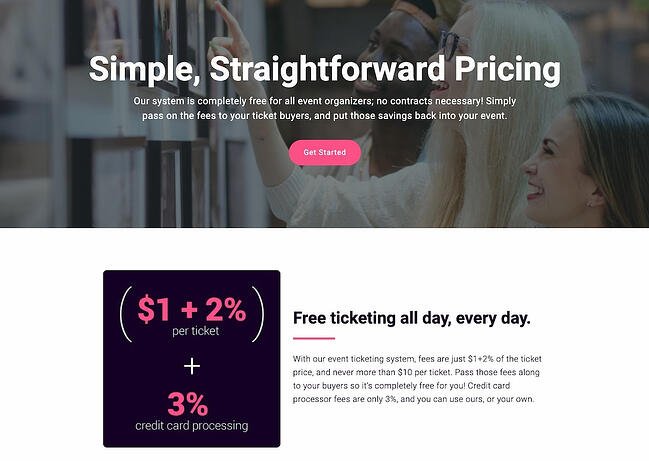
Here’s another take on header copy from Ticketleap that captures users’ attention right away. When you arrive at their pricing page, the first thing you see are the words “Simple, Straightforward Pricing.” This phrasing aims to make users feel like Tickleap is on their side — they won’t get secretly up-charged once they sign up on the platform.

Later down the page, users can calculate how much they would pay for Ticketleap and get the simple pricing they were promised at the top of the page.

9. Slack

pricing page examples: slack

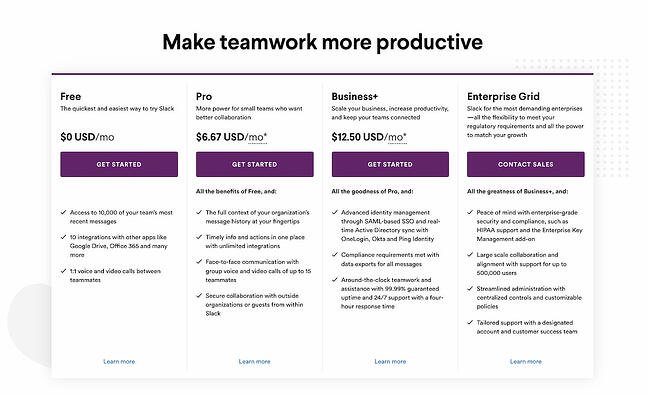
Slack’s pricing page is another example of great page design. The pricing options are within a simple, easy-to-scan table that is pleasing to the eye, and their feature comparison is easy to skim. Notice that their Enterprise Grid subscription prompts users to “Contact Sales.” This is a great way to prompt high-caliber customers to get an account manager and work out a custom solution.

Finally, although the header copy is simple, it effortlessly conveys Slack’s value proposition. The app will help your company “make teamwork more productive” — and more productive teams result in an increased ROI.

10. BombBomb

pricing page examples: bombbomb

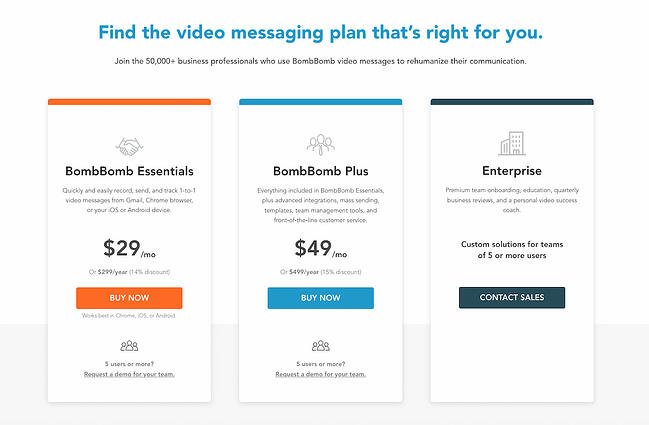
The folks at BombBomb took a different approach than most. The very first thing you see when you land on their pricing page is a large header saying “Find the video messaging plan that’s right for you,” along with a simple three-column chart on the packages that are available. Only when you scroll down do you see the individual features for each subscription.

This is a great example of a business designing its pricing page based on specific goals. If your goal is to keep it simple while increasing sign-ups, this is one way to help your cause. Take note of the reassuring subheader copy, too: “Join the 50,000+ business professionals who use BombBomb video messages to rehumanize their communication.” From that, you know that others have benefited from using this product, too.

11. Pagevamp

pricing page examples: pagevamp

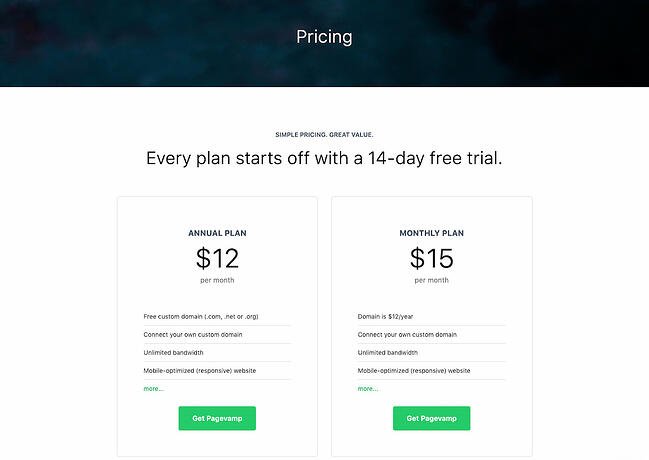
Trust elements are great additions to any pricing page. Pagevamp took the cue and placed their trial policy right at the beginning of the page, which says that “Every plan starts off with a 14-day free trial.” Copy like this might prime a user to look at the price packages and think to themselves, Hey, if I don’t like the product, I don’t have to commit.

While no one wants their customers to churn, you increase the value of your product by providing a free trial. If you force customers to sign a yearly contract without a trial, you’re essentially saying, “I know you’ll want out, so I’m locking you in for a year.” That’s a poor policy that might generate short-term revenue but create unhappy customers and poor word-of-mouth down the line.

12. Acquia

pricing page examples: acquia

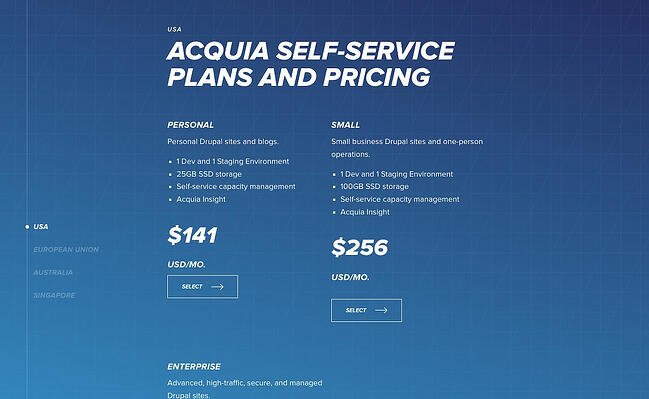
The simpler your business’ pricing page, the better user experience you’ll offer — but this gets harder the more complex your product and pricing model. Acquia is one such company, but they do a great job in this example. When you land on the page, you don’t see the product’s pricing. Instead, you get information on choosing the right self-service option for you.

You also have the option to contact Acquia directly and get an agent to help you pick the right product. This is important if you offer a complex product that might stump professionals who don’t specialize in your field.

As you scroll down, you can then see pricing depending on the region where you’re located. For each one, you get two options: a “Personal” self-service option or “Small” self-service option. Enterprise businesses also have the ability to get in contact with the sales team. This makes it easy to select a package depending on your background and buyer persona; again, there’s no need to guess.

The Right Pricing Page Design Will Boost Conversions

Take your time building your pricing page — it’s one of the most important factors in a customer’s buying decision. Test it repeatedly, change elements and colors, and keep the design user-friendly and clean. In no time, your company will see more leads come in through the pricing page, increasing conversions and boosting your revenue.

Editor’s note: This post was originally published in December 2015 and has been updated for comprehensiveness.

examples of brilliant homepage, blog, and landing page design

Categories B2B

20 Social Media Marketing Myths to Leave Behind in 2022

Like any major marketing strategy of the past decade, social media has had plenty of time to accumulate some big myths.

And despite the fact that data has disproven a number of marketing myths today, some marketers will still hold onto a few, simply because it’s hard to keep up-to-date on what’s really going on with social media.

Download Now: Social Media Trends in 2022 [Free Report]

To help you separate fact from fiction, I put my MythBusters hat on and drudged up some of the most common social media myths out there. Let’s dive into some social media myths we’ve all probably heard from colleagues or friends and why you need to leave these old ways of thinking behind.

20 Social Media Myths to Leave Behind in 2022

1. My customers aren’t on social media.

In 2021, over 3.7 billion people worldwide are active on social media. Today, it seems like there’s a social platform for everything and everyone. While family and friends connect on sites like Facebook, Instagram, or Twitter, professionals are networking on LinkedIn.

Odds are, at least one social media platform has an audience that will align with your brand. Not sure which one is the best for you? Check out this blog post to explore which social platform(s) are best-suited for your brand — and which probably won’t work for your needs.

2. You should join every single social media network immediately.

Just because I can name a lot of social networks, it doesn’t mean I should set up a profile on all of them.

By all means, research other social networks. Set up a company profile or page and give ’em the old college try. But you may find that some aren’t really worth your time. If that’s the case, consider removing your profile and move on. You should only devote time and resources to the platforms that align most with your audience and marketing tactics.

The best marketers use data to identify which marketing activities yield the best results — if a social network isn’t helping you out, cut it loose.

3. Pinterest is only for B2C organizations.

Pinterest is totally awesome for B2C marketers, to be sure. But usually, when someone says a channel is only for B2C, the B2B marketer in me takes that as a challenge to prove it’s not so.

Turns out some of my colleagues feel the same way because one of them wrote an entire guide to using Pinterest for business. You can also check out the accounts of brands like GE, Microsoft, Econsultancy, and yours truly for some B2B Pinterest inspiration!

4. You should only try to get fans and followers that will become customers.

Quality is important, yes, but don’t underestimate the power of a large social reach. Remember some of these points next time you bemoan acquiring a fan or follower that lives outside of your sales territory or target demographic:

  • More fans and followers means you’re gaining access to their fans and followers.
  • If they’re an influencer, their clout transfers to you by association.
  • When they share your content, your SEO improves.
  • They may still refer business your way.

Of course, that doesn’t mean you shouldn’t also target a specific, high-converting audience on your social channels — to figure out your ideal target audience on social media, check out this post.

5. You should only schedule posts during the workweek.

While you shouldn’t force your social media manager to work on the weekends, you certainly can schedule posts or launch social media ads on the weekends ahead of time — and, depending on your audience, it might be a good idea.

Of course, you’ll need to identify when your audience uses certain social platforms the most. While pique social media engagement times occur around the middle of the week, most platforms also have high engagement times during the weekends and evenings as well.

6. You’ll have amazing social media engagement if you ask your friends and family “Like” every post.

You can’t just have your mom and uncle Like every post you put up on Facebook. Although it might feel like you see a lot of posts that your friends or family members like, Facebook and other social media algorithms are a bit more sophisticated than that when it comes to determining which posts get seen.

To get social media feeds to favor your content, you’ll need a variety of people interacting with your content — both to grow your reach, and to show up in users’ news feeds.

So, rather than encouraging just your friends or family members to Like or heart your posts, encourage your followers to Like, comment, or share to encourage further discussion and spread your brand awareness.

7. You have to respond to social activity immediately.

There’s no doubt a speedy response is appreciated, but it isn’t always required. People understand that you’re running a business. There are other things going on. If you get back in a timely manner, but not in mere seconds, it’s alright.

There are exceptions, of course. For instance, Verizon runs a few Twitter accounts. One is @VerizonSupport. While Verizon will share blog posts and educational marketing materials on this Twitter, it also uses it to respond to questions or concerns from prospects or customers.

Because Verizon’s support account is for customer service rather than marketing, reps who manage this channel should be responding immediately to inquiries.

Another example could be if you’re running a social media account that receives a complaint that is public to all users and could hurt your credibility. In that scenario, you should consult your service team as soon as possible and write a thoughtful reply that shows you’re taking the feedback seriously.

8. Social media is only about engaging conversation — and not a place to share branded content.

It’s not that conversations aren’t important. You can’t just ignore your fans. But, while it’s beneficial to stimulate conversations and discussions with your audience, it’s not the only point to social media marketing.

Aside from allowing you to virtually connect with people, social media is a lead generator, a non-organic traffic tool, and a great place to share your best content.

If you publish valuable posts, they might not always stimulate conversation, but they could lead people to your website and products.

9. Social media marketing tactics don’t drive bottom-line results.

Piggybacking off of the last myth, you can actually generate value beyond just “engagement” and “brand equity” from social media. Social media drives leads and customers, period.

Don’t believe me? Here are a few stats you should know:

Ultimately, particularly through advertising or influencer marketing strategies, social media can be a viable opportunity for increasing sales. (Just check my bank account every time I scroll Instagram and “Swipe Up to Buy”.)

10. It looks tacky to seem relatable as a brand on social media.

The content you publish on social media should always keep your target audience in mind — but that doesn’t mean you can’t also publish content that shows your brand’s personality. Or, frankly, even your community manager’s personality.

There are people behind your company; don’t be afraid to show that with your own special brand of humor, pictures of people that work at your company, and links to news content that you find particularly entertaining … even if it’s not directly related to your industry.

11. Hashtags are essential for every post.

You know those tweets that look like this?

Love this article on #socialmedia #marketing that talks about #pinterest and has an image of a #puppy #lol

The point of hashtags is that they join together common conversation threads. So while it’s nice to have a hashtag for an event, like a webinar or a trade show, don’t lose your mind if it doesn’t become a trending topic. It’s not necessarily going to blow your leads goal out of the water if it does … think of hashtags as a way to be more user-friendly for those following the hashtag, not a way to make all your marketing dreams come true.

12. Social media monitoring takes forever.

One social media monitoring scenario: Glue your eyes to your computer screen, open five tabs for each of your social networks, chug three espressos, click between tabs, and hit refresh like a maniac.

Alternate social media monitoring scenario: Use social media monitoring software that alerts you when important terms are mentioned; check back to your accounts briefly every hour or two to see if you need to respond to anyone, follow someone back, etc.

That second one takes you, in aggregate, maybe 30 minutes a day. No big deal. Everybody breathe. Everything’s gonna be alright.

13. Social media managers should be new graduates or have years of experience.

This isn’t just a myth. It’s actually an ageist theory that should be completely abandoned — if it hasn’t been already.

Being good at social media marketing, or any job for that matter, has absolutely nothing to do with how young or old you are. You can learn the tools and strategies at any age, and make mistakes at any age, too.

Instead of considering a social media manager’s age range, look for the candidate who’s both creative and analytically-minded enough to manage your presence. To learn more about how to hire the best social media manager for your brand, check out this post.

14. Only young people use social media.

Think that the only people on social media are Gen Z and millennials? Think again.

Consider this: 40% of internet users age 46 to 55 are on LinkedIn by the end of 2020; roughly 55% of Facebook users are over the age of 35 as of 2021; and in 2020, over 70% of 45-64-year-old U.S. internet users watched videos on YouTube.

More than likely, your audience (at any age!) is on social media — the key is figuring out which one they prefer the most.

15. Newer platforms, like Snapchat and TikTok, aren’t worth taking seriously.

Snapchat and TikTok are both mobile social media apps that have pulled in millennials and Gen Z due to their unique platforms. While Snapchat thrives on ephemeral content, AR filters, and Bitmoji features, TikTok highlights goofy, fun, or musical 10 to 60-second videos similar to Vines.

Despite the fact that these platforms pull in odd content created by users, it doesn’t necessarily mean that brands can’t use the apps to gain credibility and awareness.

At this point, a plethora of brands — from publishers to B2C companies — have created profiles or ads for TikTok. One of the most surprising and oldest brands to build a TikTok strategy is The Washington Post. Although the publication has a very formal social media presence on other platforms, they use TikTok to highlight the funny, yet human, side of working in a newsroom.

Similarly, a number of larger businesses have also launched paid promotions or long-form Stories on Snapchat Discover. To learn more about these companies and the content they’ve launched, check out this blog post.

At this point, you can certainly take any popular social media platform seriously. But, as we noted when debunking previous myths in this post, you should identify which platforms best match your audience and your goals before spending time and money to build a strategy for them.

16. You don’t have enough content to have a social media channel.

The thing with social media is that it moves really fast. What’s posted today might very well be forgotten about tomorrow. It’s easy to think of this as a problem by saying, “I don’t have enough content to post.” But, alternatively, you could just repurpose content or re-share great content regularly.

According to HubSpot blog research, 91% of marketers surveyed say their company re-purposes content across various social media channels.

If the topic your post discusses is evergreen, it will almost always be useful, even if you repurpose or repost it later. This doesn’t mean you should share the exact same link and update commentary day after day, but if a few weeks go by and you want to re-promote something, go for it. Just do your loyal fans a favor and find a new interesting nugget of information to call out in your update.

17. Social media gives people a venue to publicly bash your company.

The truth is, angry customers already have plenty of venues: word of mouth, Google reviews, Yelp reviews, and many other places on the internet that will allow them to give feedback when they aren’t happy. Not creating a Facebook page simply for fear of negative feedback isn’t protecting you from an angry wrath.

Instead, get ahead of the conversation by being aware when negative reviews are taking place, reading them, responding to the customer, and coming up with solutions for their problems. Additionally, when customers are pleased, encourage them to share their positive stories.

18. Social media is too “fluffy” to have solid metrics around.

Again, social media isn’t about fluffy things we talked about earlier, like “brand equity” and “engaging conversation.”

Yes, those things happen, but it doesn’t mean you can’t measure the effectiveness of your social media activities.

With HubSpot marketing tools, you can identify exactly how much traffic social media drives to your website, how many leads social media generates, and how many of those leads become customers.

From there, you can even calculate things like the average cost-per-lead and customer — across individual social media networks, and in aggregate — just like you do with every other marketing channel (right?).

19. Social media is completely free marketing.

It’s free to join, but it’s still a resource investment. Even if you are posting for free, you’ll likely need to pay an employee to manage your channels and build strategies. And, as your social media strategy grows more successful, you might decide to up time and money investments.

Luckily, social media is still one of the most affordable ways to boost audiences, brand awareness, and ultimately leads. This makes the investment worth your while.

20. It’s best to stick with the same social media strategies that have worked in the past.

According to a survey of over 1,000 marketers for the HubSpot blog, 80% of respondents said their company’s social media strategy would be changing from 2021 to 2022 – and for good reason.

Social media platforms are constantly changing, and recycling the same goals over and over could be doing your company a disservice.

For example, in 2020, Instagram launched its Reels feature to give users a short-form video option reminiscent of TikTok. By mid-2021, the platform announced Reels would be prioritized in its infamous algorithm and would be pushed to wider audiences over static image posts.

Companies that were still relying on an early 2020 strategy that didn’t include Reels or short-form video may miss out on a good opportunity to get their content seen by a wider audience.

The social media strategies that worked in the past may not be effective today, and social media teams that can remain agile and ready to pivot may be in a better position to succeed in the ever-changing social media landscape.

Navigating Social Media Marketing

Now that you’ve learned about the falsehoods and myths behind social media, it’s time to start looking at the actual research-back tactics that could make your brand successful on a given network.

For more data that backs why you need a social media marketing strategy in 2022, check out this list of stats. For tactical advice on various social media tactics and platforms, read our Ultimate Guide to Social Media Marketing.

Editor’s Note: This post was originally published in October 2012 but was updated for comprehensiveness and freshness.

New call-to-action

Categories B2B

The Quick & Easy Guide To Freezing Rows in Excel

Without freezing rows or columns in your Excel spreadsheet, everything moves when you scroll through the page, as shown in the gif below.

freeze rows in excelThis can be frustrating if you can’t always see key data markers that explain what data is what, like column headers or row titles.

As with many things on Excel, there are tricks that help you make your spreadsheets easier to read, like the freeze function. In this post, learn how to freeze rows and columns in Excel to ensure that, when you scroll around, you’ll always be able to view the key data points that matter most.

Download 10 Excel Templates for Marketers [Free Kit]

How to Freeze a Top Row in Excel

The image below is the sample data set I’ll use to run through the explanations in this piece.

sample data set

1. To freeze the top row in an Excel spreadsheet, navigate to the header toolbar and select
View, as shown in the image below.

freeze top row in excel steps: select view

2. When the
View menu options appear, Click
Freeze Top Row, outlined in red in the image below.  

freeze top row in excel steps: select freeze top row

Once selected, everything in the top row of your Excel spreadsheet (row 1) will be frozen, and you can scroll up and down in your spreadsheet, but the top rows won’t move, as shown in the gif below.

freeze top row in excel steps: frozen top row in excel

How to Freeze a Specific Row in Excel

While excel has native functions for freezing the top row of a data set and the first column of a data set, there are additional steps to take to freeze other elements of your data set that aren’t those two things.

1. To freeze a specific row in Excel, select the row number immediately underneath the one you want frozen. For this example, I’m selecting row number three to freeze row number two.

freeze specific row in excel steps: select row below row you want to freeze

2. After selecting your row, navigate to View in the header toolbar and select Freeze Panes.

freeze specific row in excel steps: select freeze panesOnce selected, you’ll be able to scroll up and down through your spreadsheet and always see row two.
freeze specific row in excelNote that using the Freeze Panes function to freeze rows also freezes every row above the row you initially selected. For example, in the gif below, I selected row five which also freeze rows four, three, two, and one.
gif 4-Jan-06-2022-08-27-21-59-PM

How to Freeze the First Column in Excel

1. To freeze the first column of your Excel spreadsheet (column A), navigate to the Excel header toolbar, select View, and click Freeze First Column.

Once selected, you’ll be able to scroll side to side within your sheet, and the first column of your data set will always be visible, as shown in the image below.

freeze first column in excel

How to Freeze a Specific Column in Excel

1. If you want to freeze a specific column in excel, select the column letter that is immediately next to the column you want frozen and click Freeze Panes in the View header menu.

Once selected, you can scroll side to side through your entire data set and continue to see those columns. In the gif below, I’ve frozen columns A and B.

freeze specific column in excelUsing the freeze function in Excel makes your spreadsheets easier to understand, as you can ensure that critical rows and columns are always visible as you scroll through your data.
excel marketing templates

Categories B2B

The Ultimate Guide to Performance Management: 5-Step Process and Best Practices

Peter Drucker once described customers as the “most important stakeholders.” While this may be true, your customers are dependent on one thing.

No, it’s not your product (though that’s definitely important). It’s actually your employees. Without your employees, products won’t get made, customers won’t learn about those products, and there will be no one there to sell or deliver those products, or provide customer service to them after they’ve purchased.

Download Now: Free Performance Review Template

While your customers may be your most important stakeholders, in a business or organization, your employees are your biggest asset. Their performance, mindset, attitude, and loyalty can make or break your company’s performance and determine whether or not you will have any customers to sell to.

Because of this, you will want to ensure that your employees are meeting expectations, and improving in necessary areas. Performance management aims to foster the best possible employees so your organization can thrive well into the future.

What is performance management?

Performance management is a process that allows managers to assess their employees’ work and support of business objectives. The goal of performance management is to track and improve the skills employees need to perform their necessary job duties.

Elements of performance management include giving performance appraisals, utilizing key performance indicators (KPIs) and management dashboards, peer review, 360-degree feedback (multiple individuals from managers to subordinates assist), and the use of employee management software.

A similar term, performance appraisal, also focuses on goals and self-improvement, but is focused on the individual and does not take the strategic goals of the organization into account.

Performance management is not only important to the organization, it’s essential for the individual as many growth opportunities including bonuses, promotions, and ultimately dismissals, are tied to this process.

Effective Performance Management

Effective performance management will look different depending on your specific industry and your organizational goals. However, there are two approaches you can take to get started.

Behavioral Approach

This works well when your employees work (and achieve) as part of a team and measuring individual results is difficult to do. In this approach, you evaluate your employees based on their behaviors and effort. Feedback looks like identifying current behaviors, communicating desired future behaviors, and providing training or coaching to bridge the gap between where they are and where you would like them to be.

Results-oriented Approach

This approach is ideal when performance metrics are easy to quantify such as meeting a sales quota, clocking billable hours, or reaching certain call statistics. In this approach, you focus on the quality and quantity of the end result.

Performance Management Process

A performance management plan consists of a five-step process. Let’s take a closer look at the five steps.

performance management: 5-step process

1. Plan

While employees’ goals and responsibilities are outlined in the job description when they come on board, it’s essential to review this information with them regularly. Clearly set and communicated goals will help your employees understand what is expected of them and when they are falling behind.

2. Monitor

Management should be monitoring their employees’ performance continuously. If you only check in once or twice a year, a slight veer off the prescribed path could have lasting impacts on one’s performance. That’s why staying in constant communication with your employees, and keeping an open environment for feedback is essential all year long.

3. Develop

If you have identified areas of improvement for your employee, you can work with them to provide training, mentoring, educational courses, or other materials that can help them get back on track or fill any skill gaps.

4. Rate

Without a rating scale, it can be difficult to recognize whether employees are improving from their development plan. Additionally, with a rating scale that is communicated to employees, they know where they currently stand, and what is needed to move them to the next level of performance.

5. Reward

While every step of the process is necessary, the reward may be the most important. Positively reinforce employees who are hitting their goals or working towards them. Recognize them for their hard work and for striving to be better and do better for the organization.

This can be in the form of bonuses, thank you cards with token gifts, public recognition, or through an employee rewards program. It not only inspires the employee who is being recognized but motivates others who may need an extra incentive.

Remember that the performance management process is a cycle that must be continuously employed throughout an individual’s time at your organization.

You’re never “done” with performance management and this should be conveyed to your employees when they join the company, and then communicated to them throughout their employment. Without open communication throughout the process, employees may become complacent in their lackluster job performance or disengaged.

Performance Management Best Practices

This concept and process have been around for years and thankfully, there’s no need to reinvent the wheel. There are a number of performance management best practices that you can incorporate into your plan.

  1. Re-evaluate goals regularly. If there’s anything the COVID-19 pandemic has taught us, it’s that societal shifts can demand a new approach to business. Goals may need to change and clinging to old decisions in a new world could cause you to penalize (and lose) good employees.
  2. Employ SMART goals. In order to be achievable, goals must be clearly defined and communicated, and Specific, Measurable, Actionable, Relevant, and Time-bound. Employees will be more likely to achieve goals when they are properly crafted.
  3. Utilize the objectives and key results methodology. The OKR methodology can help your team set, communicate, and track organizational goals. This will foster accountability among your employees.
  4. Have performance conversations throughout the year. Performance management conversations should not reveal any surprising information to the employee or manager. Ideally, managers are having open conversations with their team members about performance throughout the year, and performance reviews should serve as a check-in documenting performance over a specified time period. When you communicate regularly with each of your employees, they learn to expect constructive feedback and look forward to these encounters.
  5. Standardize and automate your process. All employees should follow the same performance management process, and be held to an even standard. In addition to making the process fair, there comes a tipping point when you may have too many employees to manage throughout a continuous cycle, and having a set process and automated software solution to manage performance reviews can be a helpful asset.

While creating a performance management plan in your organization will take some time and effort, it’s a necessary process for a thriving organization. Knowing which employees are excelling in their roles and reaching (or exceeding) goals, which employees need more support is priceless information.

New Call-to-Action

Categories B2B

What is the LinkedIn Pixel — and How Does it Work?

Social media platform LinkedIn has more than 800 million members, and has carved out a niche for itself among giants like Facebook and Twitter for its ability to connect job seekers and employers across the globe.

Less talked about, however, is the potential of this work-focused networking site for marketing, advertising, and sales opportunities. While it’s true that the primary purpose of LinkedIn is streamlining employment and recruitment efforts, the platform also supports more social connections and in turn, opens the door for targeted campaigns that speak to the needs of its specific user base.Free Guide: How to Use LinkedIn for Business, Marketing, and Networking  [Download Now]

The challenge? Measuring the impact of these efforts. Sure, visitors might see your ads on LinkedIn, but what then? How do you know if they subsequently stopped by your website, signed up for your newsletter, or actually made a purchase?

This is the purpose of the LinkedIn Insight Tag, more commonly called the LinkedIn Pixel. Here’s what you need to know about what it is, what it does, how it works, and why it matters for your website.

Worth noting? This isn’t a piece of third-party code — it’s provided by LinkedIn directly and is designed to streamline the process of connecting ads campaign data with LinkedIn user information. According to the platform’s official LinkedIn Insight FAQ, the tag shouldn’t impact website performance since it’s both lightweight and designed to load asynchronously with other web elements to reduce resource demands.

In effect, the LinkedIn Pixel works like a beacon that lets the platform keep sight of users after they click through onto your website and then provides a detailed report to help you measure the impact of your campaigns.

Of course, it’s worth mentioning the obvious caveat here: Always make sure you’re up-front about the use of the LinkedIn Pixel on your site. While user agreements with LinkedIn provide the legal framework to make using this Pixel possible without users having to opt-in on every webpage, it’s a good idea to be straightforward about your policies around data collection and use.

Otherwise, post-Pixel contacts may not go as planned if visitors start asking questions about where you got their information — and don’t like the answers.

Part of this process comes from basic website engagement metrics. Overall statistics about how many unique visitors your site sees each day, how many newsletter or email signups occur, and how many users move from browsing to cart to purchase all impact your broader marketing approach.

When it comes to drilling down and pinpointing target market segments, meanwhile, tools such as the LinkedIn Pixel are critical. Here’s why: As noted above, the social nature of LinkedIn skews toward business and employment, which means that marketing campaigns must take this perspective into account when designing any ads or promotions. While general data about conversions and customer contacts offers a generalized view of success across all platforms, it doesn’t tell marketing teams if LinkedIn-specific ads are effective.

The LinkedIn Pixel makes it possible to segment traffic and determine where visitors are coming from, in turn allowing your teams to see how many click-throughs and referrals come from LinkedIn and how many are from the web at large.

Ready to get the LinkedIn Insight Tag up and running on your website? Follow this step-by-step guide.

Now, let’s explore each step in more detail.

1. Sign into your Campaign Manager.

How to install the linkedin insight tag on your website: LinkedIn profile visualFirst, sign into your Campaign Manager. To do this, head to your personal or company LinkedIn profile and look for Advertise in the upper right-hand corner. Click it, and you’ll be taken to the Campaign Manager page.

How to install the linkedin insight tag on your website: step 1 sign into campaign manager

2. Select Your Ad Account.

Now you need to select your ad account. In the example image below, there’s only one ad account but if you have more than one, make sure you’re selecting the one that’s associated with the right campaign and website.

How to install the linkedin insight tag on your website: step 2 select ad account

3. Click on the Account Assets dropdown.

Once you’ve selected your account, look for the Account Assets tab on the right-hand side of the top navigation menu. Click it to get the next dropdown menu and select Insight Tag.

How to install the linkedin insight tag on your website: step 3 select account assets

4. Select Install my Insight Tag.

If you don’t have any Insight Tags installed, click on the blue button that says Install my Insight Tag.

How to install the linkedin insight tag on your website: step 4 select install my insight tag

5. Decide how you’ll install the tag.

You have three options when it comes to installing your tag: You can do it yourself, send the tag to a developer or use a tag manager — such as Google, Adobe, or Tealium — to install the tag.

How to install the linkedin insight tag on your website: step 5 decide how to install the tag

6. Copy the tag.

If you decide to do it yourself, click I will install the tag myself and then copy the code in the code box that appears.

7. Add the code to every page.

Now you need to paste the Insight Code tag on every page in your domain. LinkedIn recommends pasting it just above the closing HTML <body> tag in the global footer.

8. Check that the process worked.

Finally, head back to the Insight Tab page in your Campaign Manager and make sure your domains are listed. As noted by LinkedIn, this could take anywhere from a few minutes up to 24 hours.

Linking Outside the Box

The LinkedIn Pixel makes it possible to connect ad campaign performance with LinkedIn-referred traffic, in turn making it possible to better understand how your ads are performing and also allowing you to follow up with LinkedIn users to help drive increased conversions.

Ready to start linking outside the box? Opt for the LinkedIn Insight Tag.

New Call-to-action