Categories B2B

11 Conversion Copywriting Tips that Grew Our Revenue by 240%, According to Lately’s CEO

As marketers, we write copy daily: For landing pages, social media posts, email newsletters, you name it.

And this content isn’t just supposed to sound pretty — it’s also supposed to be powerful enough to convert visitors into sales. In fact, as of 2022, over 60% of marketers measure the success of their content through sales. That’s no small feat.

If you’re stuck in a writing rut or unsure how to use conversion copywriting to increase sales, you’re in luck. Here, I sat down with Lately’s CEO, Kate Bradley Chernis, to discuss the 11 tips that enabled her and her team to grow monthly recurring revenue by 240%.  

But first — what is conversion copywriting, anyway?

Free Guide: How to Build & Optimize Landing Pages

What is conversion copywriting?

Simply put, conversion copywriting is copy with the ultimate goal of converting readers into buyers.

Conversion copywriting uses engaging and persuasive language to motivate readers to take a specific action.

Typically, the goal with conversion copywriting is to encourage readers to purchase a product or service. However, conversion copy can be used at all stages of the buyer’s journey, so conversion copywriting might be leveraged to inform buyers’ of their pain points, encourage them to sign-up for newsletters or future offers, or simply increase brand awareness.

Conversion copywriting ultimately falls under the broader topic of website conversion rate optimization (CRO) — or leveraging your website to effectively convert users across your homepage, blog, pricing page, and more. 

There’s a difference between conversion copywriting and SEO copywriting. As Chernis puts it, “As a startup founder, I’m in the business of turning customers into evangelists — because evangelists work for you for free. SEO is never going to get me there. Besides, SEO is reliant on you, the search engine user, to take all the action. But with conversion copywriting, I’m driving the conversation and have complete control over where it goes.”

SEO and conversion copywriting can coincide, but the biggest distinction is the goal you’ll have in-mind when creating the content: SEO copy is copy written with the intent of getting on page one of Google. Conversion copy, on the other hand, is written with the intent of keeping readers’ on-page once they find your content.

Consider, for instance, the following LinkedIn post by Chernis:

The piece uses engaging and active language to encourage viewers to join one of Lately’s live video Office Hours. While the content might not pass an ‘SEO-optimized’ test, it doesn’t need to — on social media, it’s more about standing out from the crowd through authentic, creative content.

Next, let’s dive into some of Chernis’ favorite copywriting tips, followed by a few impressive examples of conversion copywriting for inspiration.

11 Conversion Copywriting Tips, According to Lately’s CEO

1. Write like a boss.

The first – and perhaps most important — rule Chernis told me is to write with confidence.

She encourages writers to avoid words like need, think, just, probably, maybe, and possibly. Instead, be direct with your writing and ensure you’re getting your point across without superfluous details.

In the examples below, you’ll notice that the brands and influencers we’ve highlighted do a fantastic job of writing with confidence. Consider Uber, for instance — the car-sharing app’s homepage reads: “Get in the driver’s seat and get paid.” It doesn’t read, “Consider getting into the driver’s seat, and you just might get paid.” It’s direct, firm, and assured.

Confidence is key to making you feel empowered to write directly to your readers and encourage them to take action, without offering apologies or excuses.

2. Remove the phrase ‘check out’ from your vocabulary.

I’ll admit: I’m as guilty of this as anyone.

It can be incredibly easy to write ‘Check out’ when you’re encouraging readers to click on a link or read a blog post, but Chernis suggests using stronger action verbs instead to communicate the value of what someone will get by completing your CTA.

For instance, consider the difference between the CTA link “Check out how to optimize your landing pages here” and “Optimize your landing pages here”. The second one is much stronger, and likely more effective. 

3. Don’t bury the lede.

As writers, it can be tempting to create beautiful, long-winded introductions full of humor and imagery and metaphors. But as conversion writers, it’s best to get to the point.

Chernis told me, “There’s something about this ‘warming up to the point’ that we all suffer from, an incessant over-intro’ing. Some of it is out of politeness, but ultimately, you want to be direct and get to that point, lickety split.”  

4. Use negative calls-to-action instead of positive ones.

Chernis says, “The bad kid in all of us responds to this tactic.”

Consider how you might leverage negative calls-to-action instead of positive ones — for instance, rather than writing, “Remember to follow these rules”, try “Don’t forget to follow these rules.”

Negative calls-to-action work particularly well for B2C brands. As an avid online shopper myself, I can attest: Seeing ‘Don’t miss out on 10% off’ or ‘Don’t forget to purchase’ is often all the encouragement I need to buy.

5. Leverage ‘why’ and ‘because’.

Whenever possible, aim to use ‘why’ and ‘because’ to posit interesting, thought-provoking, open-ended questions and encourage your viewers to keep reading to find out the answer. 

As Chernis explains in her copywriting course with HubSpot:

  • ‘Why’ wants to be resolved; the reader expects ‘because’.
  • ‘Because’ resolves the ‘why’ and triggers reason, which is an ingrained cue for trust — key for compelling CTAs.
  • ‘Because’ at the start of the sentence creates pause.
  • ‘Why?’ gets the bonus visual of a question mark.

Consider the HubSpot blog post title, ‘Why your brand needs a strong visual identity’ — for some, this unresolved question will be enough to get them to click.

6. Use the royal we/you.

As Chernis told me, using ‘I’ too often can signify selfishness in a brand. By contrast, using ‘we’ and ‘our’ implies inclusivity and trust, and ‘you’ signifies empathy.

Take a look at the difference between “In this post, I am going to demonstrate five examples of copywriting” versus “In this post, let’s explore five examples of copywriting” or “In this post, we’ll explore five examples of copywriting.”

Feel the difference?

7. Read what you write out loud.

Oftentimes, one of the easiest ways to catch awkward or cumbersome writing is by reading it out loud. Reading your content out loud can help ensure you sound authentic, natural, and human.

Additionally, Chernis encourages writers to seek out different ways to say the same thing by leveraging synonyms. She says, “How can you say the same thing differently and do it in a way that cuts through the noise? We all get lazy, but as conversation copywriters, this is our challenge. Find a more interesting way. Open the thesaurus. And don’t just pick any other word; it has to be the right word.”

8. Write with your eyeballs.

When writing for conversion, consider how your writing looks on the page. Many prospects and visitors will skim through your content, so you want to make that easy for them to do.

Leverage spacing, numbers, exclamation points, question marks, percent signs, emojis, and more to make your content as digestible as possible.

9. Do unto others.

As Chernis puts it, “Having compassion is key. Don’t forget that the person on the other end is a busy, stressed human like you. Take the time to ensure that what you want to communicate will be understood as you intend it.”

Reading out loud is one effective strategy to ensuring your writing conveys empathy. Additionally, put yourself in the reader’s shoes often and ask yourself, ‘Would I click this link?’ ‘Would I find this helpful?’ ‘Would I enjoy this content?’

If you’re not passionate about it, your readers won’t be, either.

10. Write with a clear objective.

Conversion copywriting is different from other types of writing in one key way: You want people to take action as a result of your writing.

Which is why Chernis encourages writers to identify what action you want readers to take, and then work backwards from it.

For instance, on social media, Chernis says there are only two objectives: conversion (click) and reach (share). She says to get readers to share your content, you’ll want to appeal to their ego.

As she puts it, “Reshares are all about ego and the person sharing that content — so make those people look smart and interesting, and they’ll share your content; that’s why Gary V. will write ‘Be nice to others’ and everyone shares it … you want to give people something that will make them look cool to others.”

Additionally, Chernis told me the second action — click — always works with How-Tos and tactical content.

11. Dog-food your own marketing.

Finally, Chernis says successful conversion copywriting is about encouraging employees to share your message on social.

She says, “First and foremost, all of my employees are social beasts. That is a must. We also broadcast all of our Lately branded content on each of their personal social channels, because together, we’re stronger. We even have a Slack channel called #sharingiscaring, where every time someone evangelizes us on social, we drop the link in that Slack channel and my entire team is expected to boost it with likes, comments and re-shares. I might even share those links with other Slack groups or with my investors … because I’m an army of one. I rely on the help of other people.”

Chernis adds, “If your employees aren’t following and sharing your message, you’ve got bigger problems. They should be your biggest fans.”

How Lately Achieved 240% Monthly Recurring Revenue Increase from Copywriting Alone

When I spoke with Chernis about her copywriting tips, I was also curious about the results of her conversion copywriting efforts. Does conversion copywriting actually matter all that much to a business’ bottom line?

Turns out, it does. For Lately, conversion copywriting alone led to a 240% increase in monthly recurring revenue, and a 98% sales conversion rate.

Wondering how?

Chernis told me she does one public speaking or guest post every single day. When she’s done, she asks for the file and uploads the file into Lately, which uses artificial intelligence to transcribe the text and pull out one-liners that the AI knows will get the highest re-shares, likes, and comments.

Chernis says, “We don’t do any paid ads, cold calls, or cold emails. Instead, we repurpose all our content to the nth degree. Lately’s AI picks out which bits will get us the most likes, shares, and comments — it knows what our targets want to read, watch, or hear. We then consider those folks ‘warm leads,’ we either qualify or disqualify, and by the time we get them into a demo, we have that 98% sales conversion rate because those leads are hot.”

Ultimately, she told me you can do something similar even without the use of AI. It would just take longer, and you’d have to guess which bits to highlight.

The key is persistency and amplification of each branded message. 

kate bradley chernis on marketing with AINext, let’s dive into some conversion copywriting examples.

Conversion Copywriting Examples

1. Spotify

Direct, and to the point.

Spotify sure doesn’t bury the lede with this one: “Get 3 months of Premium for free.” You know exactly what they want you to do (sign-up) and you know exactly what you’ll get for completing the request (3-months free). The focus is on you, the reader. This is an actionable, assertive, powerful example of strong copywriting.

2. Black Girl Sunscreen 

Start-to-finish, this caption is fun, engaging, and personal. It’s concise, but uses playful phrases (i.e. “no mess, no stress”) to connect with Instagram followers.

Additionally, this is an effective example of ‘writing with your eyeballs’. The caption is easily digestible, using sun emojis as bullet points and an arrow to draw attention to the “Available Now” CTA. 

3. Ann Handley

Master-marketer/writer Ann Handley is no stranger to strong conversion copywriting. For instance, her newsletter subscription page is concise and informative: Telling you exactly what you’ll get in her newsletter, and even offering an empathetic “Unsubscribe whenever you want” — signaling Handley took the time to understand any concerns her readers might have when signing up.

4. Uber 

I love this conversion path from Uber’s homepage: “Get in the driver’s seat and get paid.” The content doesn’t waste time on any benefits beyond the major one: financial gains as a result of signing up to drive for Uber.

Plus, Uber is smart enough to know why most prospects visit their website — to become a driver, explore Uber Eats, or get a ride – so they don’t waste their readers’ time on superfluous content.

5. Kate Bradley Chernis

Here, Chernis shows an authentic, human side while asking her LinkedIn followers to take action. In particular, notice how Chernis uses negative calls-to-action, i.e. “Learn what not to do” and “Plus all the reasons not doing it are costing you” to effectively convey her message and convince followers to join the live webinar. 

Now, it’s your turn.

It’s time for you to take these tips to bring your conversion copy to the next level. The end result is glorious: higher sales, better revenue, more customers, and through-the-roof conversions. It’s up to you to produce the content that will make this happen.

New Call-to-action


New Call-to-action

Categories B2B

Learning What B2B Buyers Want Through Content Consumption Data

For the second year in a row, content consumption increased in a big way. In total, since the beginning of 2020, NetLine has seen reported growth of 33% – a remarkable rise in overall demand. While we’ve detailed this in great length in our annual 2022 Content Consumption Report, we know there are still considerable hurdles for Marketers to navigate. 

As B2B organizations continue to face new challenges created by the pandemic, they’re also hyper-aware of the need to rapidly adapt in order to grow. To do this effectively, you need to understand not only who your buyers are but what they want.

Digging Into What B2B Buyers Want 

Marketers are spinning a lot of plates. 

The more consumption rises, the more your content needs to be simplified without losing substance. 

Your library needs to contain content for multiple audiences at every stage of the funnel, while simultaneously keeping the type of content prospects consume (and the rate at which they consume it) top of mind.

And that’s not even to mention how you should begin to fold in buyer-level intent data on top of all this. What’s a modern Marketer to do?

In an upcoming webinar with Iron Horse, we’ll detail exactly what to look for in your data and how to leverage it properly.

Join us on April 28th at 11am PT for a coffee break discussion between Amber Keller, Associate Content Director at IronHorse, and David Fortino, Chief Strategy Officer at NetLine. Together, they’ll be digging into our first-party data findings inside the 2022 Report, including:

  • Who to target with your content
  • Which content formats generate the most interest
  • How to understand intent from content consumption
  • How to address the need for “more” without overwhelming your audience

Register for Understanding What Buyers Want: Digging into B2B Content Consumption Data.

Here’s a sample of what to expect on the 28th.

Addressing the Need for More

One of the key findings in our sixth annual consumption report states that as content demand volume increases, so too does the total time to consume. This uptick in demand is directly connected with the needs of the Buyer Committee and how much information it requires to be satisfied. Research from FocusVision further supports our findings, stating that professionals seek out as many as 13 pieces of content before arriving at a purchase decision. Clearly, the need for more has never been greater.

Why is this significant? Well, not only because it has a direct impact on the number of assets needed in any content library, but because of the amount of time each asset will require. 

For example, eBooks are the most popular content format across our platform. Not only did they represent more than ⅖ of all registrations, eBooks were 4.8x more likely to be requested compared to White Papers. Knowing this, one might say they should focus all their content production efforts on eBooks. While this would be a wrong move for a multitude of reasons, here’s the one that matters most: eBook requests aren’t the best indicator of purchase intent.

eBook requests certainly can indicate a level of interest in a given product, they pale in comparison to White Papers. While eBooks can take just about any form and vary in length, they’re often more casual and communicate visually. White Papers, however, are traditionally weightier, lengthier, and require a true commitment from the consumer to dive into what’s being presented to them. Considering these factors, it should be a lot clearer why a White Paper registration should raise the purchase intent flags.

Content Formats More Likely Associated with Immediate Buying Decision Content Formats Less Likely Associated with Immediate Buying Decision
White Papers Tips and Tricks Guide
Survey Report eKit
Tool Course
Research Report Newsletter
Analyst Report eBook
On-Demand Webinar Book Summary
Live Webcast Cheat Sheet


But this is just the tip of the iceberg! David will be going into much greater detail in this webinar and will aim to get you ready to understand buyer behavior like never before. 

Register for Understanding What Buyers Want: Digging into B2B Content Consumption Data.

Save your spot now!

Categories B2B

How to Use the Weighted Average Formula in Excel

When you’re calculating the average for a set of values, you’re generally working with values that have the same weight and importance.


But what happens if some values weigh more than others? This is where the weighted average formula comes in.

Download 10 Excel Templates for Marketers [Free Kit]

In this article, we will break down how to use this formula in Excel, plus provide some examples.

How to Calculate Weighted Average in Excel

sumproduct weighted average formula

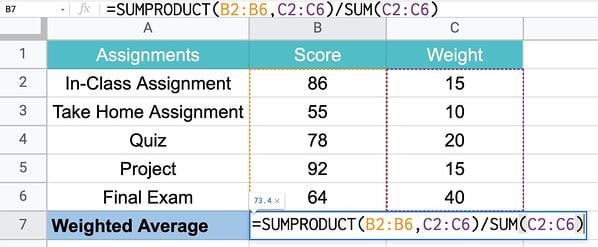
To calculate the weighted average in Excel, you must use the SUMPRODUCT and SUM functions using the following formula:

=SUMPRODUCT(X:X,X:X)/SUM(X:X)

This formula works by multiplying each value by its weight and combining the values. Then, you divide the SUMPRODUCT but the sum of the weights for your weighted average.

Still confused? Let’s go over the steps in the next section.

Using SUMPRODUCT to Calculate Weighted Average in Excel

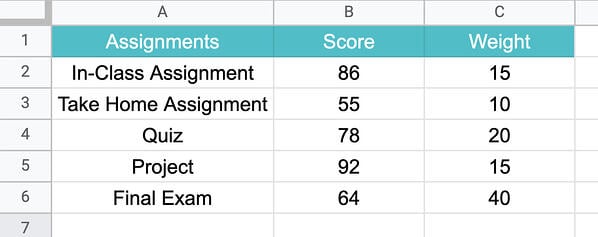
1. Enter your data into a spreadsheet then add a column containing the weight for each data point.

sumproduct to calculate weighted average in excel step 1

2. Type =SUMPRODUCT to start the formula and enter the values. sumproduct to calculate weighted average in excel step 2

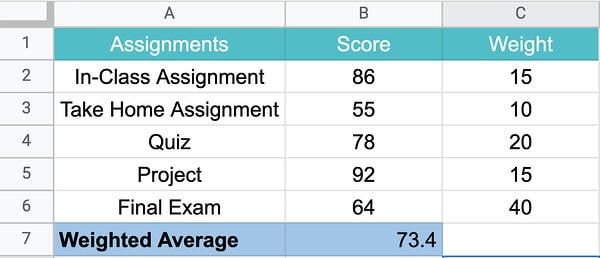
3. Click enter to get your results.

sumproduct to calculate weighted average in excel step 3

How to Find Weighted Moving Averages in Excel

A weighted moving average is a technique used to keep the time period of the average the same as you add new data or give more weight to certain time periods. This can allow you to identify trends and patterns more easily.

For instance, say you have the number of views your website got in the last five days, you can easily determine the average views in a five-day period.

Now, say the next week, I ask for the five-day average, you would use data from the last five days, not the original five days from the previous week.

As such, you’re still relying on the same time period but updating the data to generate the moving average.

For a weighted moving average, you give more weight to certain time periods than others. You may say that day 5 weights 60% with the remaining percentages decreasing by day.

As such, you’ll need to manually calculate this formula.

WMA = [value 1 x (weight)] + [value 2 x (weight)] + [value 3 x (weight)] + [value 4 x (weight)]

Once you get the hang of it, using the weighted average formula is easy. All it takes is a little practice.

excel marketing templates

Categories B2B

30 Google Sheets Shortcuts Marketers Need to Know

As a marketer, you already know you love Google Sheets for storing data, tracking performance metrics, and creating collaborative reports. But are using the full arsenal of Google Sheets shortcuts available to streamline your workflow and save valuable time?

Whether you’re experienced with Google Sheets or you’re just getting started, you’ll be happy to know there are many simple and time-saving Google Sheets keyboard shortcuts at your disposal.

Keeping track of the numerous keyboard shortcuts may sound daunting but, luckily, I’m here with a list of Google Sheets shortcuts you can bookmark and return to again and again.

→ Access Now: Google Sheets Templates [Free Kit]

30 Google Sheets Keyboard Shortcuts

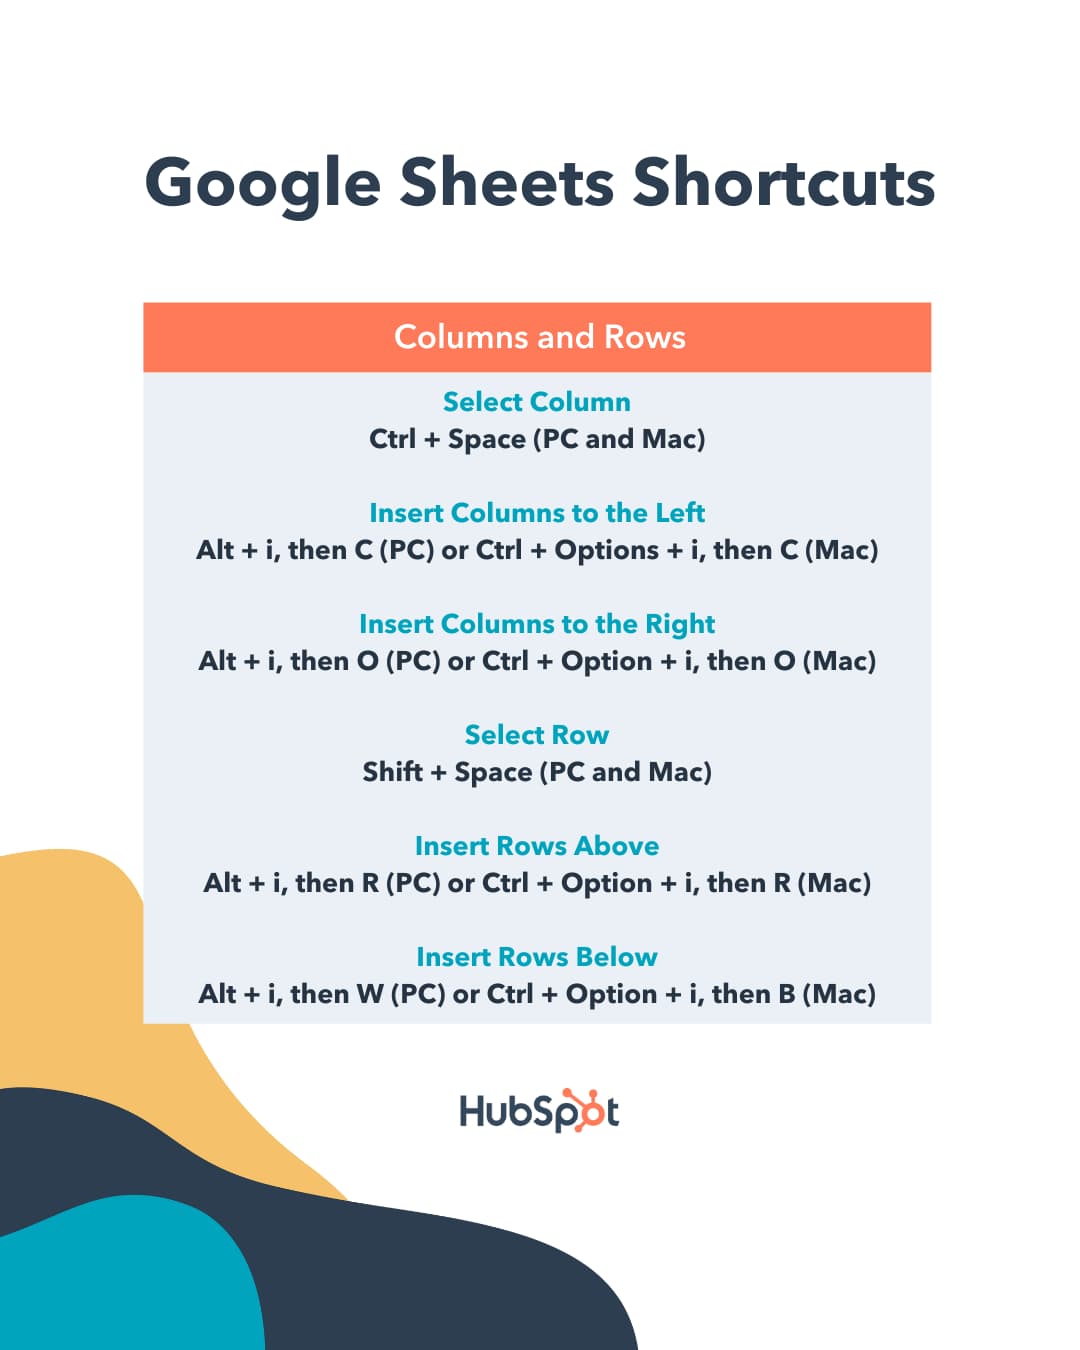
1. Select column

Ctrl + Space (PC and Mac)

2. Insert columns to the left

Alt + i, then C (PC), Ctrl + Options + i, then C (Mac)

3. Insert columns to the right

Alt + i, then O (PC), Ctrl + Option + i, then O (Mac)

4. Select row

Shift + Space (PC and Mac)

5. Insert rows above

Alt + i, then R (PC), Ctrl + Option + i, then R (Mac)

6. Insert rows below

Alt + i, then W (PC), Ctrl + Option + i, then B (Mac)

How to use Google Sheets Shortcuts to select columns, insert columns to the left or right, select row, and select rows above or below.

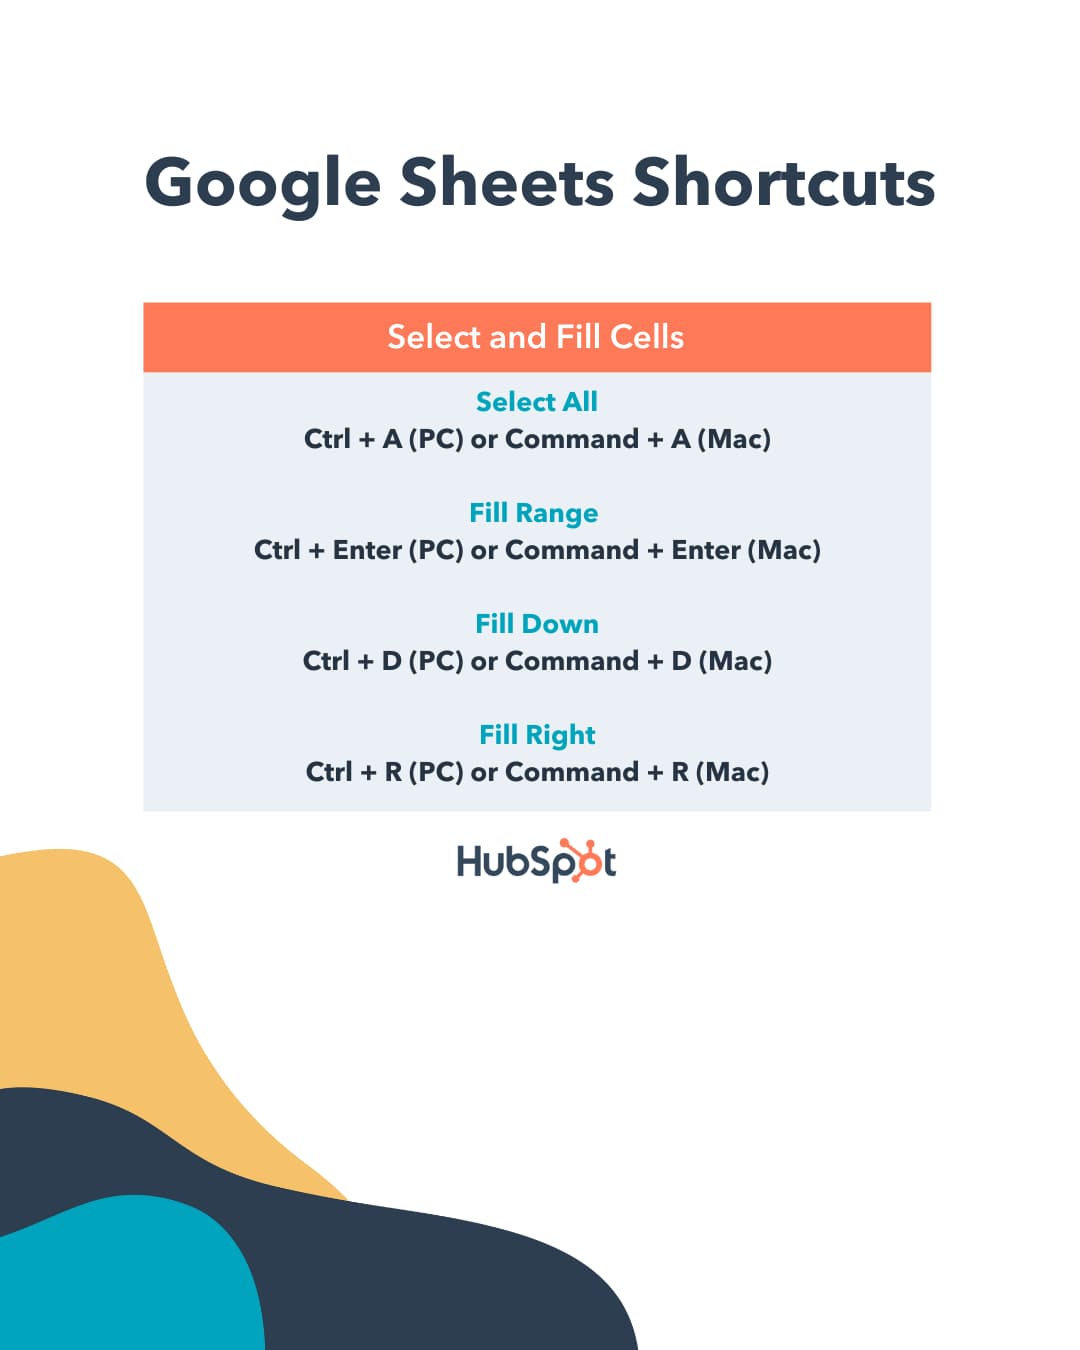
7. Select all

Ctrl + A (PC), Command + A (Mac)

8. Fill range

Ctrl + Enter (PC), Command + Enter (Mac)

9. Fill down

Ctrl + D (PC), Command + D (Mac)

10. Fill right

Ctrl + R (PC), Command + R (Mac)

How to use Google Sheets shortcuts to select all, fill range, fill down, and fill right.

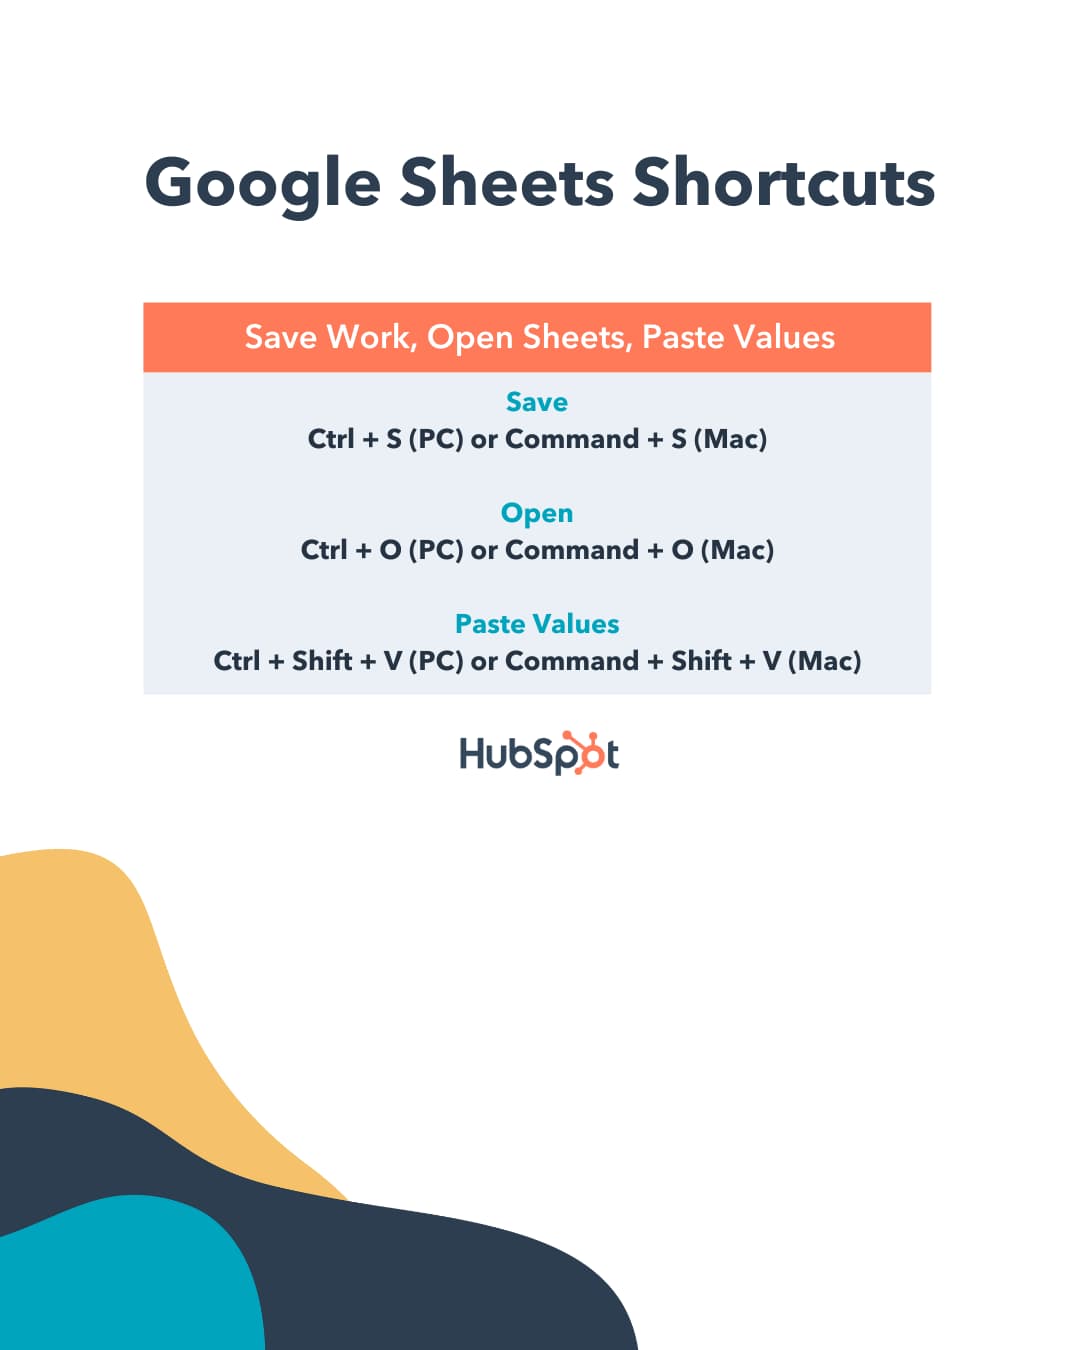
11. Save

Ctrl + S (PC), Command + S (Mac)

12. Open

Ctrl + O (PC), Command + O (Mac)

13. Paste values

Ctrl + Shift + V (PC), Command + Shift + V (Mac)

Using Google Sheets shortcuts to save work, open sheets, and paste values

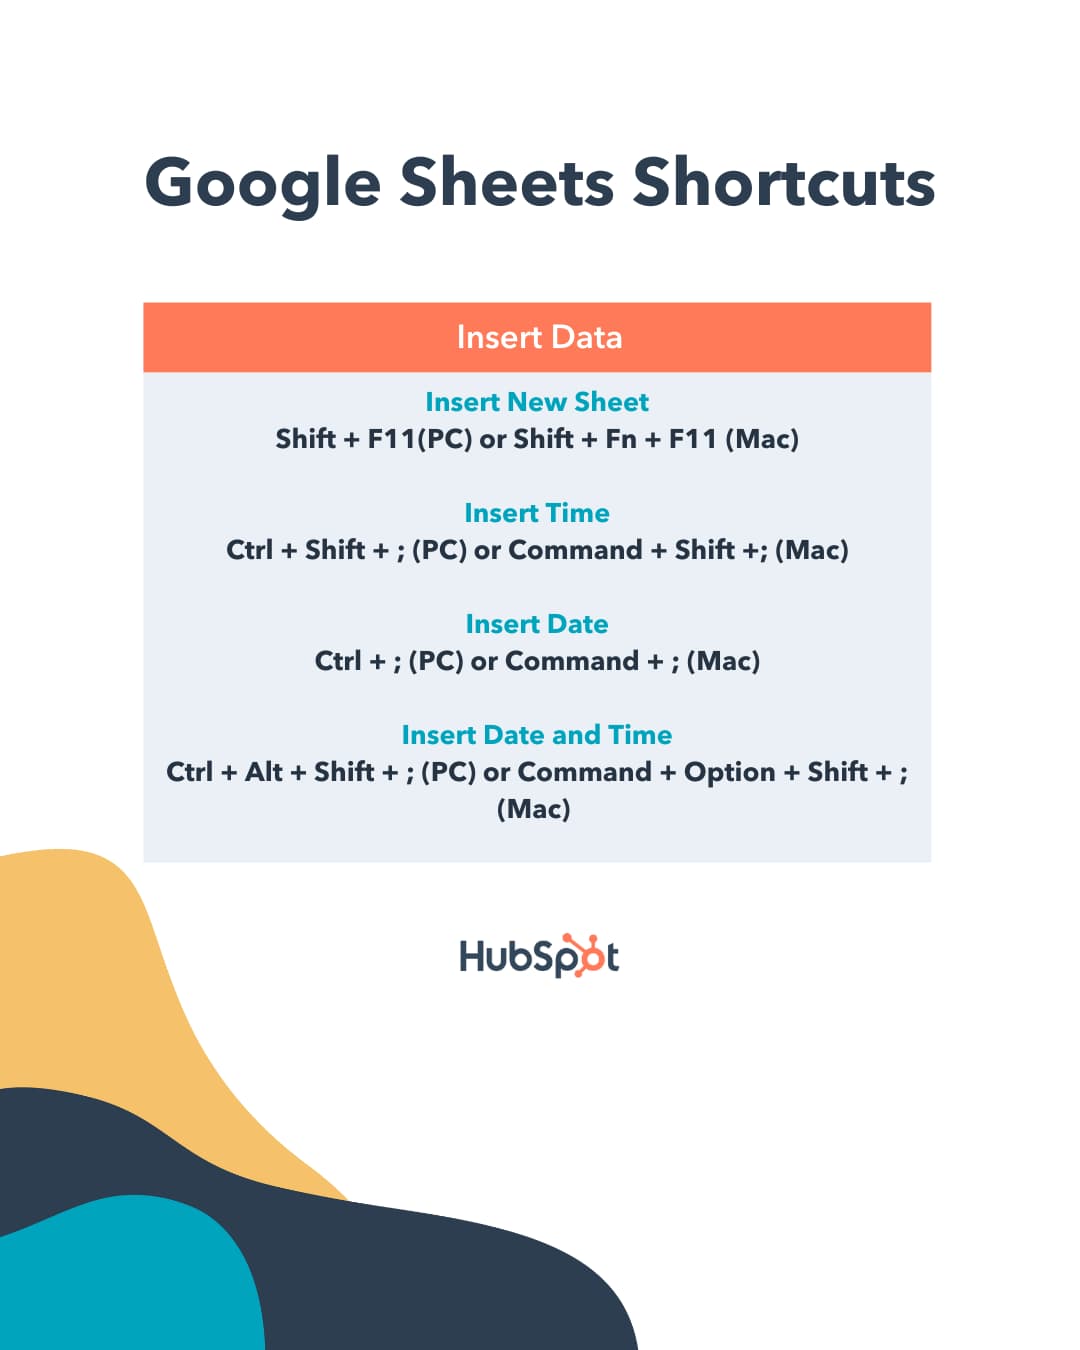
14. Insert new sheet

Shift + F11(PC), Shift + Fn + F11 (Mac)

15. Insert time

Ctrl + Shift + ; (PC), Command + Shift +; (Mac)

16. Insert date

Ctrl + ; (PC) , Command + ; (Mac)

17. Insert date and time

Ctrl + Alt + Shift + ; (PC), Command + Option + Shift + ; (Mac)

Using Google Sheets shortcuts to insert new sheet, insert time, insert date, and insert date and time

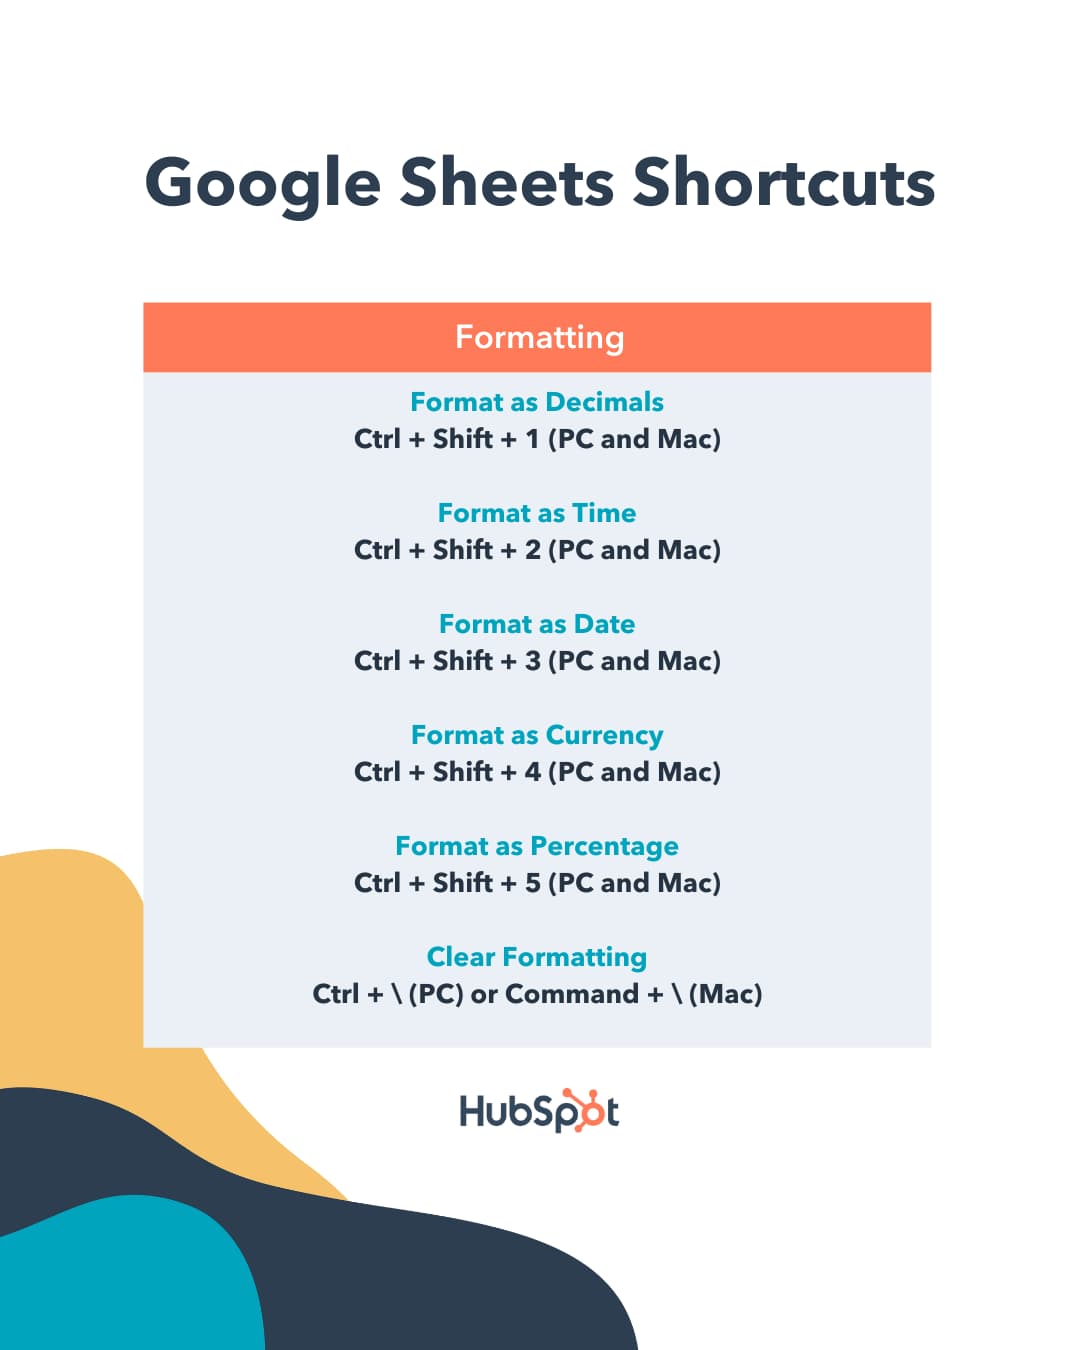
18. Format as decimals

Ctrl + Shift + 1 (PC and Mac)

19. Format as time

Ctrl + Shift + 2 (PC and Mac)

20. Format as date

Ctrl + Shift + 3 (PC and Mac)

21. Format as currency

Ctrl + Shift + 4 (PC and Mac)

22. Format as percentage

Ctrl + Shift + 5 (PC and Mac)

23. Clear formatting

Ctrl + (PC), Command + (Mac)

Using Google Sheets shortcuts to format as decimals, time, date, currency, percentage, or to clear formatting

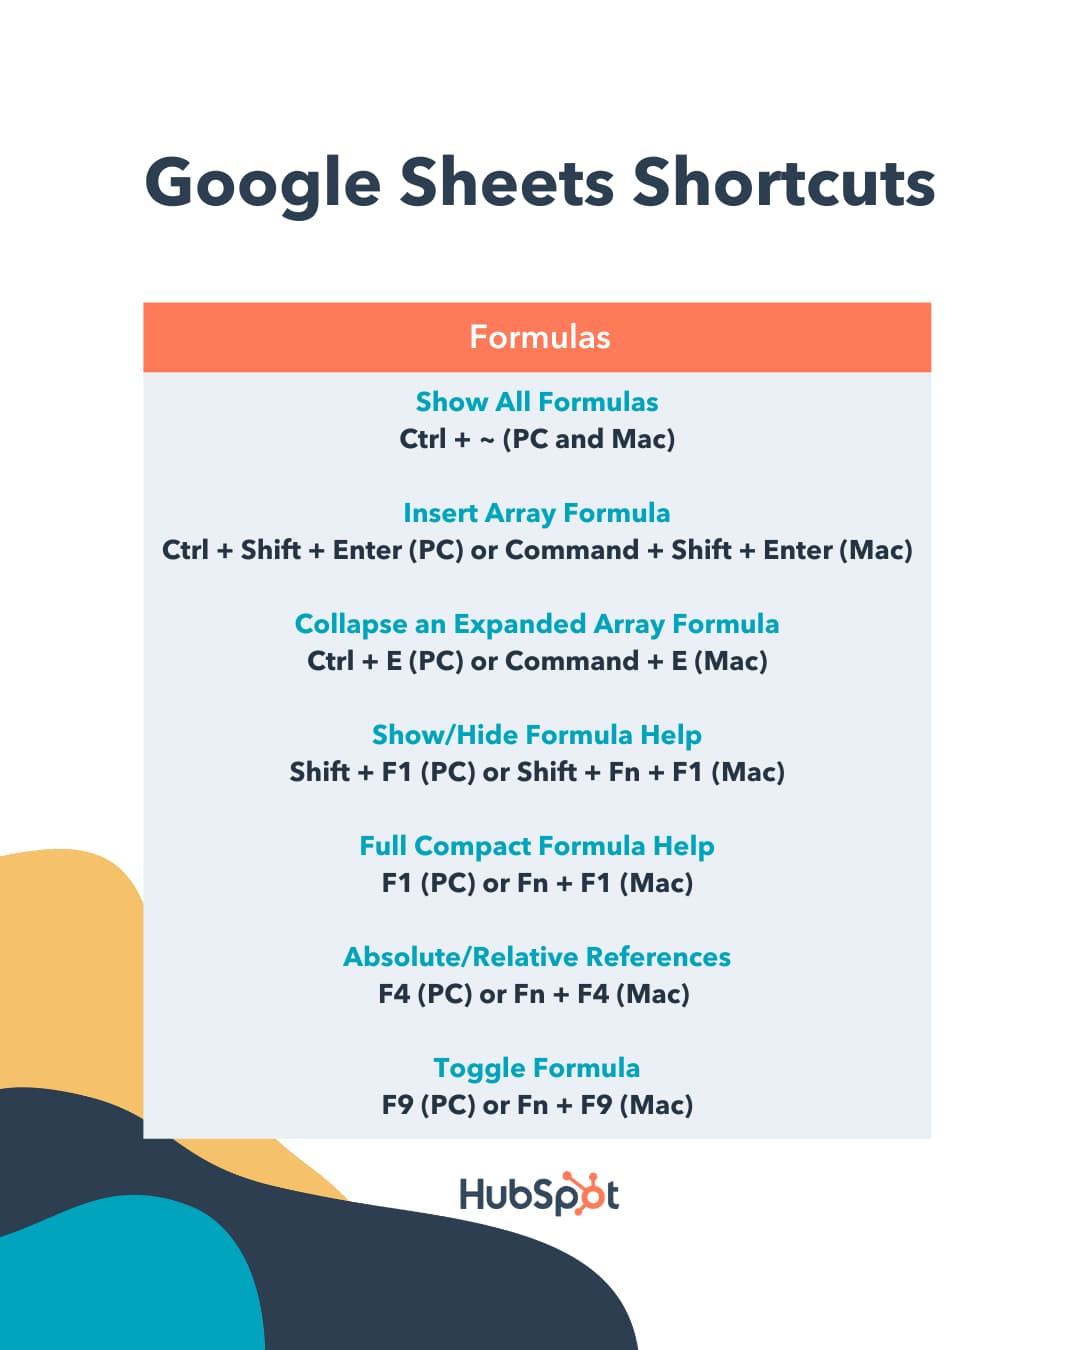
24. Show all formulas

Ctrl + ~ (PC and Mac)

25. Insert array formula

Ctrl + Shift + Enter (PC), Command + Shift + Enter (Mac)

26. Collapse an expanded array formula

Ctrl + E (PC), Command + E (Mac)

27. Show/Hide Formula Help

Shift + F1 (PC), Shift + Fn + F1 (Mac)

28. Full Compact Formula Help

F1 (PC), Fn + F1 (Mac)

29. Absolute/relative references

F4 (PC), Fn + F4 (Mac)

30. Toggle Formula

F9 (PC), Fn + F9 (Mac)

Using Google Sheets shortcuts to show all formulas, insert array formula, and more

An Alternative to Google Sheets Custom Keyboard Shortcuts

In the past, Google Sheets custom keyboard shortcuts were an option users could perform to customize their shortcuts in a way that suited them best. However, nowadays custom keyboard shortcuts in Google Sheets are not an option.

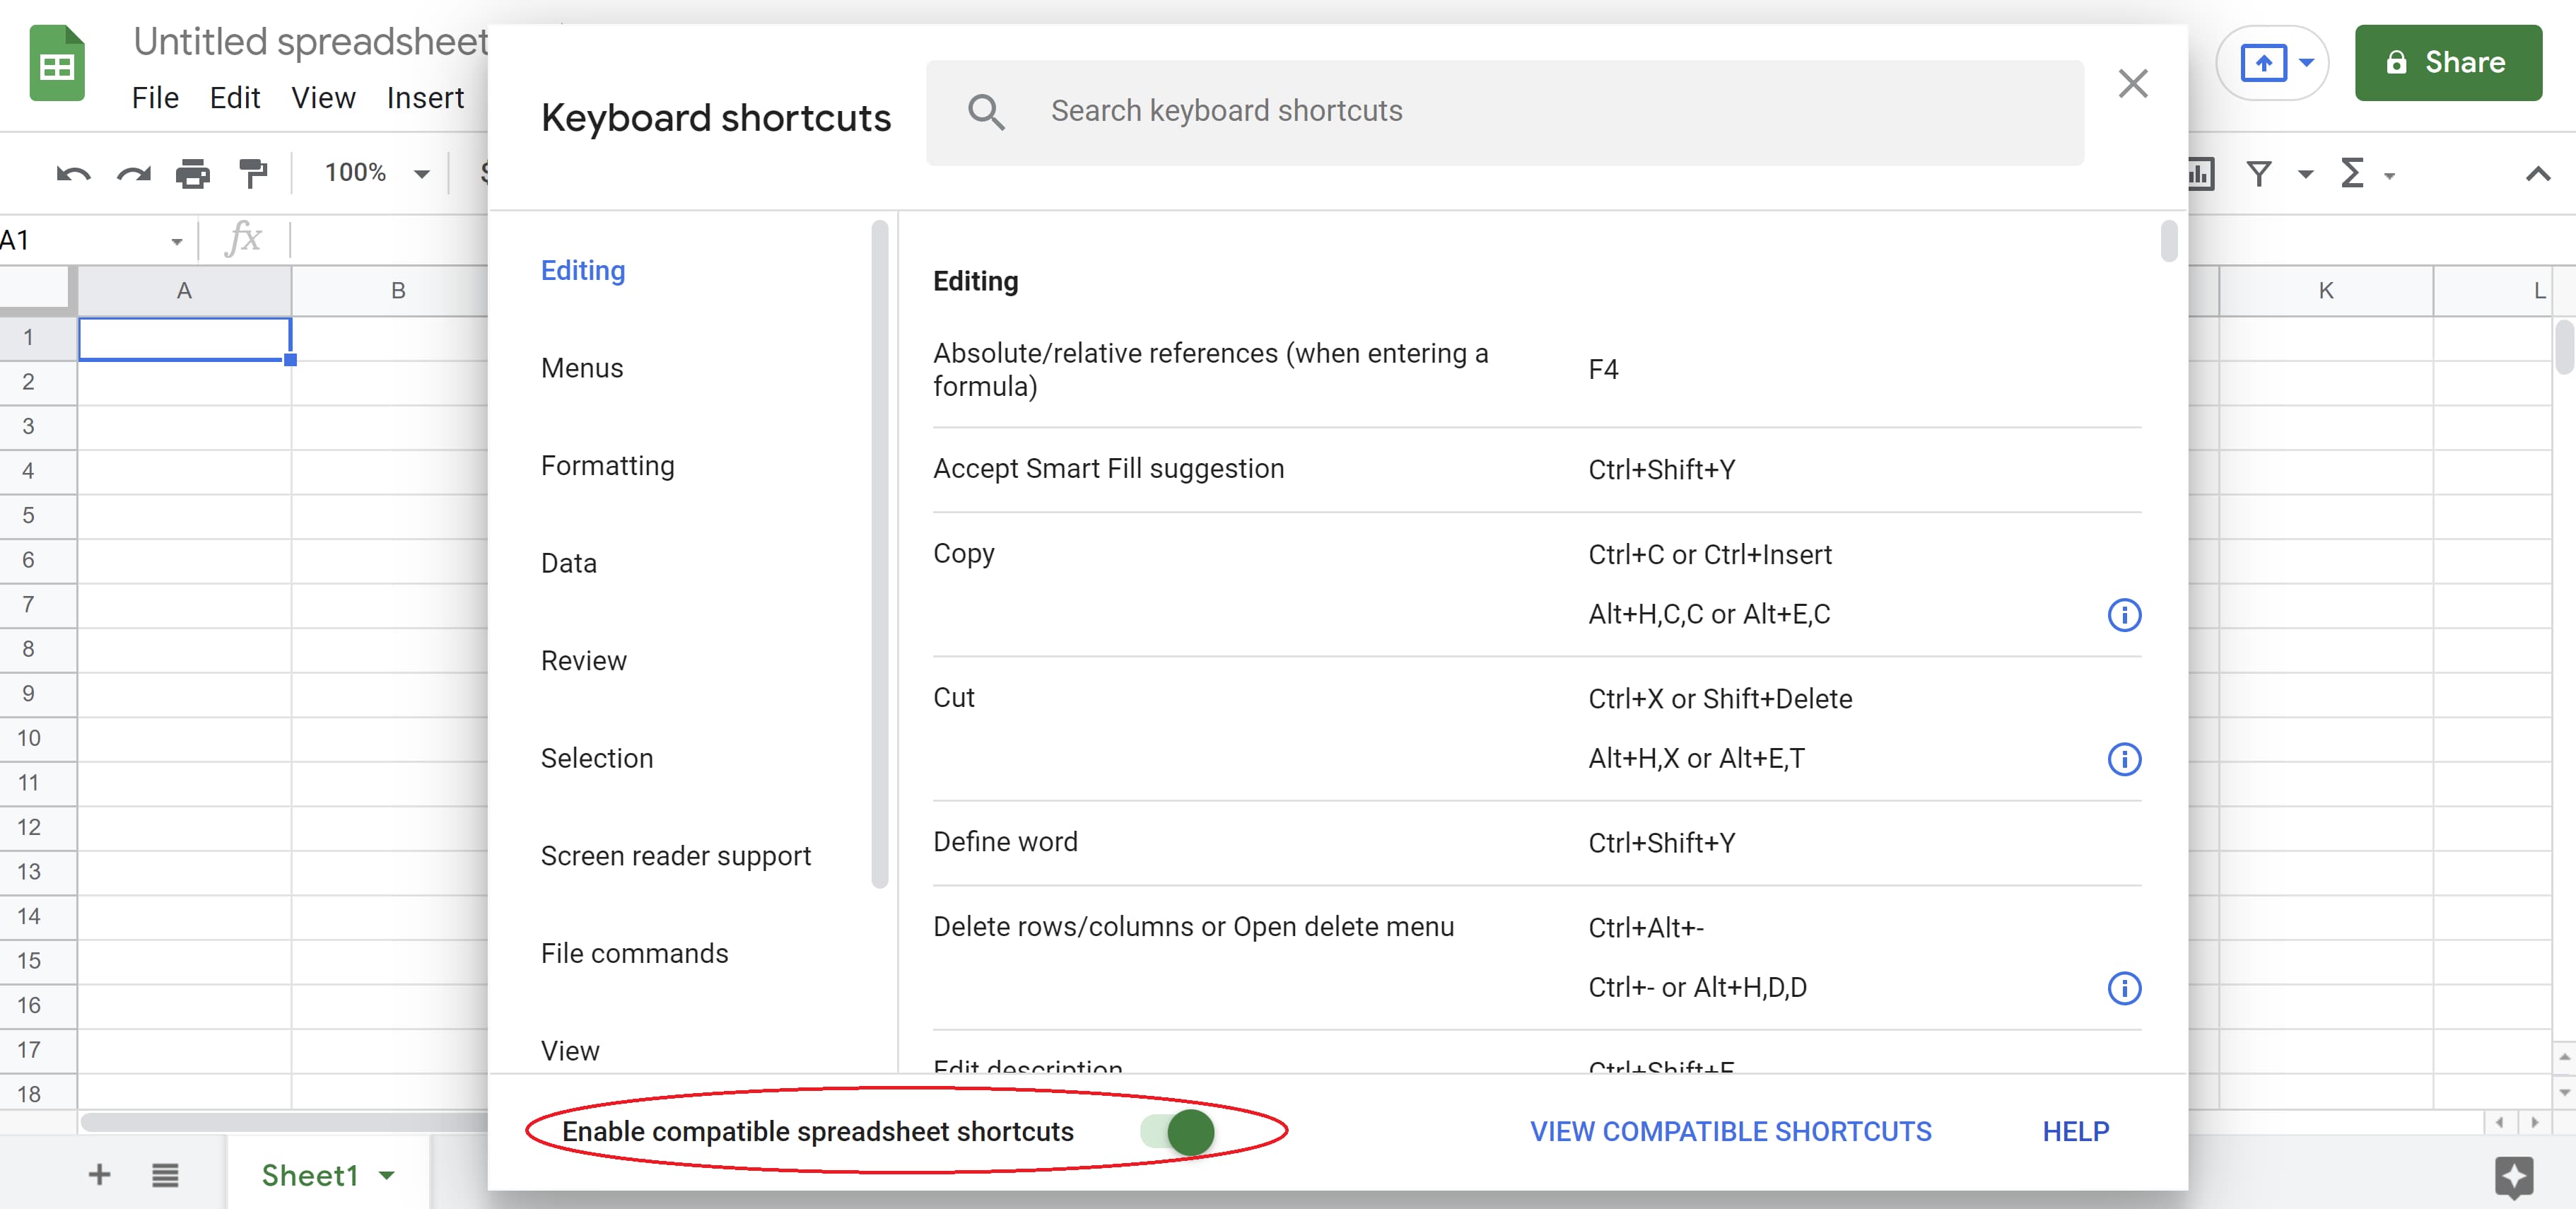
But don’t worry! Another feature that can help you further streamline your work in Google Sheets is the ability to use compatible keyboard shortcuts from other digital spreadsheets, like Excel, in Google Sheets.

To do this, press Ctrl + / then click the button next to “Enable compatible spreadsheet shortcuts.”

How to enable Excel shortcuts with Google Sheets shortcuts

Afterward, you’ll have more than 100 new keyboard shortcuts you can use to record and sort your data in Google Sheets.

Work Smarter, Not Harder, with Google Sheets Keyboard Shortcuts

Keyboard shortcuts allow you, as a busy marketer, to streamline your workflow and cut down on the time it takes to record and sort data in Google Sheets. Best of all, these shortcuts are easy to implement whether you’re on a Mac or PC.

Not only will these time-saving shortcuts make data recording more convenient, they’ll also allow you to spend more time focusing on other tasks —because, let’s face it, a marketer’s work is never done.

business google sheets templates

Categories B2B

How to Prevent Click Fraud

When it comes to business, the old adage “You’ve got to spend money to make money,” couldn’t be more true. Aside from the financial outlay to develop your product and manufacture it, and all the overhead that comes with owning a business, you are responsible for marketing your product so the public knows that your product exists.

Download Now: Free Ad Campaign Planning Kit

You’ve set aside some marketing dollars to spread awareness and attract people to your brand and your website. You’ve looked into a variety of advertising options, and determined that pay-per-click (PPC) advertising is a sound way to spend your marketing budget. After all, you only pay when users click on your ad, so you only pay to advertise to people who are at least mildly interested in what you offer.

PPC advertising can provide a healthy return on investment – unless you become the victim of click fraud. By understanding what click fraud is, and being aware of the tools that are available to protect yourself and your investment, PPC can be an excellent choice to market your business.

What is click fraud?

Click fraud happens when a person or a bot clicks on an ad, button, or hyperlink to trick the platform into thinking there is more interaction than there actually is.

With PPC advertising, click fraud can happen for one of two reasons:

  1. The website owner who is hosting the ad will click on the link repeatedly to increase the amount of money the business must pay them.
  2. A company’s competitor may employ click fraud to divert from the business’s marketing budget.

Interestingly enough, sometimes it’s the business itself that will engage in click fraud. Search engines like Google rely on the click-through rate – how many people have visited a site because of a certain link – to determine search rankings. Sometimes, a business owner will attempt to scam the system, inflating the number of clicks through click fraud and moving up the search engine ranks so that more actual users will find and visit their page.

Any type of click fraud can be damaging to a business which is why you’ll want to protect yourself against this illegal practice.

What is a click bot?

You’ve likely heard of click fraud bots, but do you know how they operate? It’s estimated that bots comprise roughly 52% of all internet traffic. Harmful bots (like fraud bots) make up a large part of this number.

So what are click bots and what are they doing to our websites? Click bots are designed to carry out click fraud. They vary from relatively simple (access webpage and click on the desired link) to advanced (mimic the actions a human would take such as moving the mouse and clicking at uneven intervals). The more advanced a bot is, the more difficult it is to distinguish it from a legitimate user.

Rather than attempt to create hundreds of thousands of clicks from one device with a single IP address (this bot traffic would be immediately suspicious), bots are installed across many devices, often through malware. This means that the device owner is completely unaware that their electronic property is being used for nefarious purposes.

Bots aren’t always to blame for click fraud. Some scammers will employ people to manually perform click fraud. While it’s more difficult to recognize human fraud, it’s considerably less efficient than utilizing fraud bots.

Click Fraud Prevention

Instances of click fraud are not uncommon. A recent study from the University of Baltimore found that in 2020 click fraud cost marketers over $35 billion.

Search engines like Google have put practices in place to protect businesses from click fraud. These include:

  1. Automated detection systems built with machine learning and complex algorithms to keep ad platforms clean.
  2. Manual reviews when invalid activity is suspected or brought to their attention.
  3. Advanced research to uncover sources of invalid traffic and prevent them from entering their networks.

Knowing that Google is looking out for your business is great news, though it’s still important to be proactive to protect your business. The first step is creating ads that are more difficult for scammers to target. You can consider allocating more budget to social media ads that are less keyword-focused and therefore harder to search for.

You also have the option to be more targeted with your desired audience which will lessen your chances of encountering click fraud. Being more specific about the geographic locations your ads target and avoid can also provide an added layer of protection from click fraud.

Next, you can help prevent click fraud by keeping a close eye on your ads and your ad spend. The moment you suspect fraud, it’s time to jump into action. If you’ve detected fraudulent clicks coming from specific IP addresses, Google Ads will allow you to block these IP addresses.

Click Fraud Detection

While preventing click fraud is an admirable goal, it’s not always possible. Scammers have created highly advanced and indiscernible methods for perpetrating click fraud which is sometimes impossible for the average business to protect against.

Thankfully, there are a number of click fraud detection protection services available. Here are a few recommendations.

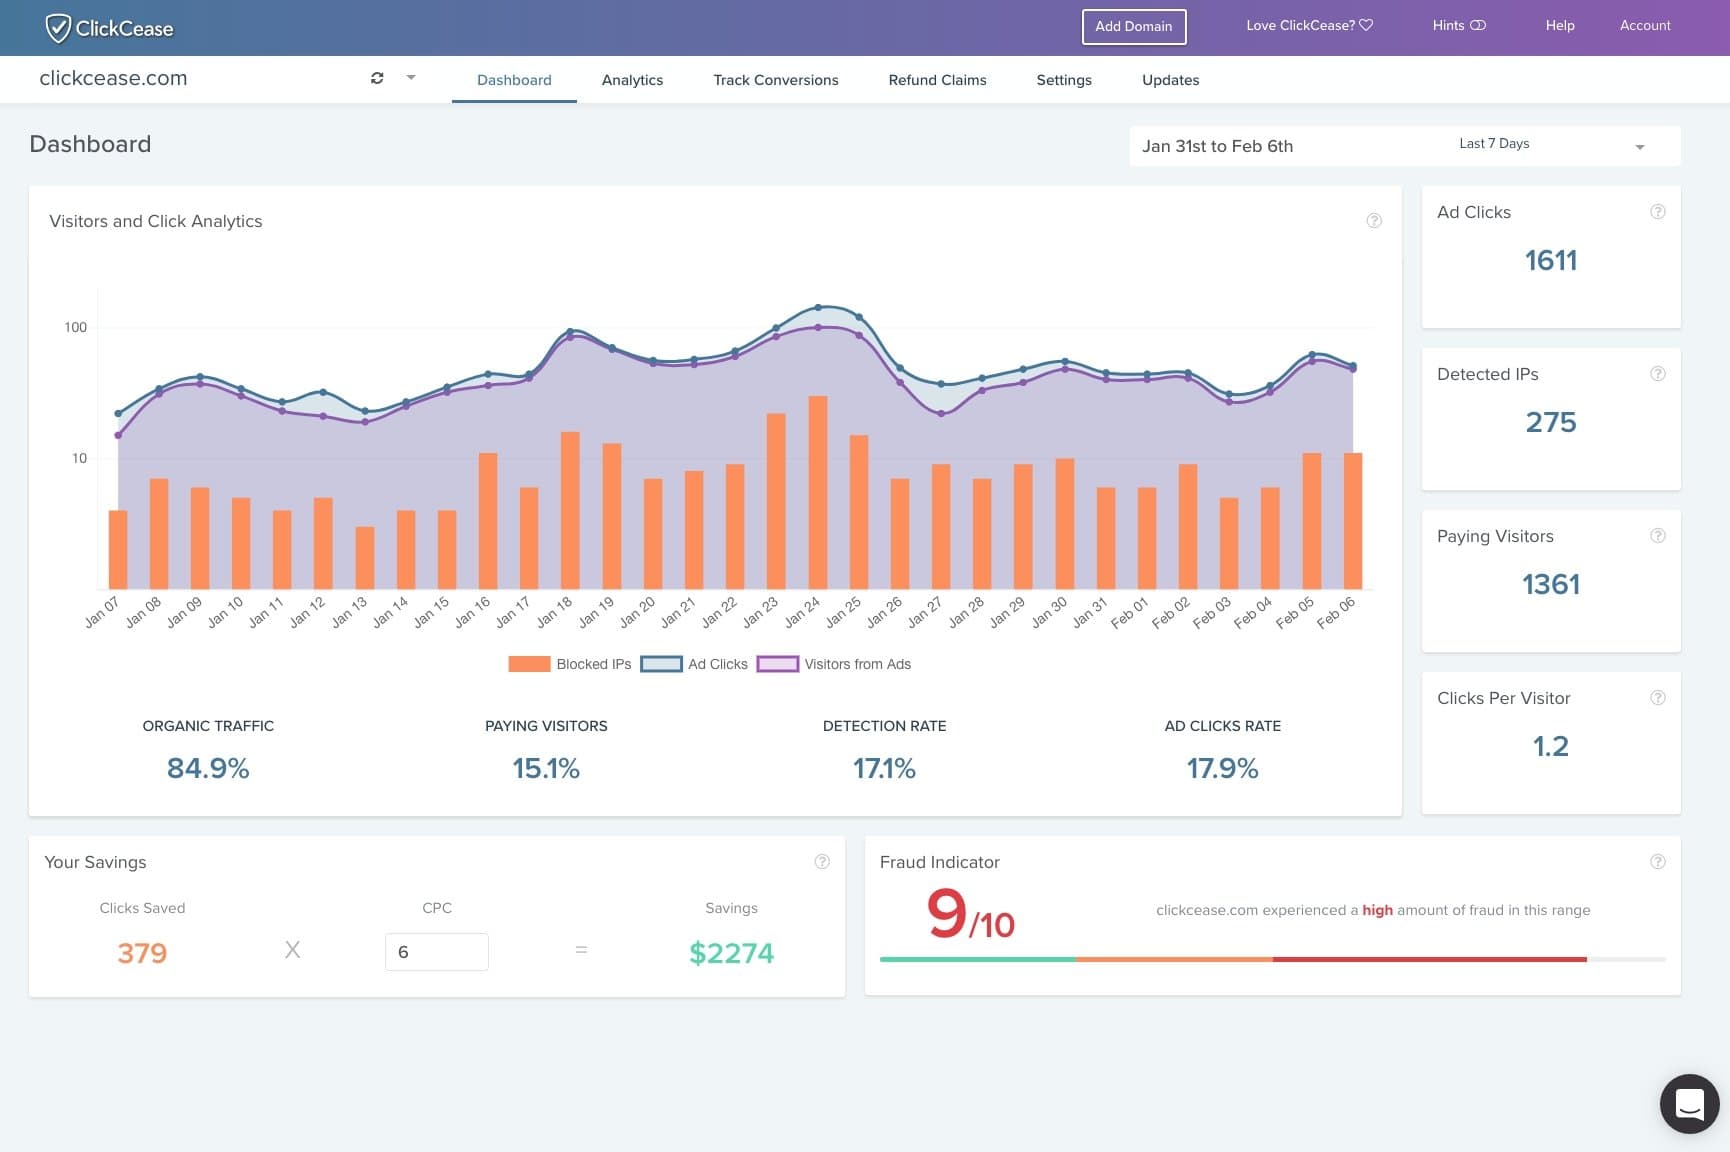
1. ClickCease

ClickCeace click fraud protectionImage Source

ClickCease blocks bot traffic from Google and Facebook ads before these clicks can impact your ad spend budget. Users can also create custom detection rules to provide the level of support their business needs.

Price: Standard Plan starts at $59 per month; Pro Plan starts at $79 per month

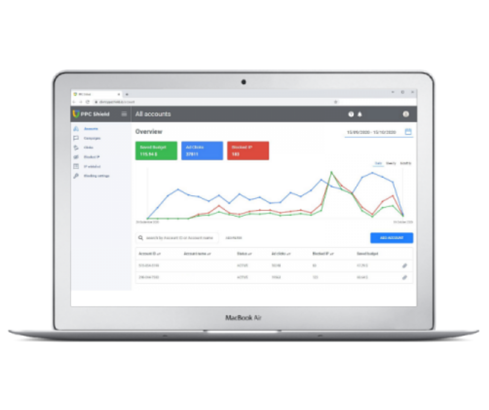
2. PPC Shield

PPC shield click fraud protectionImage Source

PPC Shield offers holistic support to protect your Google Ads campaigns from fraudulent clicks. Notable features include instant blocking of suspicious IP addresses, detailed reporting, and a budgeting tool to help you allocate ad spend saved from click fraud prevention.

Price: Basic Plan starts at $39 per month; Standard Plan starts at $55 per month; Professional Plan starts at $119 per month

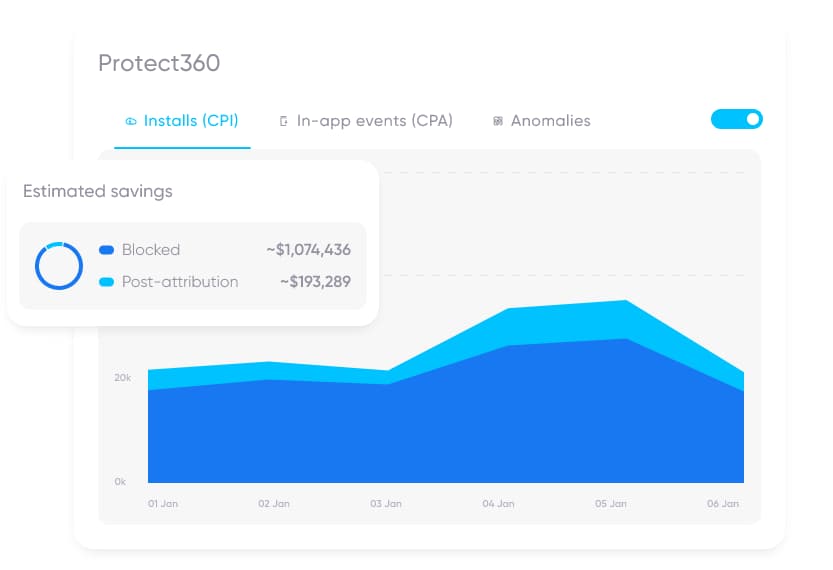
3. AppsFlyer

AppsFlyer click fraud preventionImage Source

Looking for protection for your ads against mobile fraud? If so, the AppsFlyer fraud protection tool is worth looking into. This tool provides multi-layered protection against click fraud and has an extensive partner network to keep companies safe from emerging threats.

Price: Free with paid plans starting at 6 cents per conversion

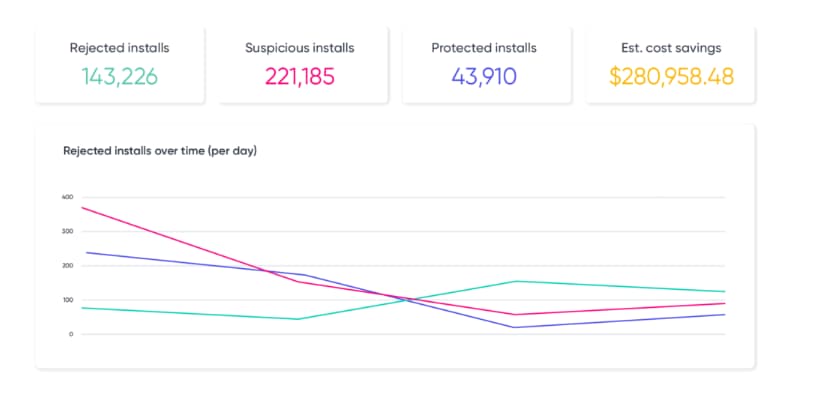
4. Singular

Singular click fraud preventionImage Source

Singular provides a comprehensive fraud prevention tool with a suite of features including iOS and Android click prevention, hyper-engagement detection, and geographic outliers to keep your ad placements safe.

Price: Free, with custom paid options available

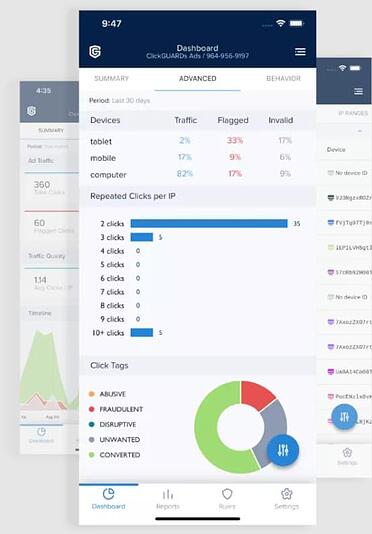
5. ClickGUARD

ClickGUARD click fraud preventionImage Source

ClickGUARD’s platform is a powerful click fraud prevention system. Offering a Google Ads shield to protect conversions and prevent invalid clicks and advanced bot detection, this tool identifies and prevents threats from targeting your ads.

Price: ActiveGUARD plan starts at $79 per month; PremiumGUARD plan starts at $79 per month; EliteGUARD plan starts at $99 per month

Unfortunately, click fraud is a very real threat to your PPC advertising campaigns. While it has the potential to drain your budget and leave you short of your marketing goals, with the right protections in place, it’s still a viable option for your business. Investing in education and services to prevent click fraud is a worthwhile expense.

Improve your website with effective technical SEO. Start by conducting this  audit.  

Categories B2B

How To Improve Your Emails With a Handwritten Signature

Email is the darling of the marketing world, and for a good reason. With 99% of email users checking their inbox every day, it’s an excellent way to connect with customers. 

However, the popularity of email marketing means you have to work harder to stand out among competitors. It’s not enough to just write great content. You have to make your emails feel personalized and look professional too. 

Create a new, on-brand email signature in just a few clicks. Get started here.  (It's free.)

We’ll show you how you can create a handwritten signature for your emails to give them an extra human touch.

Why You Need a Signature

Of the billions of emails sent and received every day, more than half of them are spam. As a professional, you want your emails to look trustworthy and credible so customers don’t discard them. 

Creating a high-quality, handwritten email signature helps you build trust with customers. You can also use the signature to reinforce your brand identity, evoke professionalism, and add a personal touch.

You can create a handwritten signature in five straightforward steps. Let’s dive in. 

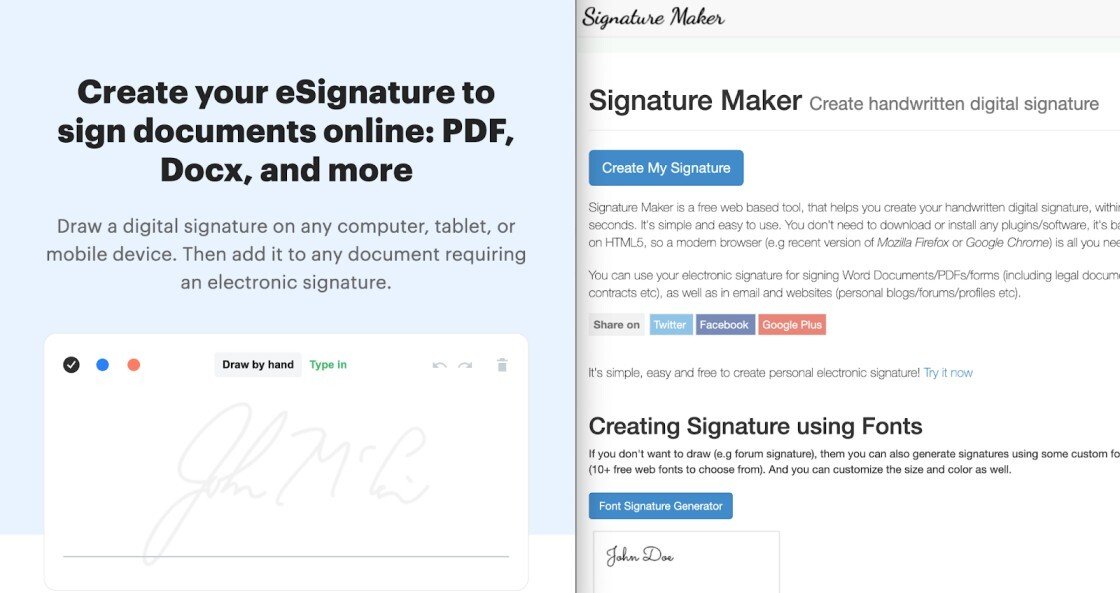
1. Go to a signature maker website.

To create a handwritten signature, you need to use an online tool. The good news is that several websites like Signature Maker and Create My Signature digitize your cursive signature for free.

If you want your signature to match your brand colors and style, look for a tool where you can customize the thickness and color of your “digital pen.”

2. Select “Create My Signature.”

Once you go to Signature Maker or another tool, select the “Create My Signature” button. 


How to Create a Handwritten SignatureImage Source

If you use another online signature maker, you might be given the option of typing or drawing your signature. Select the “draw signature” option.

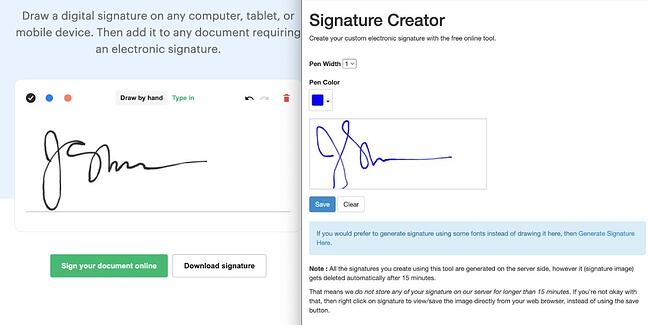
3. Specify your pen settings.

On the electronic signature maker page, you have two customization options for your pen: width and color. 

Signature Creator for Handwritten SignatureImage Source

Use the numbers to select the pen width. Higher numbers generate thicker lines. Then, you can choose a pen color. 

The tool has three categories for colors: basic, saved, and advanced. If you can’t find the right color in the basic selections, you can use the advanced tab to select your color and adjust lightness and saturation. 

In general, it’s best to use a black pen or choose a color that matches your branding. When using a color that fits your brand, ensure that it’s easy to read on a computer. 

4. Draw signature.

Once you have the settings customized to your liking, draw your own signature using your mouse. If you’re on a touch screen device, you can also use your finger or stylus pen. 

Drawing a Digital Handwritten Signature

Image Source

You can use the “Clear” button to start over if you don’t like your drawing or want to change your pen settings.

Learning how to do a signature with your mouse or trackpad can be challenging, so you can always try on a touch screen device or generate a cursive signature using handwritten fonts.

5. Save and download your handwritten signature.

When you have a handwritten signature that you’re happy with, click “Save.” You’ll then see a button that says “Download Signature.” Click the download button to save your digital signature as an image file (.png or .jpg format).

Your downloaded image will have your personal signature against a transparent background. That way, you can add it to emails and even use it to electronically sign PDF documents.

How To Add Your Handwritten Signature to Emails

Now that you have a file with the image of your signature, it’s time to add it to your emails. 

Option 1: Create an Email Signature Using a Professional Template

If you want a more professional signature with more formatting options and social media icons, you can create one using HubSpot’s free Email Signature Tool.

Before you get started, you’ll need to upload the image file with your handwritten e-signature to Dropbox or Google Docs to get the image URL.

Once that’s done, navigate to HubSpot’s Email Signature Tool, and select a template on the left-hand side. 

Use the second tab to enter your signature details, including your name, job title, and contact information. 

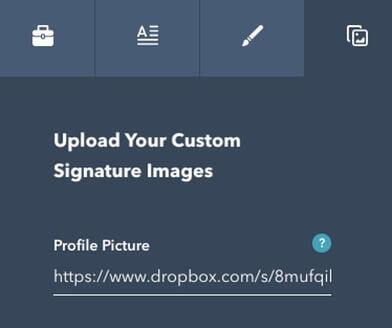
Then, navigate to the fourth tab, with the picture icons, to upload a custom image. 

HubSpot Email Signature Maker tab to upload your custom signature images.

Image Source

Go to your Dropbox image and click on “Copy URL” to get the link to your digital signature image. Paste the link under “Profile Picture” on HubSpot’s tool to add your handwritten signature.

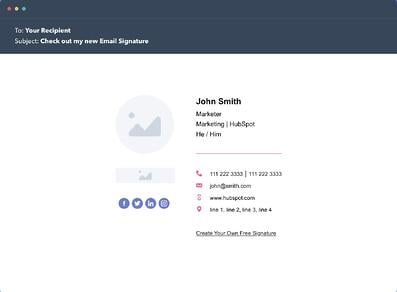
Email signature with handwritten cursive signature.

Image Source

You can use the third tab, with the paintbrush icon, to change the theme and colors of your signature to match your brand.

Once you have the perfect signature, select “Create Signature” to fill out your information and download your new email signature.

Option 2: Using Your Email Client Signature Settings

Since your signature file has a transparent background, you can upload and insert it as an image in your custom signature using your Gmail or Microsoft email settings.

Screenshot of Gmail’s email signature settings. 

Make sure you resize the image manually or use the “small” size to ensure the signature image isn’t too big. 

Final Thoughts: How To Create a Handwritten Signature for Your Emails

Email marketing is one of the best channels for reaching customers, and your competition knows it too. If you want to stand out, you have to pay attention to every element of your email, not just the content. 

Using a professional template with a handwritten signature balances professionalism and personalization in a way that helps you stand out from the crowd. 

New Call-to-action

Categories B2B

Best Structured Data Testing Tools

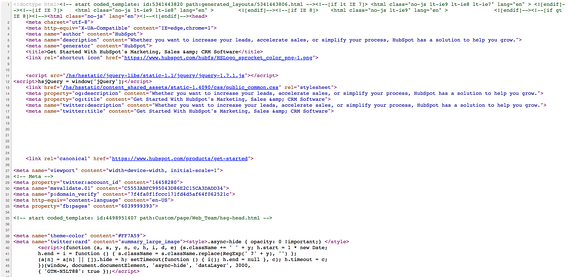
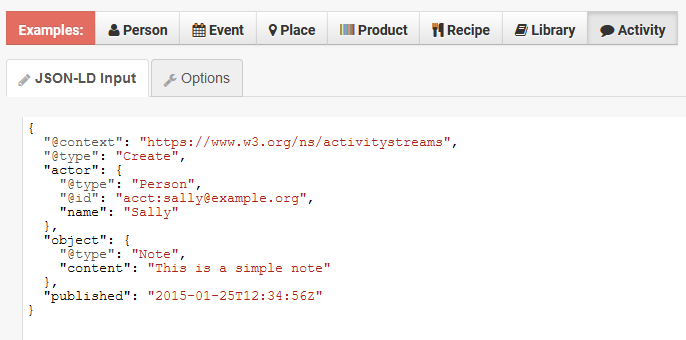
Structured data is the code on your website that explains and organizes the content on the page. The image below is an example of structured data.

example of structured data

Image Source

Structured data relates to SEO and marketing because it helps search engines understand your content and website. When your website content is optimized using structured data, you’ll gain more visibility for your site pages in SERPs.

→ Download Now: SEO Starter Pack [Free Kit]

Given its impact on SEO, you’ll want to ensure your website’s structured data is optimized. Below we’ll recommend some high-quality structured data testing tools, and explain how to fix errors you find in your testing process.

Structured Data Testing Tool Preview

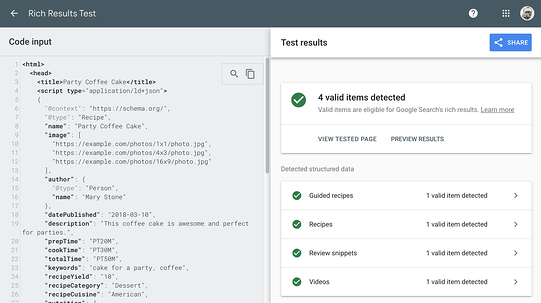
1. Rich Results Test

Google’s Rich Results Test tool analyzes the structured data on your desktop and mobile site pages to ensure it supports rich results. It specifically tests for Google SERPs special features, so it’s crucial to use if you’re optimizing your website for Google search results.

best structured data testing tool: rich results test

Image Source

To use it, simply paste a URL or code snippet and click test and the results will call out any errors and explain how to fix them.

2. JSON-LD Playground

JSON-LD Playground tests your structured data syntax against JSON standards to ensure it is correct. To use it, simply enter your structured data markup code and you’ll get a detailed report.

best structured data testing tool: json-ld

Image Source

The tool also shares example code structures for specific categories, like recipes or people, that you can use to model your structured data.

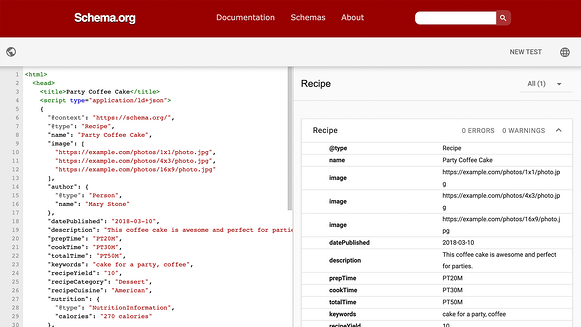
3. Schema.org

Schema.org checks the syntax of your structured data to ensure it meets standard schema markup requirements. While Google’s Rich Results Test focuses more on Google SERP features, this tool checks for all possible schema markups like, for example, the correct structure for a restaurant’s website.

best structured data testing tool: schema.org

Image Source

To use it, paste your code snippet or URL, and click Run Test. Your results will call out any errors and let you know how to fix them.

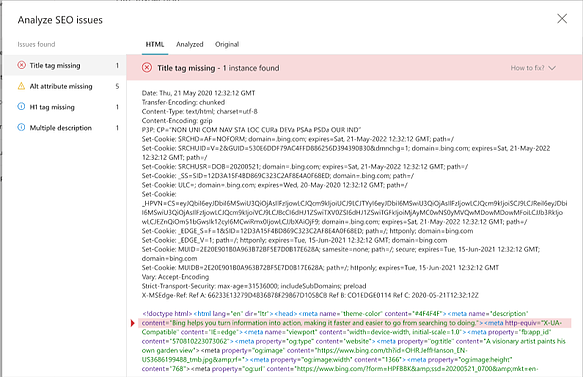
4. Bing Markup Validator

Bing’s Markup Validator analyzes your site’s structured data for markup errors and gives suggestions on how to improve. If you’re optimizing your site for Bing SERPs, this is the site to use. Hovering over any of the issues brings up a dialogue box that explains how to solve the problem.

best structured data testing tool: bing

Image Source

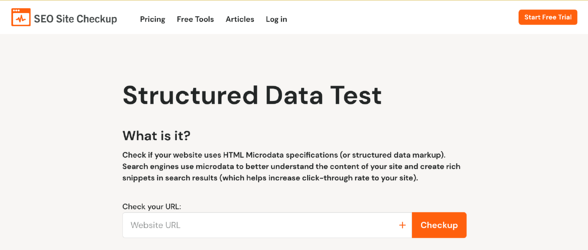
5. SEO Site Checkup

SEO Site Checkup’s Structured Data Test analyzes whether your structured data meets HTML Microdata specifications. To use the tool, simply paste the URL of the page you’re checking and run the test.

best structured data testing tool: seo site checkup

Image Source

Results call out the total number of errors, their suggested level of priority for fixing them, and links to guides that help you fix the issues.

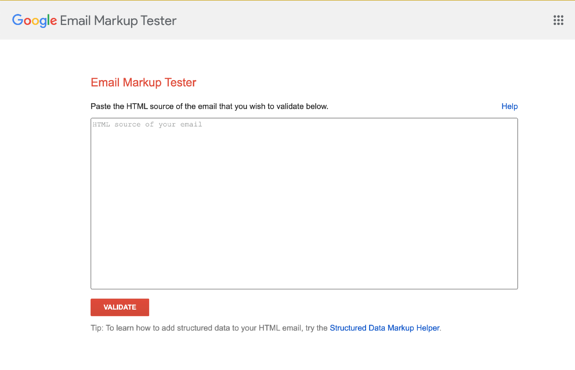
6. Email Markup Tester

Google’s Email Markup Tester analyzes your email’s HTML to verify if it meets standard specifications. To use it, simply paste your code into the text box and click validate. If there are any errors, the tool will call them out for you to fix.

best structured data testing tool: google email markup

Image Source

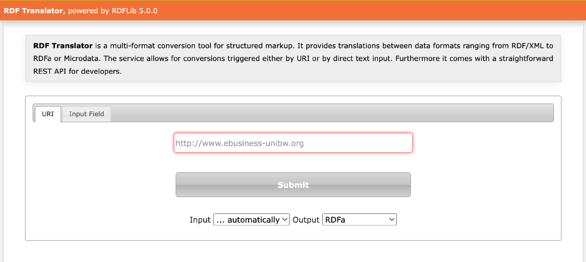
7. RDF Translator

RDF Translator validates different types of structured data formats to ensure your site is set up correctly. To check your code, simply paste your site URL or code snippet and click submit.

best structured data testing tool: rdf translator

Image Source

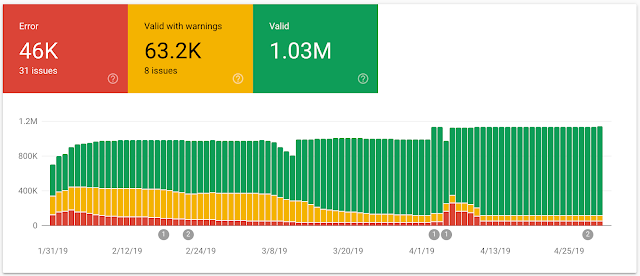
8. Search Console Structured Data Report

Search Console Structured Data Report gives you an overview of your structured data that includes the total number of valid elements, valid elements with warnings, and errors. If you click on the report rows that contain errors, the tool tells you exactly what the error is so you can tackle the issue.

best structured data testing tool: google search console

Image Source

Structured Data Generator

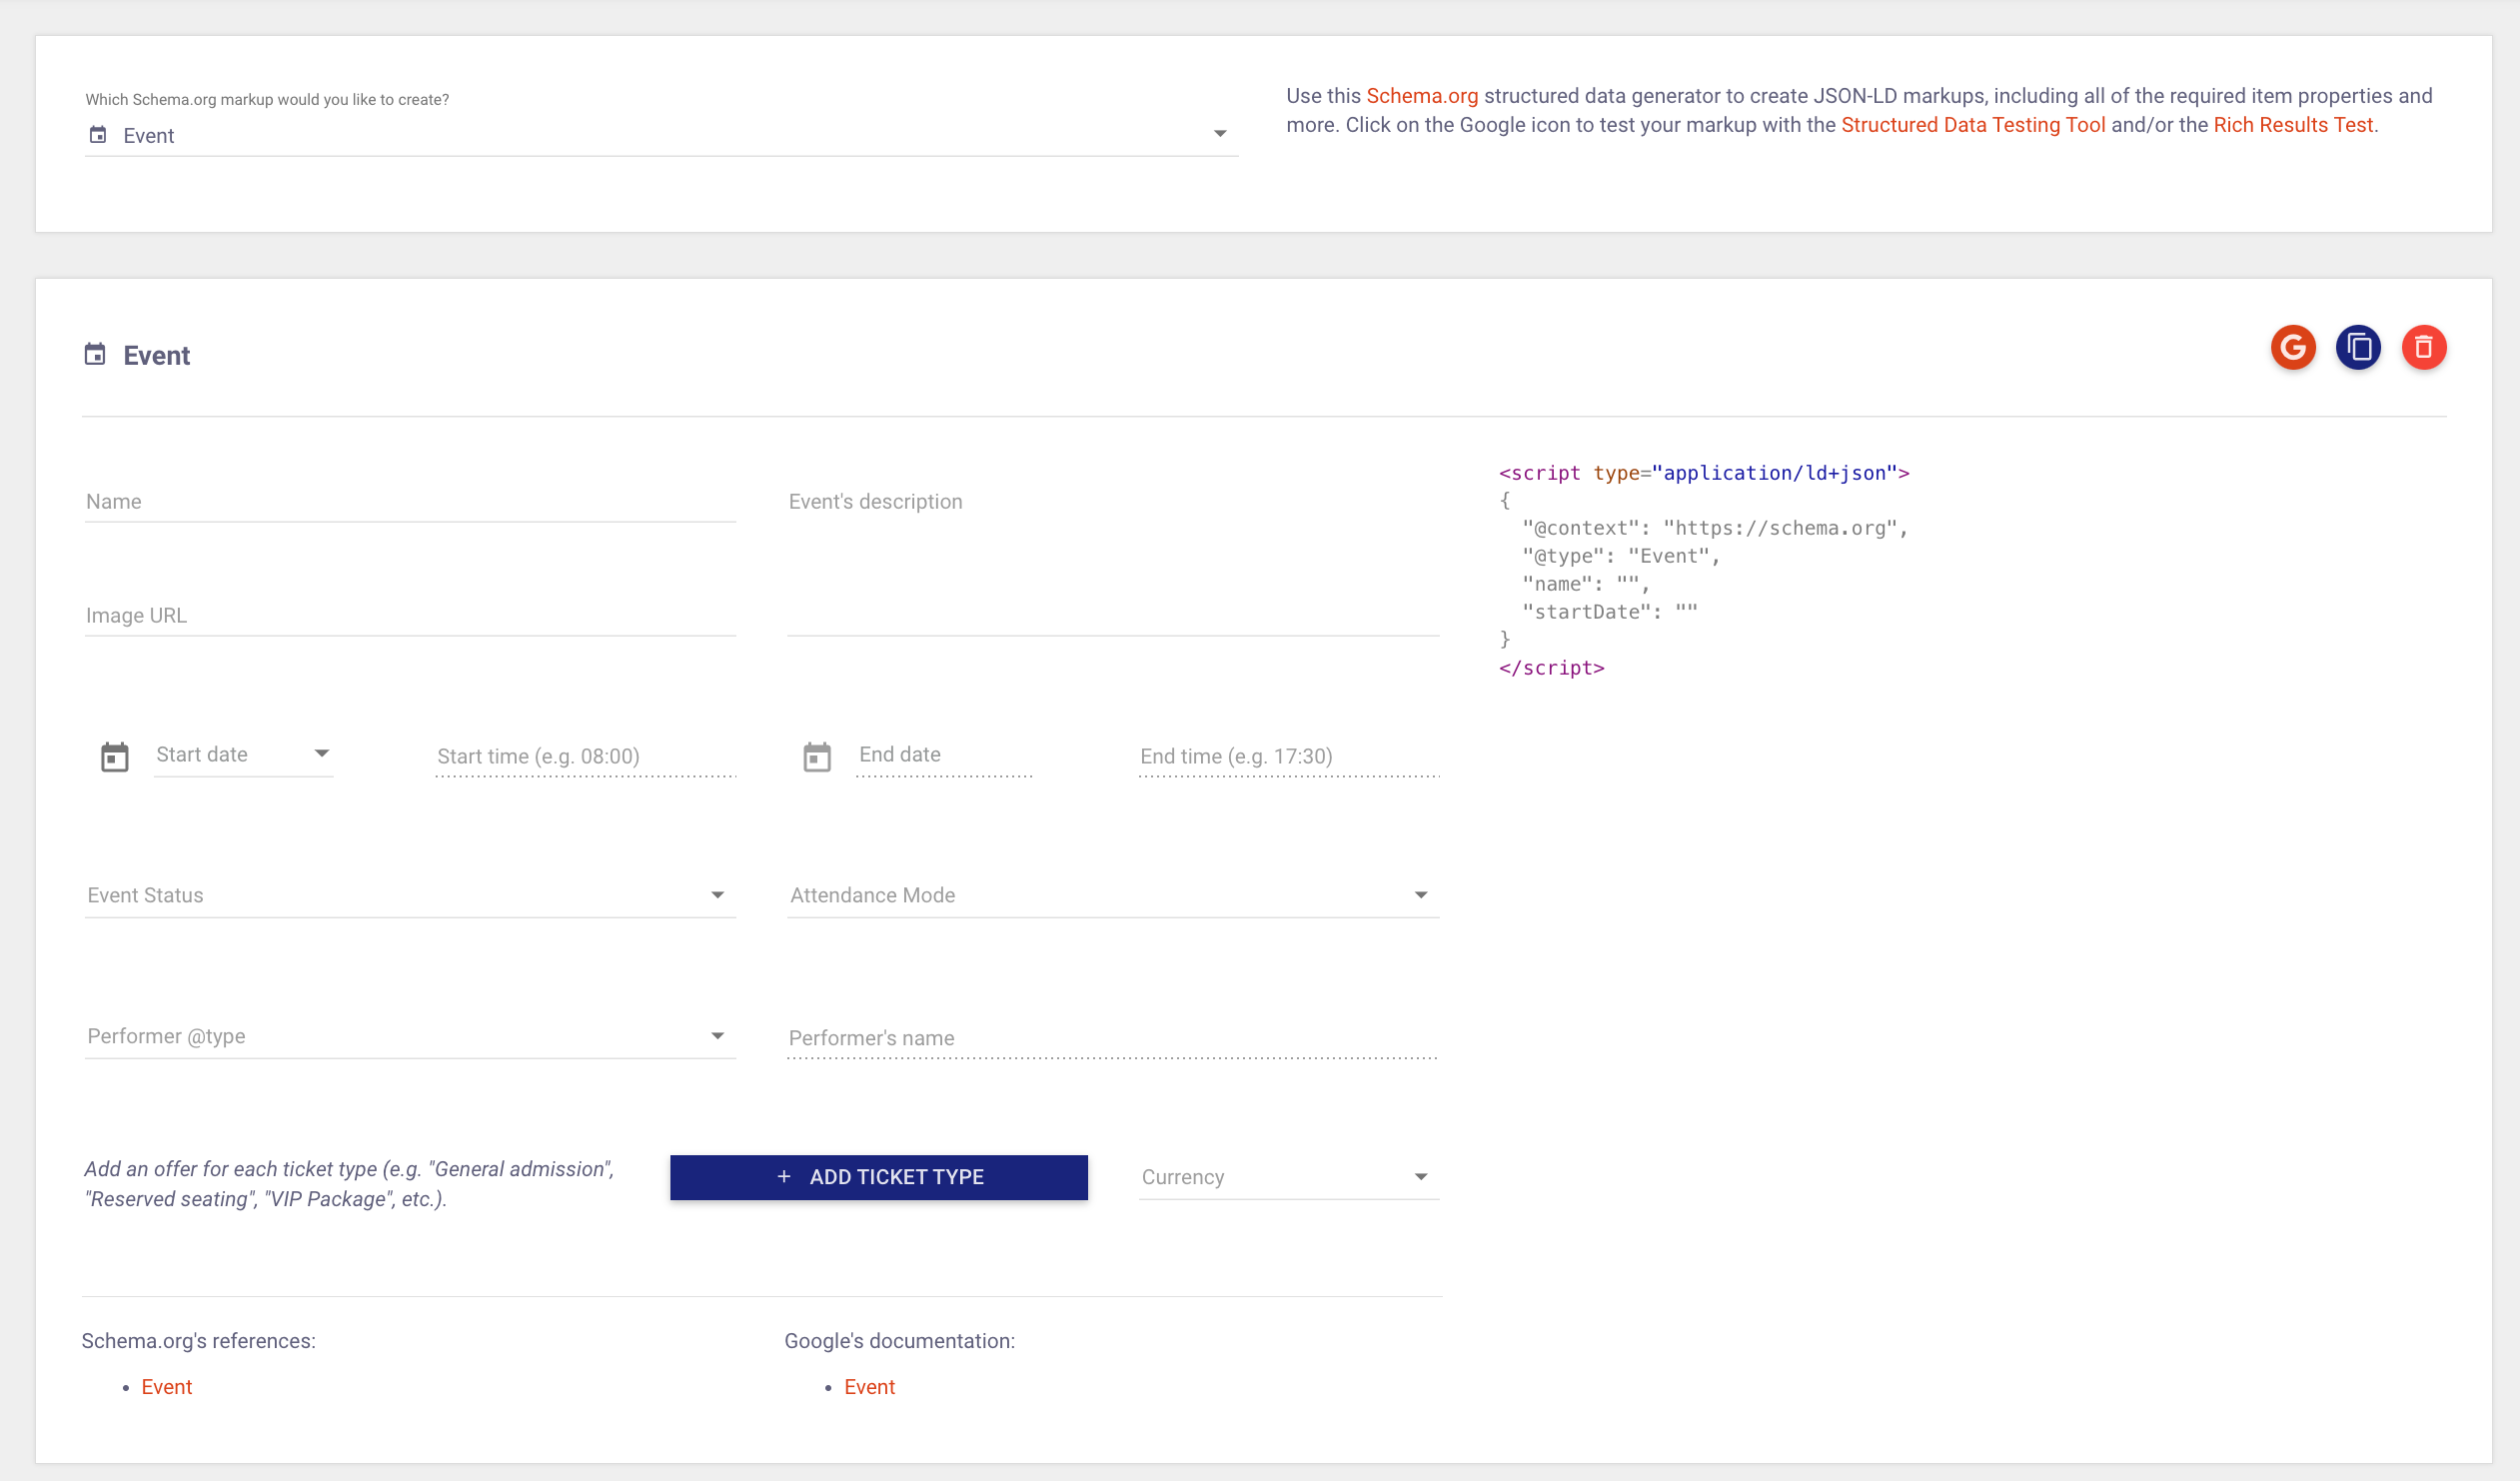
9. Markle’s Schema Markup Generator

Merkle’s Schema Markup Generator helps you generate accurate structured data for your website and website pages. You can create schema markups for articles, events, FAQ pages, etc., that are correctly formatted, ensuring your website is fit to appear in SERPs.

best structured data testing tool: merkle

Image Source

Simply select the schema you need, input your information, and copy and paste the code on your site.

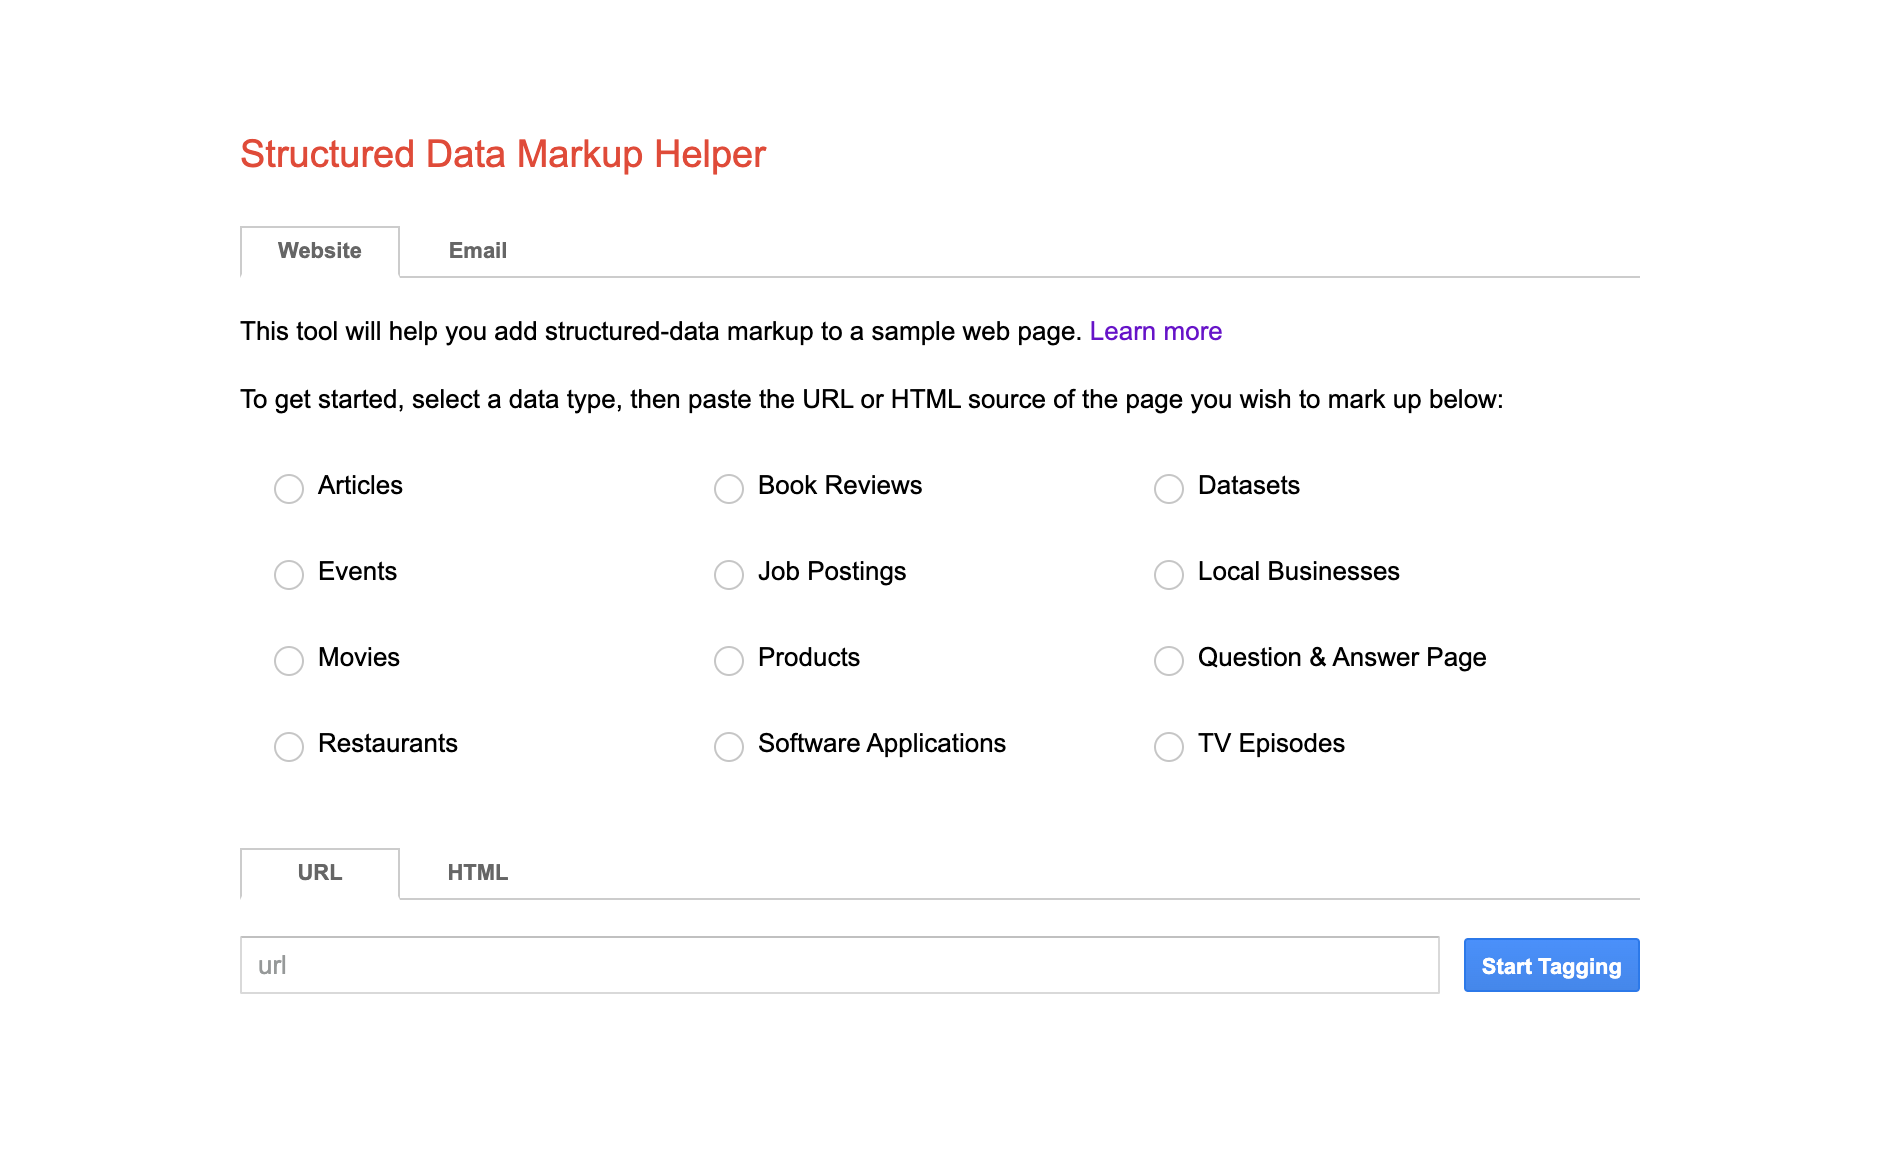
10. Structured Data Markup Helper

The Structured Data Markup Helper helps you create structured data that meets Google’s standards. You simply paste your URL to your website or your email HTML, select the type of data you’re inputting (i.e, a job posting) and click Start Tagging.

best structured data testing tool: google structured data markup helper

Image Source

The tool then gives you your structured data using the correct tags that will surface your content in SERPs.

How to Fix Errors Found With a Testing Tool

If you get errors when testing your structured data, fixing them is crucial to ensuring your site shows up in SERPs. Many structured testing tools give suggestions on how to remove the errors in your structured data, and below we’ll go over some critical steps to remember.

1. Fill in missing fields.

Some of the most common errors you may see are missing fields. This usually means that you have an element in your structured data that doesn’t have a corresponding field that explains what the data is. For example, if you’re missing a publish date in the structured data for a news article, you may see:

Missing:date published

You can simply fix this error by entering the publish date.

2. Prioritize those with the most errors.

After testing your structured data, your tool may call attention to the data types that contain the most errors. You’ll want to fix these first, as errors in these may be contributing to subsequent errors that will resolve themselves once these are fixed.

3. Fix manual actions.

Manual actions are when a human reviewer determines that pages on your site aren’t compliant with Google’s webmaster guidelines. For example, a page on your site uses the standard review markup but doesn’t include any reviews. You’ll want to address these errors immediately because manual actions can significantly impact your site rankings.

Structured Data Helps Your Site SEO

You should consider testing and validating your website’s structured data as a critical component of your SEO process, as it has a significant impact on your site appearing in search results. Leverage the structured data testing tools in this list to ensure your structured data meets standards.

marketing

Categories B2B

Why CRM and Marketing Automation Need Each Other

Turning prospects into loyal customers is a multi-step process requiring the combined efforts of cross-functional teams. Thankfully, there are different types of technologies available to make the task more organized and easy — like customer relationship management software (CRM) and marketing automation.

But it’s not just about how much easier it makes your job. When the two software work together, it can become a more streamlined process that can potentially convert more prospects into qualified leads quicker and more effectively.

And more businesses are seeing the value in integrating the two. In fact, 52% of marketers prioritize implementing marketing automation platforms that can integrate into other solutions to enhance their marketing efforts.

In this post, we’ll review what marketing automation and CRM software do, and why they need each other to better help your business.

Download Now: Free RFP Templates

CRM and Marketing Automation

Before we dive into why marketing automation and CRM should be integrated, we need to understand their specific functions.

What is marketing automation software?

Marketing automation software helps marketers promote and streamline content without manual application. This includes automating the distribution of content and reporting analytics derived from how prospects interact with it. It pulls data from when leads visit your website, open an email, fill out a form, or read a blog, and makes the data easily accessible for the business to build its strategy.

Ultimately, the goal is to streamline the process of taking a lead, nurturing them, and moving them to a sales-qualified lead. Essentially, it’s all about lead generation and personalization.

Some of the best marketing automation software include HubSpot, MailChimp, and Marketo.

What is customer relationship management software?

On the other hand, customer relationship management (CRM) is software for sales and service teams to manage their pipeline and lead qualification processes. It historically tracks customer data, including dates and notes of phone conversations, past purchase records, and email interactions as they proceed through the buyer’s journey.

Essentially, with this software, your salesperson can see the full picture of who a prospect is, their history with your company, and their journey to becoming a customer.

Best CRM for Marketing Automation

HubSpot is one of the best choices for CRM marketing automation tools because the HubSpot Marketing Hub includes the foundational CRM functionalities, so you have both software in one.

And for seamless CRM integration, users can manage both their sales and marketing strategies in the HubSpot Marketing Hub and advanced Sales Hub together for more sophisticated features in marketing automation and CRM.

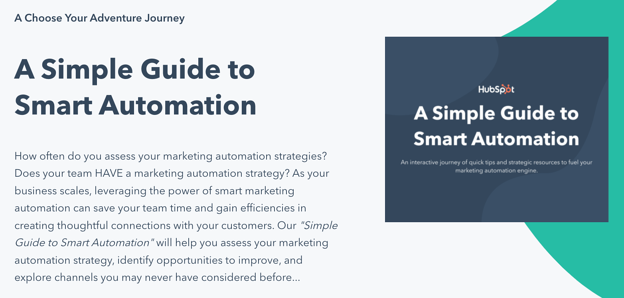
If you’re interested in using HubSpot for your marketing automation needs, but need some guidance on assessing your marketing automation strategy, use our Simple Guide to Smart Automation.

a simple guide to smart automation to assess marketing automation strategies

Download for Free

Now that we’ve discussed what each software does and how they can help your team, we can address the big question, “Why do these need to work together?”

CRM and Marketing Automation: Why You Need Both

When marketing automation and CRM software work together, they provide a seamless journey for your customers as they go from visitor to customer. Integrating the two software will give your sales reps the full picture of a prospect’s interaction with your company. Your sales rep will know the marketing history of their prospects.

Let’s go through a tangible example of how the two software can work together.

Example of Marketing Automation and CRM Integration

To start, let’s say a marketer attracts a lead through a blog post, much like this one.

Perhaps they found the content insightful and decided to download a lead magnet and fill out a form. Once that happens, the marketing team starts nurturing the lead through an email marketing campaign.

These actions evolve this reader into a marketing-qualified lead (MQL). After a while of engaging with more content, when the lead requests a demo of the product, they then turn into a sales-qualified lead (SQL). Once this happens, the sales rep who’s responsible for the demo goes to the marketing automation and CRM software to gather information on their interactions with the company.

Sales can then look through what offers the prospect has downloaded, what blogs they’ve read, who they are, and what company they work for and use it in their strategy for the demo call. So now they’re prepared to answer the right questions and personalize the sales call to better connect with the qualified lead and nurture them into a sale.

So we’ve taken the prospect all the way through the funnel, and now they’ve made the purchase. Keep reading to see how CRM and marketing automation contributes to that success.

Benefits of Integrating Your CRM with Marketing Automation

Building off of the progression of the example, the integration of CRM and marketing automation software has the ability to:

Offer Better Visibility to Marketing and Sales Teams

This allows both teams to know where they are in the process and what their next actions should be in the future.

Shorten the Sales Process

Without marketing automation used in conjunction with CRM, it potentially takes a much longer time to source leads. Both software makes the process of taking prospects through the sales funnel with

Provide Consistent Messaging

The marketing and sales professionals that affect the customer’s experience can be aligned when engaging in client-facing communication. It’s not as much of a challenge to provide consistent messaging when you have all the contextual information available in cross-functional software.

Unify Your Data Management

With the software already working together, salespersons don’t have to go out of their way to request customer profile information and instead were readily able to prepare to sell based on unified data management.

Enhance Pipeline Management

Both teams in the process have a process that involves observing and tracking the step-by-step progression of a lead.

Minimize Human Error

If you might have an outdated system or process in place for lead tracking, it’s probably a manual process that comes with human error and prospects slipping through the cracks. You can’t scale a system like that.

Your marketing automation and CRM should be connected so your sales team has the right tools to close a deal.

Combine Your CRM and Marketing Automation Efforts

Integrating these systems should help you understand the gaps and friction points in your marketing and sales process. It can help you discover why leads aren’t moving from MQL to SQL or why prospects aren’t closing. CRM and marketing automation can make your marketing team, sales team, and customers happier by streamlining the marketing and sales process.

Editor’s note: This post was originally published March 2020 and has been updated for comprehensiveness.

rfp templates

Categories B2B

The Ultimate Guide to Google Data Studio in 2020

Having the ability to visualize data helps you unlock invaluable insights for better decision-making in your business and gives you a serious advantage when it comes to getting competitive opportunities.

While many tools can help you visualize data, none compare to Google Data Studio, which is entirely free and accessible to all (even if you don’t have any data of your own!). Like most Google tools, Data Studio can be hard to master, but it’s well worth it. Once you’ve gotten comfortable with its features, you can use it to create stunning and informative reports for your clients, coworkers, or leadership team.

This guide will walk you through the most useful Data Studio tools. We’ll start with the basics before moving into the intermediate features. Finally, we’ll go over the advanced options.

→ Download Now: SEO Starter Pack [Free Kit]

1. Log into Data Studio

To log in to Data Studio, you’ll need a Google account — I recommend using the same one as your Analytics, Search Console, and/or Google Ads account.

You’ll land on the Data Studio overview page. Click the “Home” tab to view your dashboard.

2. Explore the Data Studio Dashboard

how to use google data studio: explore dashboardIf you’ve used Google Docs, Sheets, or Drive before, this dashboard should look pretty familiar.

Reports

Here’s where you can access all of your reports (equivalent to a workbook in Tableau or Excel).

Notice that you can filter by who owns the report:

how to use google data studio: access reports

Data Sources

Data sources list all the connections you’ve created between Data Studio and your original data sources.

Data Studio currently supports 500+ data sources. Below are the most popular sources:

If you’re using Google Analytics and/or Search Console (which I highly recommend), you’ll need to individually connect each view and property, respectively.

So if you have three GA views for three different subdomains, you’ll need to set up three separate data sources.

Explorer

Explorer is an experimental tool that lets you experiment or tweak a chart without modifying your report itself.

For instance, let’s say you’ve created a table in Data Studio that shows the top landing pages by conversion rate. While looking at this table, you think, “Huh, I wonder what I’d find if I added average page load time.”

You don’t want to edit the chart in the report, so you export it into Labs — where you can tweak it to your heart’s content. If you decide the new chart is valuable, it’s easy to export it back into the report. (Jump to the section where I explain how.)

Report Gallery

The report gallery is a collection of templates and examples you can use depending on your business needs.
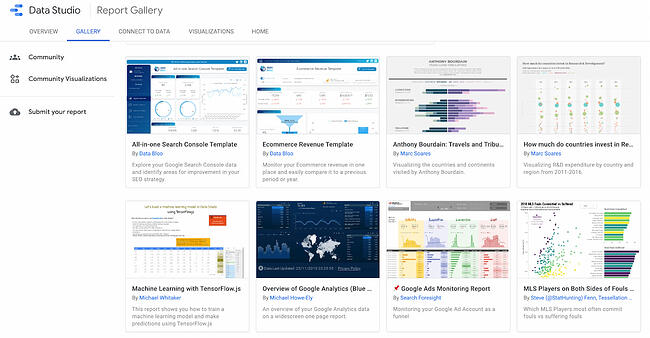
how to use google data studio: explore report gallery

For instance, if you run an ecommerce store, the ecommerce revenue template would be very useful.

Connect to Data

And here’s where you add data sources. (You can also add sources within a report itself.) Let’s add our first source.

How to Connect Data Sources to Google Data Studio

Here’s a step-by-step guide on how to connect data sources to Google Data Studio.

1. Start with Analytics or Search Console.
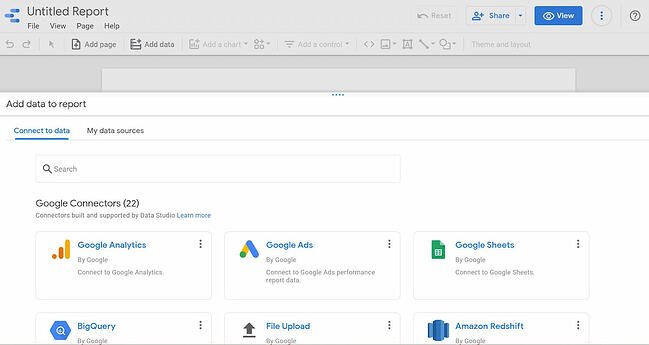
how to connect data sources to google data studio: analytics

In this example, I’ll connect Analytics — however, the process is nearly identical for other sources.

If you want to follow along exactly with what I’m doing, connect the Google Analytics Demo Account for the Google Merchandise Store.

You’ll be prompted to authorize the connection. Once you’ve done that, you’ll need to select an account, property, and view.

how to connect data sources to google data studio:  select property

You’ll be presented with something like the view below: a list of every field in your Analytics account (both the standard ones and the ones you’ve added).
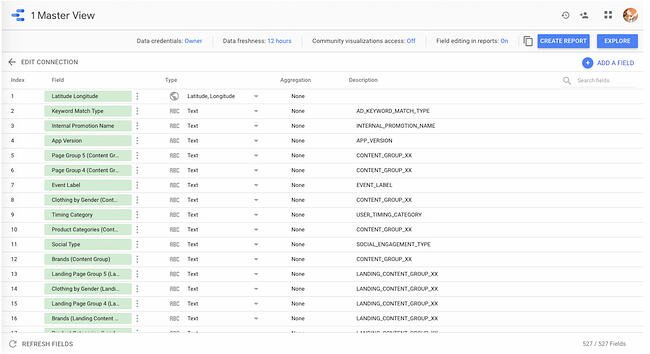
how to connect data sources to google data studio: fields

Does this feel overwhelming? Yep, same here.

We could do a lot in this step — add new fields, duplicate existing ones, turn them off, change field values, etc. But, of course, we could also do all those things in the report itself, and it’s much easier there. So let’s do that.

2. Click “Create Report” in the upper right.

Data Studio will ask if you want to add a new data source to the report; yes, you do.
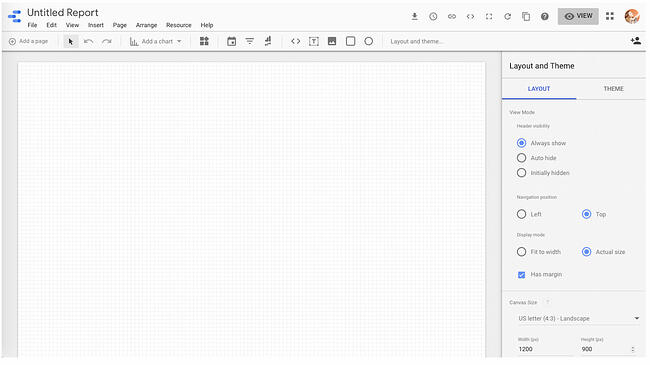
how to connect data sources to google data studio: create reportHere’s what you’ll see. It’s pretty spartan, but not for long!

3. Click “Add a chart” in the toolbar.

It’s time to add your very first chart. The good news is that data Studio makes it easy to compare chart types with some handy illustrations.
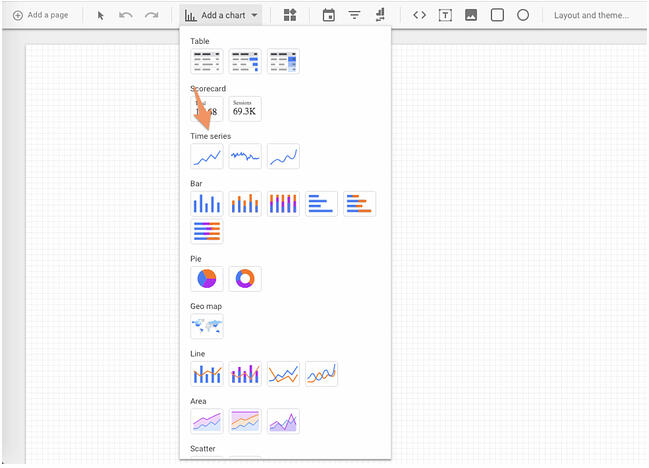
how to connect data sources to google data studio: add chart

4. Choose the first option under “Time series.”

For the purpose of this tutorial, we’ll start with a “Time series” chart. This chart type shows change over time. Once it appears on your report, the right-hand pane will change. Here’s what you should see:
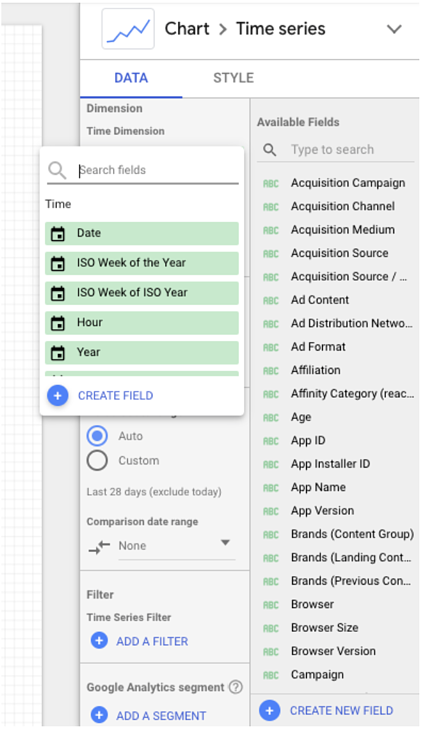
how to connect data sources to google data studio: time series

By default, the dimension is “Date”; you can change this to any of the time-based dimensions, including “Year,” “Hour,” etc.

I will stick with “Date” because the Demo Account doesn’t have a lot of historical data.

Data Studio will automatically select a metric (i.e., what’s displayed on the Y-axis) for you. Feel free to change this; for instance, it defaulted to “Pageviews” for me, but I’d rather see “Revenue per user.”
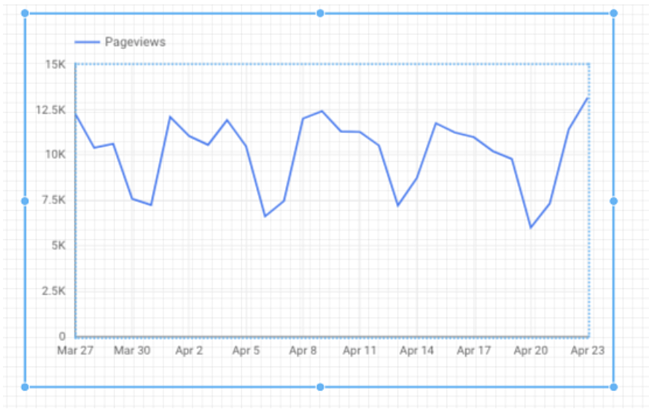
how to connect data sources to google data studio: chart example

5. Add another metric.

First, make sure you’ve selected the chart, so you see the pane on the right:
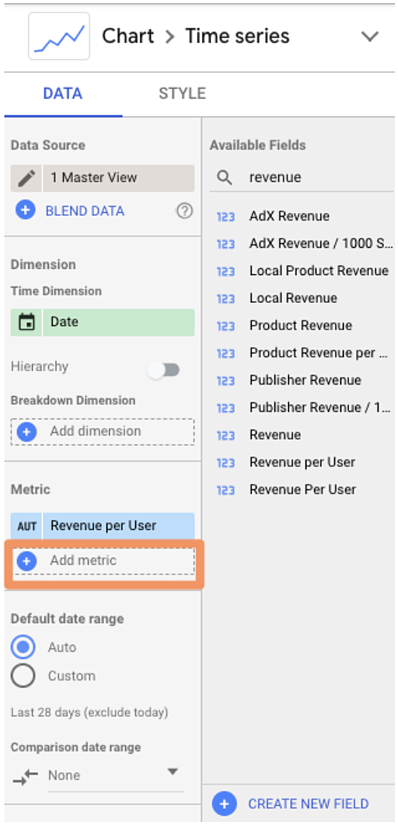
how to connect data sources to google data studio: add metric

You have two options for adding a metric (or dimension).

You can click the blue plus-sign icon — which will bring up a search box so you can find the field you want — or you can drag a field from the right into the metric section.

To delete a metric, simply hover over it with your mouse and click the white “x” that appears.

6. To add a table, choose the third option under “Add a chart.”
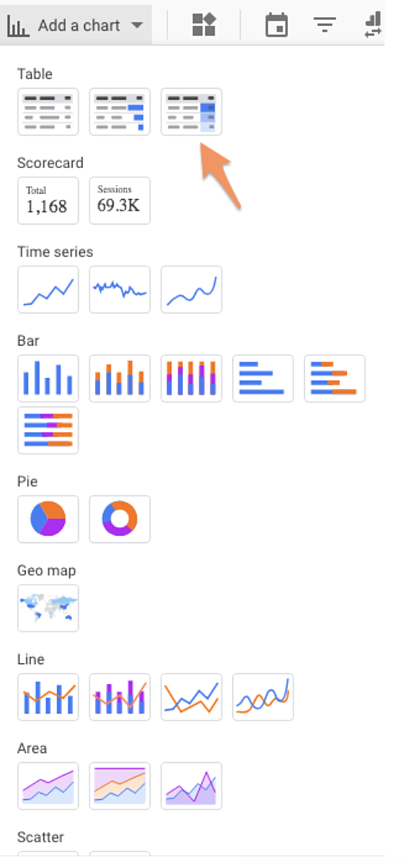
how to connect data sources to google data studio: add table

My chart defaults to Medium (for dimension) and Pageviews (for metric), so I change it to Product and Unique Purchases.

And I think this table’s formatting could use some work.

Change the “Rows per page” from 100 to 20 (much easier to read) and check the box for adding a Summary row.
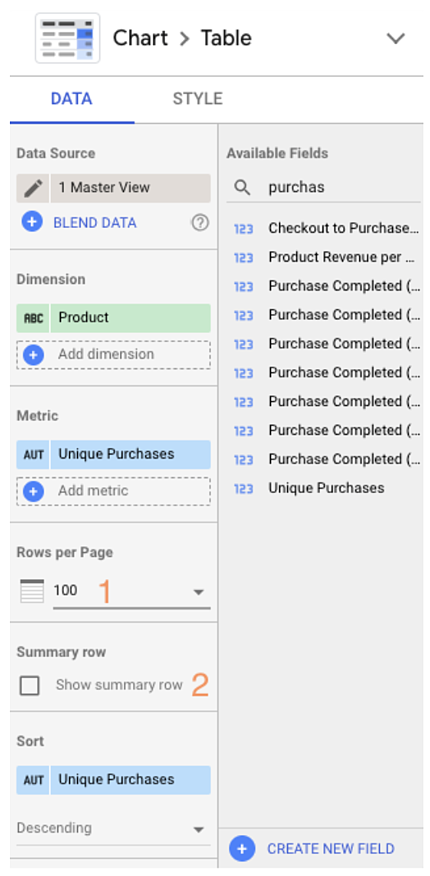
how to connect data sources to google data studio: rows

7. Finally, click “Style” to go to the style tab.

Scroll down and select “Add border shadow.” This is one of my favorite ways to make a data visualization pop off the page.
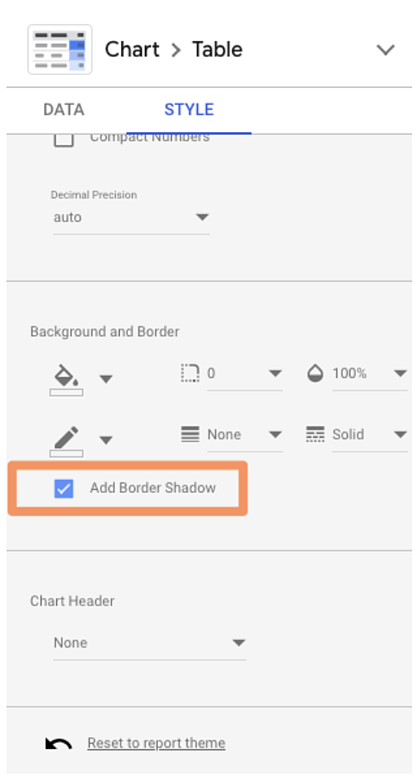
how to connect data sources to google data studio: add style

8. To see the finished product, click “View” in the top corner.

This transitions you from Editor to Viewer mode.

Voila!
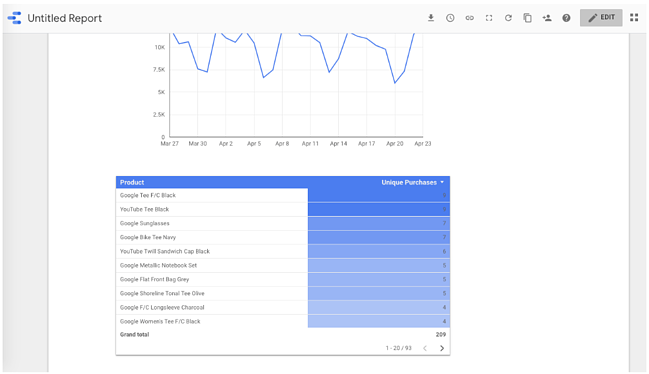
how to connect data sources to google data studio: finished product

9. Click “Edit” to finish up and name the report.

Double-click the title (right now, it’s “Untitled Report”) to change it.

how to connect data sources to google data studio: report name

And with that, the first report is officially done. Click that familiar icon above the Chart Editor and add some email addresses to share your report.

Okay, don’t share the report just yet because I’m about to reveal the secrets that’ll help you seriously upgrade it.

Google Data Studio Tutorial

  1. Use templates.
  2. Publish your report.
  3. Connect to 150+ sources.
  4. Create your own report theme.
  5. Embed external content.
  6. Send scheduled reports.
  7. Download reports.
  8. Embed reports.
  9. Add a date range.
  10. Add filter controls.
  11. Create interactive chart filters.
  12. Add data control.
  13. Add a dimension breakdown.
  14. Use Data Studio Explorer (Labs).
  15. Create report-level filters.
  16. Create blended fields.
  17. Blend your data source with itself.
  18. Create a basic calculated field.
  19. Creating an advanced calculated field.
  20. Create a calculated blended field.

Beginner Google Data Studio Tips

1. Use templates.

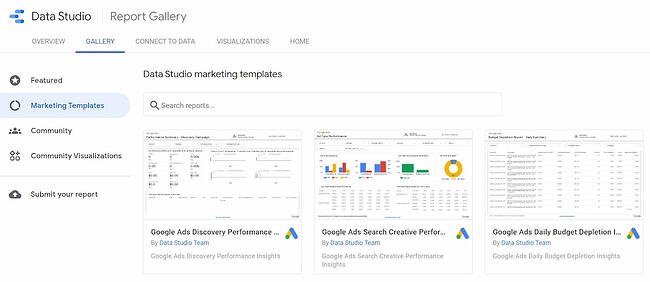
There’s no need to reinvent the wheel. If you’re not sure where to start with Data Studio, I recommend browsing through their templates for inspiration.
google data studio tips: use template

Pay attention to the report’s creator. Many templates were built by the Data Studio team; you can find them all in the “Marketing Templates” section. But there are also 45+ user submissions located in the “Community” section. A few of my favorite templates:

  • GA Behavior Overview: This dashboard pulls out the most relevant information from the Behavior section of Google Analytics
  • Paid Channels Mix Report: Use this template to understand how your ads are performing on Facebook, Twitter, LinkedIn, search, and more.
  • Website Technical Performance Indicators: Get a quick overview of how your site is performing in real-time, including JavaScript and 404 errors and page load times.

There are also a bunch of fun, non-marketing templates in the gallery (found in the “Featured” section), like F1: How Important Is the First Race? and Star Wars: Data from a galaxy far, far away. Definitely take a look if you’re curious to see the full potential of GSD unleashed.

2. Publish your report.

Want to show off your superior analytics and data visualization skills to the world? Submit your report to this gallery using this Google form.

Read over the full instructions at this link, but here’s what I’d keep in mind:

  • Don’t share sensitive information. I recommend creating a report with publicly accessible data, so there’s absolutely no chance you get in trouble for sharing data you don’t own. (Pro tip: recreate one of your existing company reports with dummy data from one of Google’s sample data sets!)
  • Make it awesome. The public reports are impressive, so don’t hold back with design, features, and so on.
  • Add context. Provide on-page explanations of what you’re measuring or monitoring with captions, instructions, maybe even a video of you walking through the report.

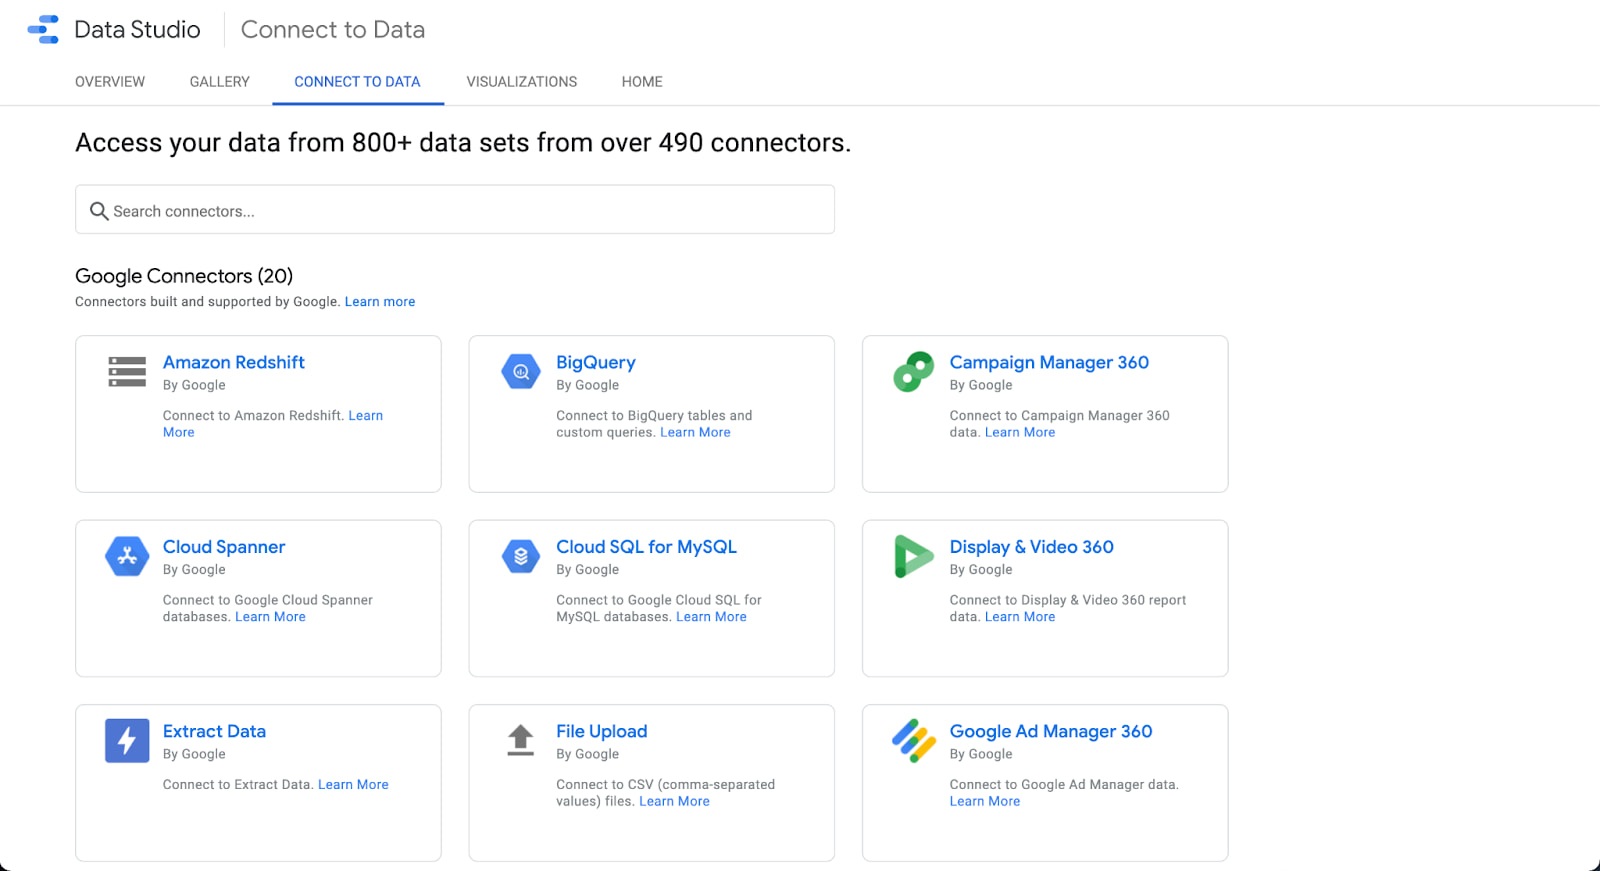
3. Connect to 150+ data sources.

As I mentioned, you can bring data from Google-owned sources into Data Studio, including Search Console, Google Ads, YouTube, and Campaign Manager.

But that’s just the tip of the iceberg. There are also more than 120 partner connectors — essentially, third-party bridges between Data Studio and platforms like Adobe Analytics, AdRoll, Asana, Amazon Ads, and AdStage (and that’s just the As).

Check out all the options here.
google data studio tips: connect to sources

4. Create your own report theme.

Whether your report is meant for internal stakeholders, like the leadership team, or external ones, like clients, it’ll be more effective if it looks good.

To adjust the report’s style and formatting, click the Layout and theme option in the toolbar.

Any changes here will apply across the report—meaning you only need to pick fonts, colors, etc., once versus every time, you add a new module to the report.

google data studio tips: create theme button

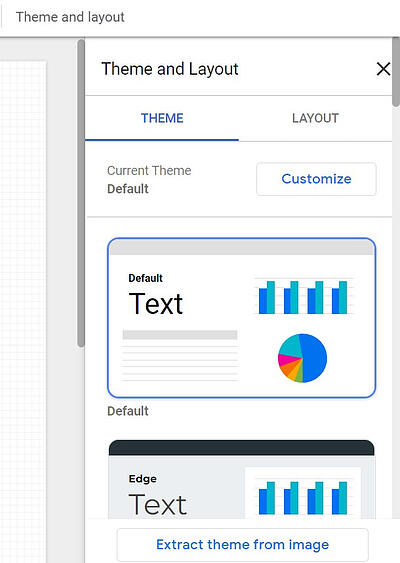
Data Studio comes with two built-in themes: simple and simple dark. But it’s easy to create your own — and the results are way more impressive.
google data studio tips: theme options

Click on “Customize.”

Use your brand style guide to choose primary and secondary colors, fonts, and text color. You might need to get creative here; HubSpot uses Avenir Next, which Data Studio doesn’t offer, so I went with its cousin Raleway.

If you’re creating a report for a client and don’t know their hex codes, Seer Interactive’s Michelle Noonan has an excellent tip: use a free color picker tool to identify what they’re using on their website.

You can also create a custom chart palette in this tab and edit the border and background settings.

5. Embed external content.

Just like you can bring your report to the wider world, you can also bring the wider world to your report.

You can insert Google Docs, Google Sheets, YouTube videos, and even live webpages with the URL embed feature. Embedded content is interactive, so it’s far more powerful than a screenshot.

Click “URL embed.” in the navigation bar to add content.

google data studio tips: add embed content

From there, simply paste the URL. Next, you may need to resize the box that appears to fit your content’s entire length and width.

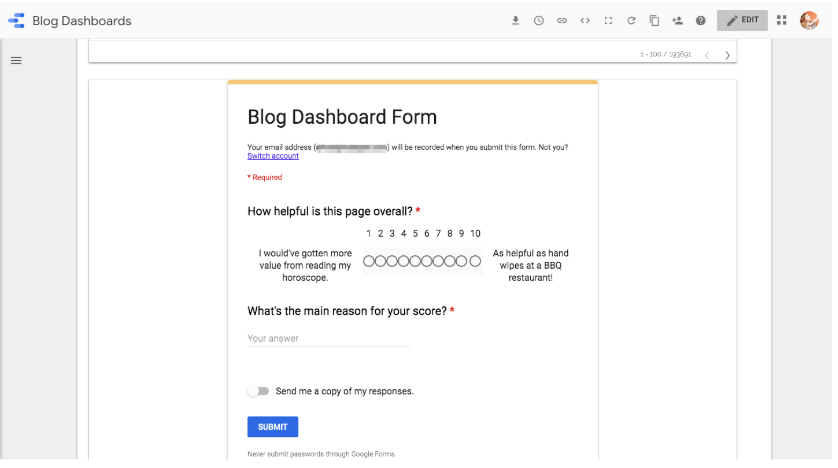
The options here are pretty endless. One of my favorite ways to use this feature is to embed a Google Form gauging how helpful the report was for my audience:
google data studio tips: embed content example

If a section of the report needs extra context (or my viewers aren’t that technical), I’ll add a short video explaining what they’re looking at and how to interpret the results.

To personalize a report for a client, I’ll add the URL of their website, blog, and/or whatever pages they hired me to create or improve.

And for the HubSpot blogging team, I’ll add the latest version of the Search Insights Report so they can compare our progress to the results.

6. Send scheduled reports.

If you have a group of stakeholders that need to see your report regularly, consider using Data Studio’s “scheduled report” feature.

Click on the drop-down menu beside the “Share” button and select “Schedule email delivery.”
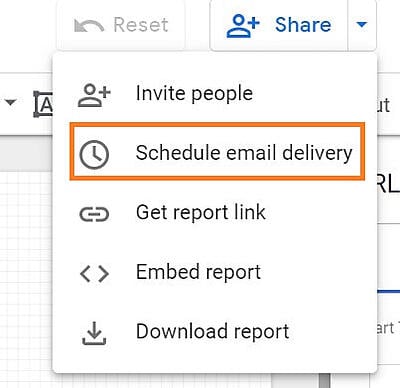
google data studio tips: schedule email delivery

First, enter your recipients’ email addresses, then choose a schedule, whether daily, every Monday, or every month.

This is particularly handy when working with customers, since you may not want to give them access to the live report.

7. Download the report as a PDF.

Alternatively, you can download your report as a PDF. This is helpful for one-off situations, like if your boss asks for a status report or your client wants to know how an ad has performed so far this month.

To download the file, click “download” on the drop-down menu.
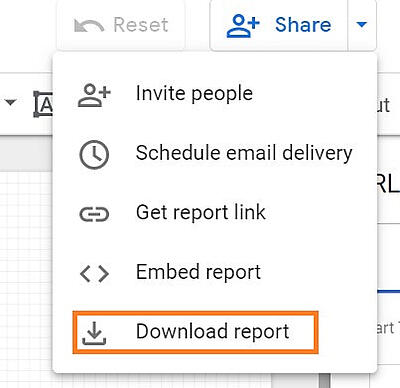
google data studio tips: download reportData Studio gives the option of downloading your current page or the entire report. You can even add a link back to the report so your audience can dig in deeper if they’d like and add password protection to ensure your data stays safe.
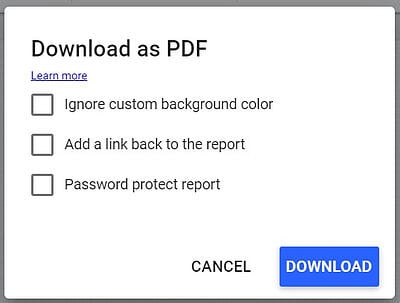
google data studio tips: pdf download options

8. Embed reports.

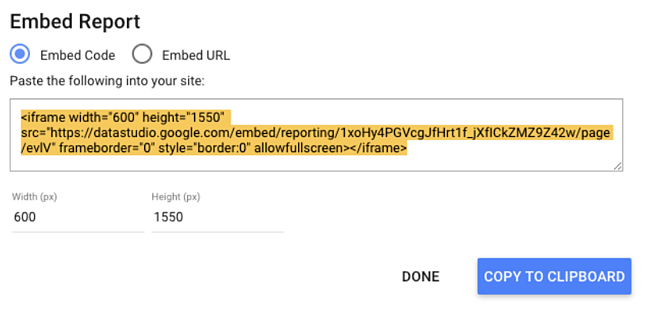
You can even display your report on your company website or personal portfolio—which can be a great way to highlight the results you’ve gotten for a client or project.

Click the brackets icon in the upper navigation bar.

google data studio tips: embed report button

This box will pop up:

google data studio tips: embed reports

Adjust the width and the height as needed, and you’re good to go.

Intermediate Google Data Studio Tips

9. Add a date range.

Give your viewers more freedom by letting them select which dates they’d like to see information for.

For example, my reports always default to the last 30 days, but if one of HubSpot’s blog editors wants to see how their property performed in the previous calendar month, the date range controls let them adjust the report.

They can choose from predefined options, like “yesterday,” “last seven days,” “year to date,” etc., or pick a custom period.

To enable this, first navigate to the page you want to give users date control. Next, click on the drop-down menu by “Add a control.” Next, click “Date range” from the toolbar.
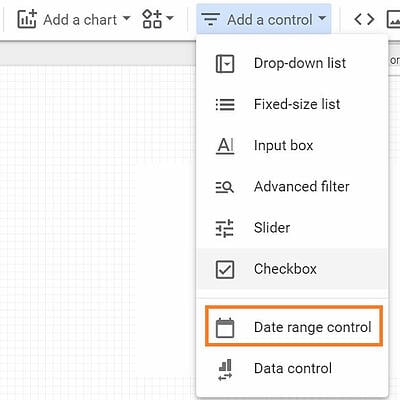
google data studio tips: date range control

A box will appear on your report. Drag it into the position you want — I recommend somewhere in the upper right or left corner, so your audience sees it first — and adjust the size if necessary.
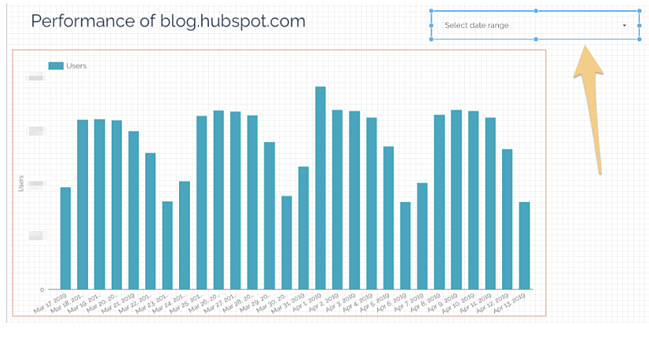
google data studio tips: date range exampleClicking this module will bring up a panel to the left of your report called Date Range Properties. Set the default date range to “Auto date range,” if it isn’t already.
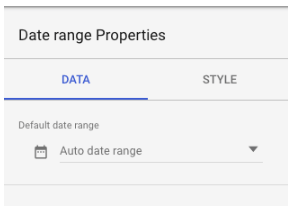
google data studio tips: date range properties

If your viewers select a date range using the date range widget, every report on the page will automatically update to that period.

There are two ways to override this:

  • Set a time period within a specific chart. That time period will always supersede the date range control.
  • Group the charts you want to be affected by the date range control with the module. Select the chart(s) and the box, then choose Arrange > Group.
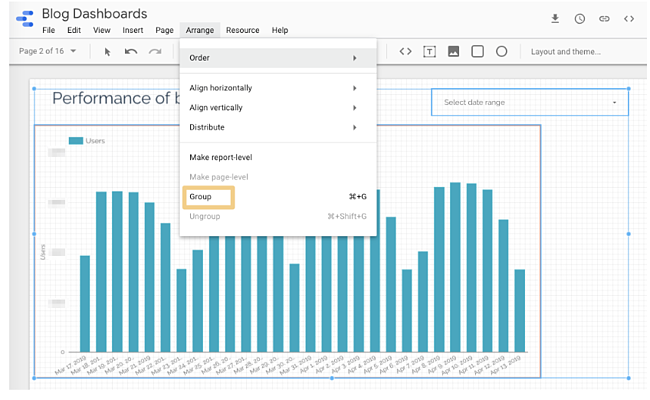
google data studio tips: group charts

Now, only the chart(s) in this group will update when someone adjusts the date range.

Make sure this setting is clear to your viewers — otherwise, they’ll probably assume all the charts they’re looking at on their current page are using the same time period.

10. Add filter controls.

Give your audience even more flexibility with filter controls. Like the date range control, a filter applies its settings to every report on the page. So if, for example, someone filtered out everything besides organic traffic, all the reports on that page would show data for organic traffic specifically.

Add a filter control by clicking this icon in the toolbar.

google data studio tips: add filter controls

The filter will appear on the report page. Resize it and drag it into the position you want. While it’s selected, you should see a panel on the left-hand side:
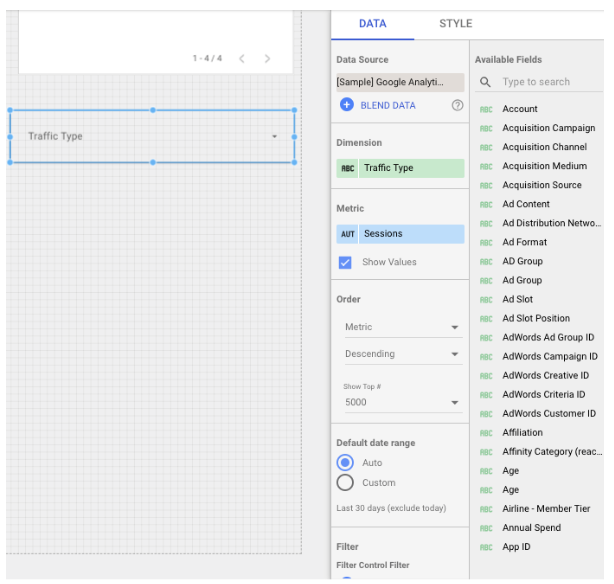
google data studio tips: panel

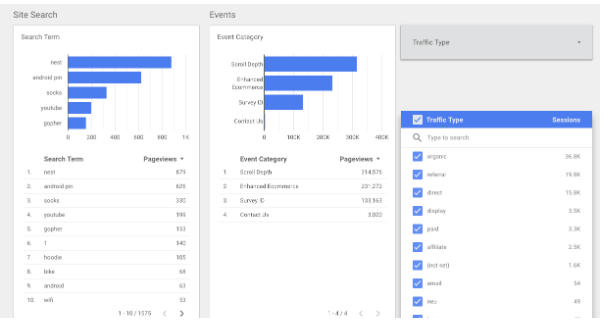
In the data tab, pick which dimension you want viewers to filter. These dimensions come from your data source — in this example, I’ve chosen Traffic Type.

The metric part is optional. If it’s checked, viewers will see the values for each dimension sub-category in the filter. (This will make more sense once you see the screenshot below.) They can sort by these values, but they can’t filter by a metric.

You can add an additional filter to your filter control. For example, if you’ve added a filter for Source / Medium, you may want to exclude the “Baidu /organic” filter, so your viewers don’t see that as an option.

google data studio tips: additional filter controlCustomize your filter control’s formatting and appearance in the style tab. You have a few options: list/check all that apply filters, like this one:
google data studio tips: filter formatting

Or “search all” filters, which allow your viewers to search by numeric and text terms using operators like >=, and <, or “equals,” “contains,” etc., respectively.

This can be a hassle for the people reading the report—plus, they need to be somewhat comfortable with search operators. So, unless your filter dimensions have 10,000 values (unlikely), stick with the list filter.

11. Create interactive chart filters.

Want to make it even easier for your audience to filter the charts in your report? Create responsive chart filters.

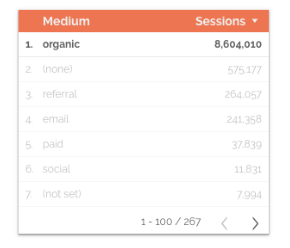
This sounds fancy, but it simply means selecting a dimension in a chart will filter all the charts on that page for that dimension.

For instance, if you click on “organic” in this chart, the other charts on the page will update to show data for organic traffic only — just like you’d applied a traditional filter control.
google data studio tips: interactive chart filters

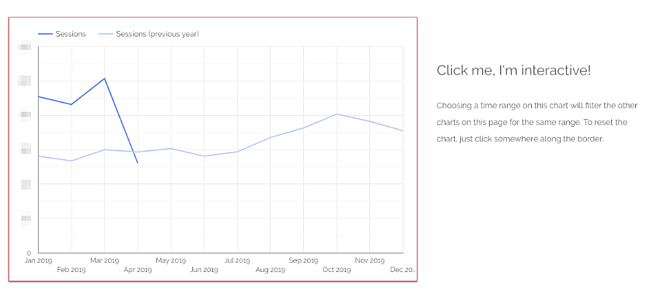
You can also create chart controls for time, line, and area charts. For example, if a user highlights say, January through March on a time chart, the other charts on the page will show data for January through March as well — just like date range control.

And also, just like filter controls, you can group chart controls.

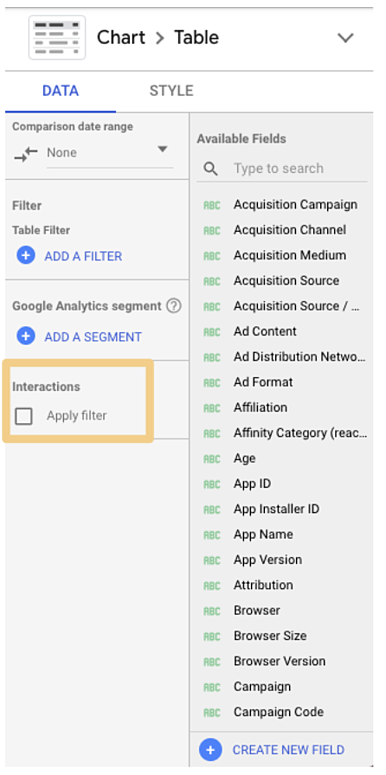
To enable chart control, select the appropriate chart. In the right-hand panel, scroll to the bottom and check the box labeled “Apply filter.”
google data studio tips: apply filterAdd a caption next to charts that support interactive filtering, so your viewers know it’s an option:
google data studio tips: caption example

12. Add a data control.

Data controls may just be one of the coolest Data Studio features, full-stop. Place one of these bad boys on your report, and you’ll give viewers the ability to choose the source of the data being piped into your charts.

This is a game-changer for anyone managing a complex property or working with multiple stakeholders.

For instance, imagine you’re the admin of HubSpot’s Google Analytics account. You create a Data Studio report monitoring key website performance indicators, like average page speed, number of non-200 response codes, number of redirect chains, and so on.

You share this report with the blogging team, who has access to the Google Analytics view for blog.hubspot.com. (Need a refresher on how views and permissions work? Check out our ultimate guide to Google Analytics.)

You also share the report with the Academy team, who has access to the GA view for academy.hubspot.com, and the Leads Optimization team, who has access to offers.hubspot.com.

To see this report populated with the relevant data, these teams simply need to select their view from the “data source” drop-down, and voila — all the charts will update automatically.

Pretty nifty, right?
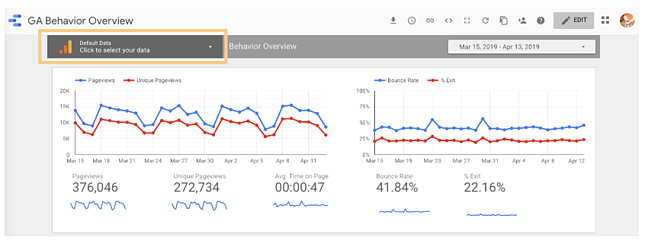
google data studio tips: data control

Not only does this save you from rebuilding the same report for different groups, but it also means you don’t need to worry about accidentally sharing sensitive or confidential information. Each viewer can only select data sources they’ve been granted access to.

You can include multiple data controls in a single report.

Add the data control widget to your report by clicking this icon:

google data studio tips: data control buttonThen choose which primary source you’d like viewers to pull from:
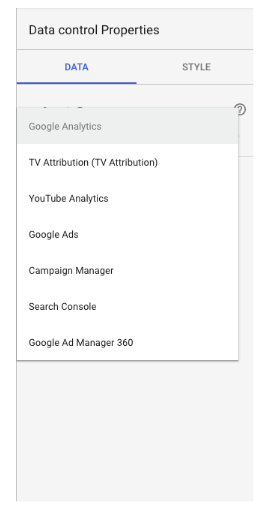
google data studio tips: data control source

13. Add a dimension breakdown.

Instead of telling you what a dimension breakdown is, it’s easier to show you how it works.

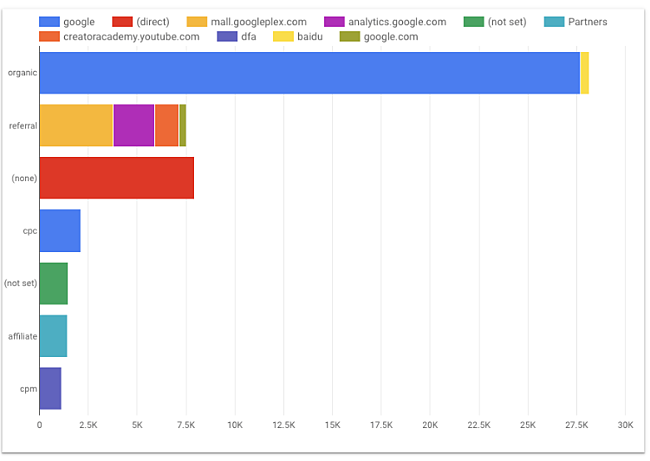
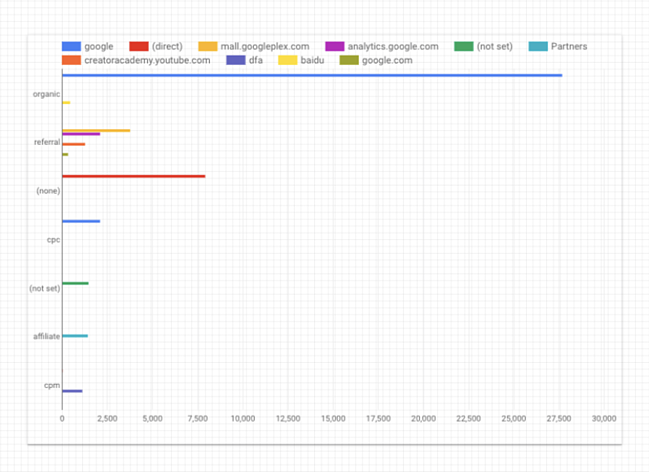
Suppose we want to see users by source. To find out, we create a simple bar chart.
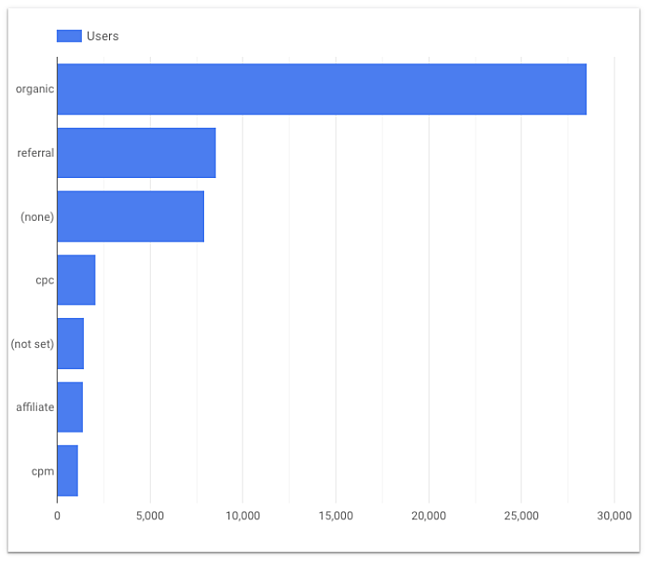
google data studio tips: bar chart

This is interesting — yet there’s some context missing. For example, is all of that organic traffic coming from Google? (Since this is U.S. data, probably, but imagine creating the same chart for China or Japan, where Baidu and Yahoo have a far greater presence.)

What about referral traffic? Clearly, we’re getting a significant number of users from referral links; is a single source driving most of them, or is it distributed fairly equally across a wide variety of sources?

We could create separate bar charts for each source — first filtering by medium and then making the dimension “Source” and the metric “Users.”

Or we could click a single button and have Data Studio do it for us.

Under Breakdown Dimension, click “Add dimension.”
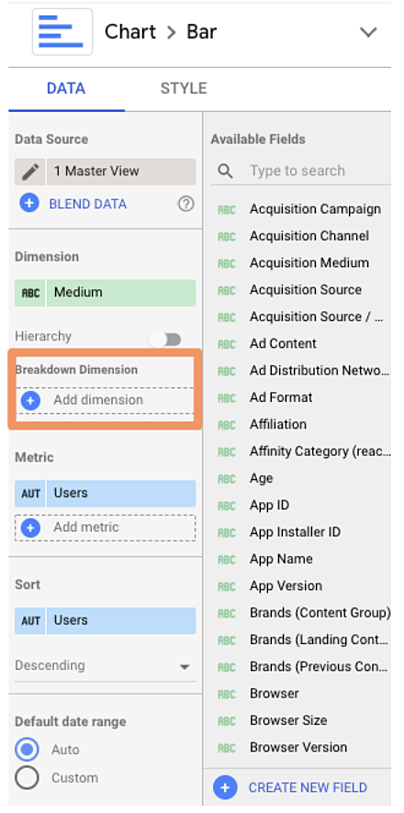
google data studio tips: bar chart dimensions

Add “Source.”

Here’s what you should see:
google data studio tips: bar chart

Pretty sure my former Data Analytics professor would cry if he saw this. But don’t worry, we’re not done yet.

Jump over to the “Style” tab and check the box “Stacked bars” to turn your regular bar chart into a stacked bar chart (you should see the chart type update accordingly).

Data Studio will automatically make your bar charts “100% stacking,” meaning that every bar will go to the top of the chart. However, this style is misleading — for example, here, it suggests every medium drove the same number of users.

Uncheck this box.
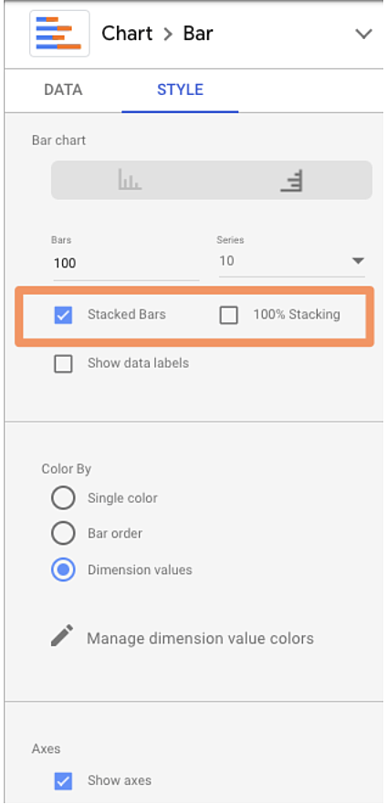
google data studio tips: stacked barsNow check it out:

google data studio tips: complete stacked bars chart

14. Use Data Studio Explorer (Labs).

To bring any chart into Explorer, mouse over the space next to its top-right corner. You’ll see three vertically-stacked dots appear; click them.
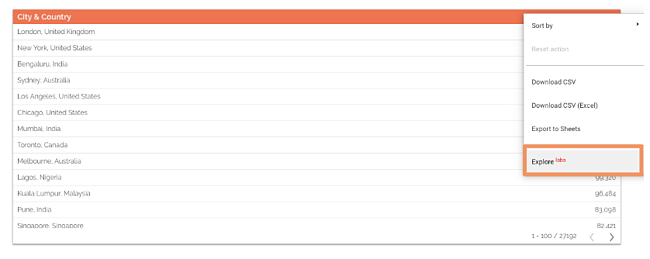
google data studio tips: data studio explorer

Select “Explore (Labs).”

You’ll see something like this:
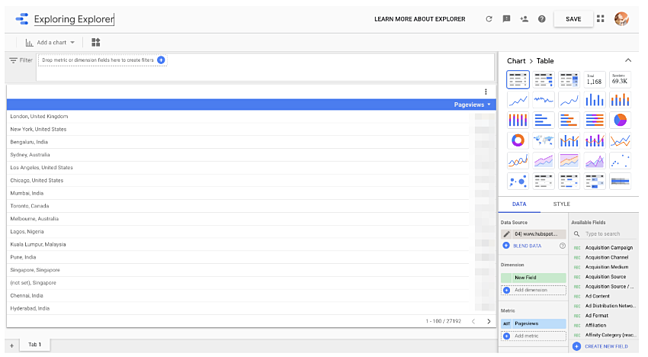
google data studio tips: explorer view

You can toggle between different visualizations; add and remove dimensions and metrics; change the date range, and apply segments.

Note: Unlike every other Google tool out there, Explorer does not automatically save your work.

To preserve your chart, click the “Save” button on the top nav bar (to the left of your profile icon). Once you do that, your Explorer “report” will be saved in the Explorer section of your dashboard. In addition, every change you make will be saved by default.

Speaking of that dashboard, if you prefer, you can also start with Explorer (rather than a Data Studio report). Go to your Data Studio dashboard and select “Explorer (Labs)” in the left-hand menu.
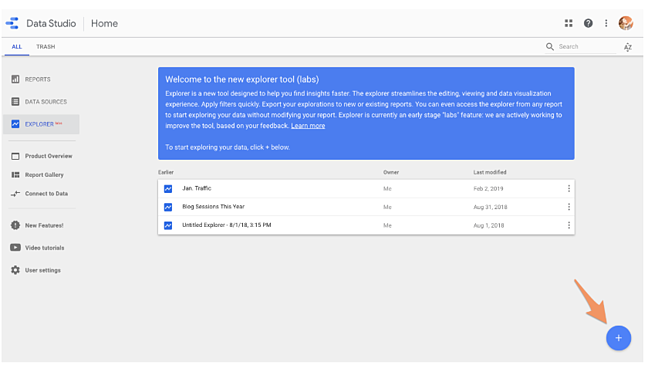
google data studio tips: explorer plus button

Add a new data source by clicking the blue button in the lower right corner.

At first, Explorer confused me. It feels very similar to the core Data Studio — what was the point of having both?

However, after spending some time in Explorer, I’ve come to appreciate its unique value.

Unlike Data Studio, any modifications you make to a chart in Explorer are temporary. That means it’s a great place to dig into your data and try out different ways of visualizing it without making any permanent changes. Then, once you’re happy with your chart, simply export it back into Data Studio.

To do this, click the small sharing icon in the top navigation bar.
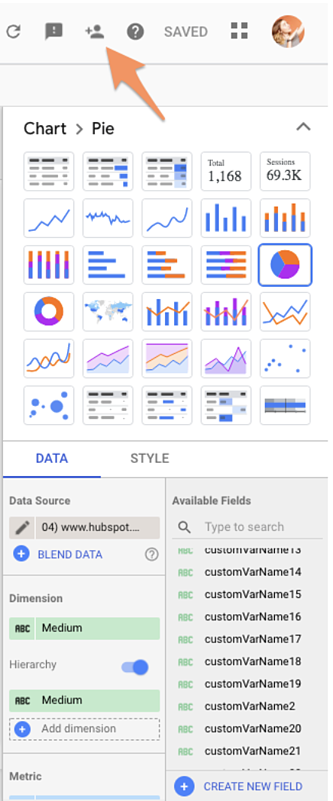
google data studio tips: share

Then choose whether to add your Explorer work into a new or existing Data Studio report.

Advanced Google Data Studio Tips

15. Create report-level filters.

By default, a filter applies to every chart on that page. But what if the viewer goes to the next page? The filter won’t go with them.

This is confusing for non-technical folks and inconvenient for data-savvy ones. To bring a filter up from page-level to report-level, simply right-click on it and select “Make report-level.”
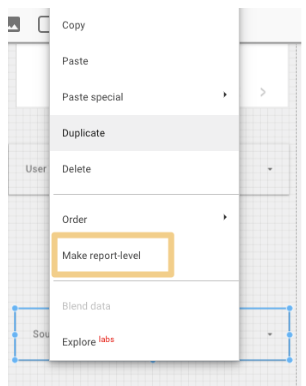
google data studio tips: make report level

16. Create blended fields.

Data Studio is powerful because you can bring in 400+ sources of data into a single report. But, thanks to a new feature, blended sources, it just got even mightier.

Heads up: this will get a little technical. Stay with me, and I promise it’ll be worth it.

If you’re familiar with JOIN clauses in SQL, you’ll understand data blending right away. No idea what SQL is? Not a problem.

The best way to think about blending data is with a Venn Diagram. You have two data sets. Each data set has unique information — e.g., such as the data living in the green and blue areas.
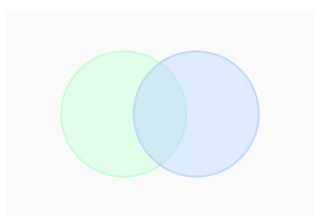
google data studio tips: blended fields illustration

But they have (at least) one data point in common: the information in the blue-green overlap section.

This shared data point is known as a key. If your data sets do not have a key, they’re not blendable.

For example, suppose you want to compare how users behave on your website versus your app. The key is the user ID, a custom dimension you’ve created in Google Analytics that your app analytics software also uses. (Note: The key doesn’t need to have the same name in both data sources; it just needs to have identical values.)

You blend your website behavior report from GA with your app usage report. This gives you all the records from the first report along with any matching ones from the second; in other words, if a user has visited the site and used the app, they’ll be included.

However, if they only used the app but didn’t visit the site, they will not be included in the new blended data.

This is known as a LEFT OUTER JOIN. (To learn more, check out this W3Schools primer.) Why do you care? Because the order of your data sources matters.

Put your primary data source first — e.g., the one where you want all the values, regardless of whether there’s a match in your second source.

Now that we’ve gotten all that out of the way, let’s set up a blended field.

First, add a chart to your report.
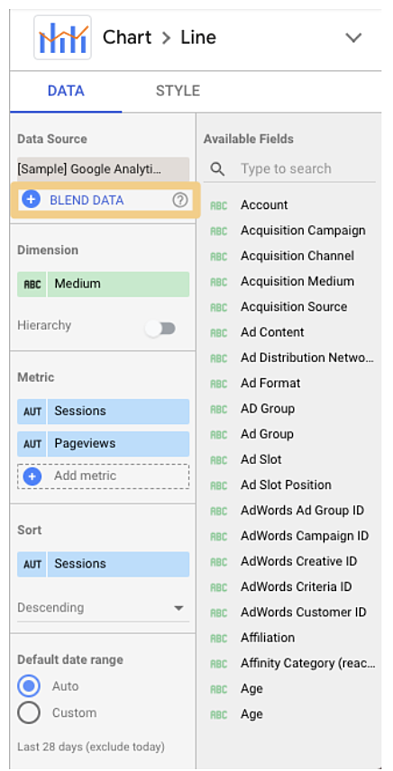
google data studio tips: blend data button

Click on “Blend Data.”

This panel will pop up:

google data studio tips: blend data panel

Select your first data source on the left. Remember, this is the primary data source. Then add your second data source. Data Studio lets you add up to five data sources in a chart, but let’s stick to two for now.

Now pick your join key(s). If the field exists in both sources, it will turn green. If it doesn’t exist, you’ll see this:
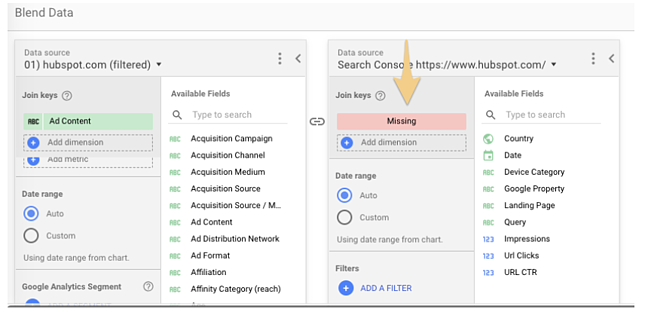
google data studio tips: join keys

Remember that the key acts as a filter for the second data source. So in this example, only records that match the landing page from the GA view for hubspot.com will be pulled from Google Search Console.

Choosing multiple keys will further limit the number of records pulled from the second data source.

Once you’ve picked your join key(s), the rest of the process should feel familiar.

Pick the dimensions and metrics you want to see for your first data source. Then do the same for your second.

You can also limit the results by adding a filter or date range (or for GA sources, segments). Filters, date ranges, and segments applied to the left-most data source will carry over to the other data sources.

Once you’ve finished customizing the report, click “Save.” Congrats: you just created your first blended data chart!

If you find it easier to create two separate charts and then combine them, Data Studio offers a great shortcut.

Just select both charts, right-click, and choose “Blend data.”
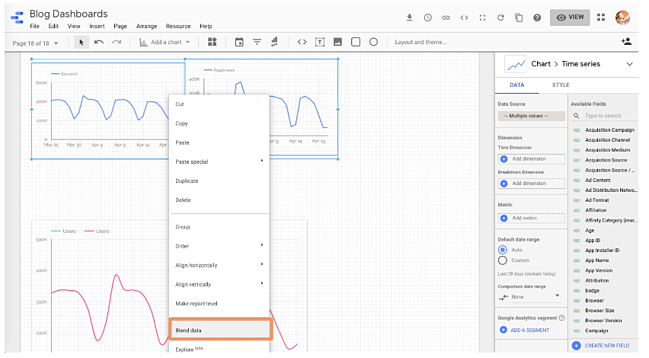
google data studio tips: blend data buttonUnfortunately, Data Studio can get confused pretty quickly, so I’d still make an effort to learn how to blend data using the right-hand pane.

17. Blend your data source with itself.

Try this workaround if you’re bumping into limitations with your data source connectors: blend a data source with itself.

To give you an idea, the GA data connector only lets you add one “active user” metric to a chart, so there’s no way to see 1 Day Active Users, 7 Day Active Users, and 28 Day Active Users on the same chart… unless you blend your Google Analytics data source with itself.

Follow the same instructions as above, but instead of picking a new source for your second data source, just select the first one again.

And since all of the fields are identical, you can pick whichever join key you’d like.

google data studio tips: blending data source with itself

This option is also perfect when comparing trends across two-plus subdomains or segments.

For instance, I wanted to look at organic users for the HubSpot Blog (blog.hubspot.com) and primary site (www.hubspot.com) at the same time.

This helps me figure out if we’re growing search traffic across the board. It’s also helpful when traffic decreases — have rankings dropped site-wide, or just for the blog (or the site)?

However, you can’t add two separate “user” metrics to a chart at once… unless, of course, you’re blending data.

Create a new blended data source (following the same process as above) to set this up.

Add your first view to the left-most column, your second view to the following column, and so on.

Note: Make sure you’re choosing views with mutually exclusive data. In other words, I wouldn’t want to use “blog.hubspot.com” as my first source and “blog.hubspot.com/marketing” as my second source because all the data for the blog.hubspot.com/marketing view is included in the blog.hubspot.com one.

Because of that overlap, we wouldn’t be able to spot trends clearly.

google data studio tips: choosing data sources for blending dataUse “Date” as the join key.

google data studio tips: join key

I added the organic traffic segment to both sources, but you can choose whichever segment you’re interested in (paid traffic, social traffic, etc.) Or leave it off entirely! Tons of possibilities here.

In fact, here are some additional ideas for blending a source with itself:

  • Compare two-plus custom segments
  • Compare two-plus landing pages
  • Compare two-plus goal completions


18. Create a basic calculated field.

When your existing data doesn’t give you enough information, it’s time to create a calculated field.

Calculated fields take your data and, as their name suggests, makes calculations.

It’s probably easiest to explain with an example.

Let’s say you want to look at the average number of transactions per user. You can create a calculated field that takes the metric “Transactions” and divides it by the metric “Users.”

Once this field has been created, it’ll be updated automatically — so you can change the chart’s time range, dimensions, etc., and the average transactions per user data will update accordingly.

There are two ways to create a calculated field.

Create a data-source calculated field

This option makes the field available in any report that uses that data source.

It’ll also be available as a filter control or in new calculated fields (like calculated field inception).

Obviously, this is a good option if you plan on using this custom metric more than once. The only caveat — you must have edit rights to the original data source. You also can’t use a data source calculated field with blended data.

To create a data-source calculated field, add a chart to your Data Studio dashboard, then choose the data source you want to derive your new field from.

Click “Add a new field” in the lower left-hand corner.
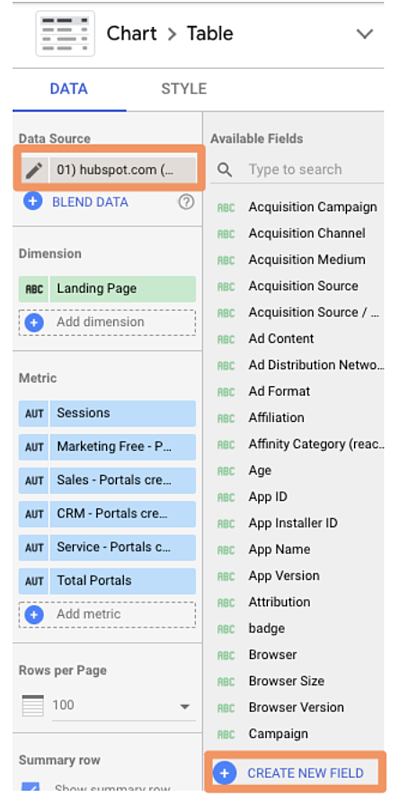
google data studio tips: create new field

(You can also do this by clicking the pencil next to the data source and then selecting “Add a field” in the upper right corner of your field menu.)

google data studio tips: add field button

Use the left menu to search for the metrics you need; click one to add it to the formula.

If the formula has an error, a notification will appear in red underneath the editor explaining where you went wrong.

If your formula works, you’ll get a green checkmark.

google data studio tips: green checkmark

Click “Save” to add your new field to the data source.

And don’t forget to name yours — which I forgot to do. 🙂

Now you can add this calculated field to any chart just like a regular field.

Create a chart-level calculated field

For this option, you’ll only be able to use the field for that specific report.

This option is a little easier because all the limitations of the other type are reversed.

While you can’t use a chart-level calculated field in another chart, filter control, or additional calculated field, you don’t need edit rights to the original data.

You can also use a chart-specific calculated field for data blending, which we’ll cover in the next step.

To create a chart-level calculated field, simply click “Add a field” underneath the existing dimension(s) and metric(s) you’ve selected.
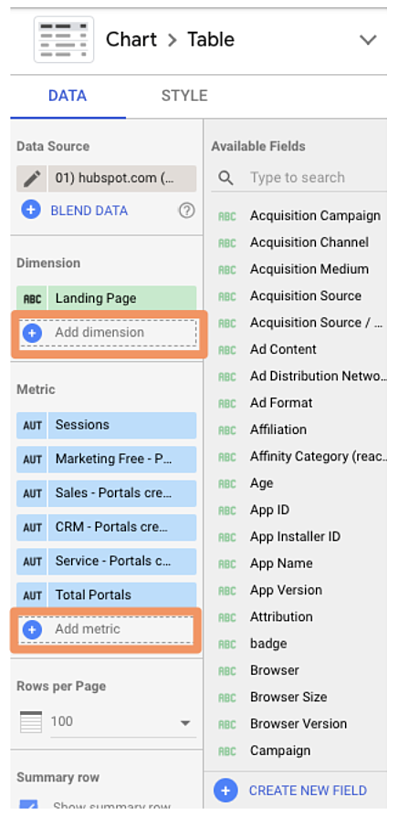
google data studio tips: add dimension and add metricWhen you choose to add a new field, this pane will pop up:
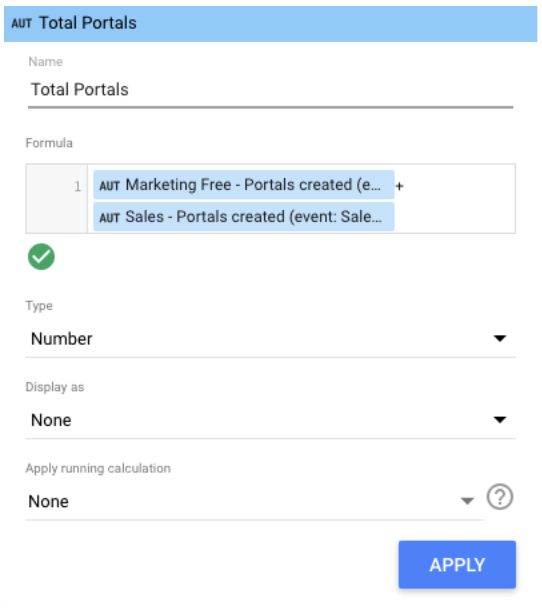
google data studio tips: add new field pane

From here, enter the formula for your new field — simply typing in the name of your desired metric will trigger a menu of options — and click “Apply.”

Your new field will be added to the chart.

Loves Data’s Benjamin Mangold has an excellent round-up of sample calculated metrics, including:

  • Average goal completions per user
  • Non-bounce rate
  • Pageviews per transaction
  • Value per session

You can check it out for inspiration.

If you want a little practice before you start going to town on your own data, Google offers a handy sample exercise.

19. Create an advanced calculated field.

Okay, so there’s a lot you can do with simple algebraic calculated fields. But there’s even more you can do once you introduce functions and RegEx.

Don’t be scared off! We’ll walk through these step-by-step.

If you’re comfortable with Google Sheets and/or Excel functions, you already know how to use functions in Data Studio.

For instance, let’s say that you majored in English, and it’s always bothered you that “Source” in Google Analytics is lower-case.

You can use the UPPER function to transform Source into all upper-case.

Simply click “Add dimension” > “Create new field.”
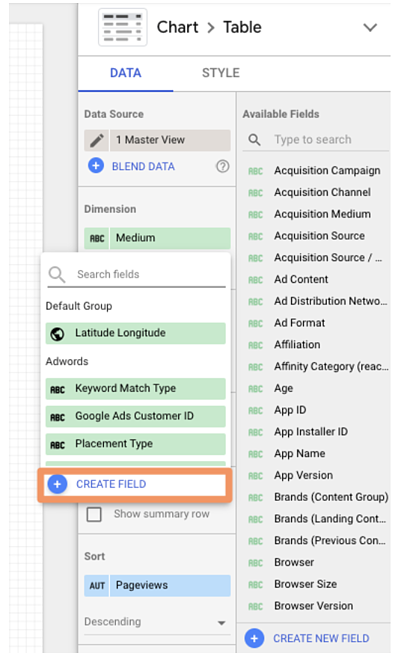
google data studio tips: create new fieldThen enter the UPPER formula:

google data studio tips: upper formula

As Google Sheets expert Ben Collins points out, this trick will also standardize any custom naming; for example, if some people on your team used “chat” for a campaign, and others used “Chat,” the UPPER function will aggregate both together.

Perhaps you want to create a new field for city and country.

Just click “Add dimension” (since city and state are categorical, not quantitative, variables) > “Create field.”

Then use the CONCATENATE function to smush together the City and Country fields.
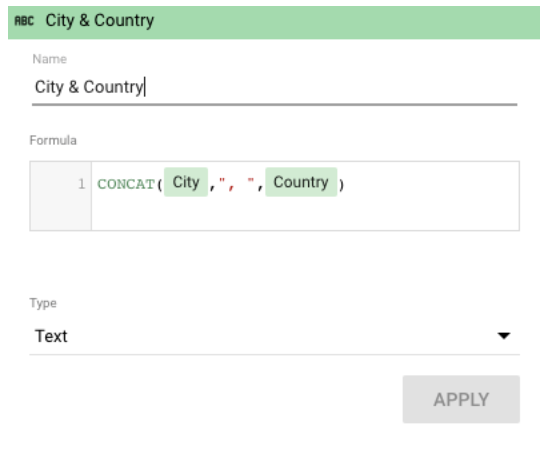
Screen Shot 2019-05-08 at 5.43.36 PM

Check out the complete list of functions Data Studio supports.

One of the niftiest is CASE. If you’re unfamiliar, it’s essentially an IF/THEN statement. This function lets you create custom groupings.

For example, let’s say you’re looking at the table we created in the last step:
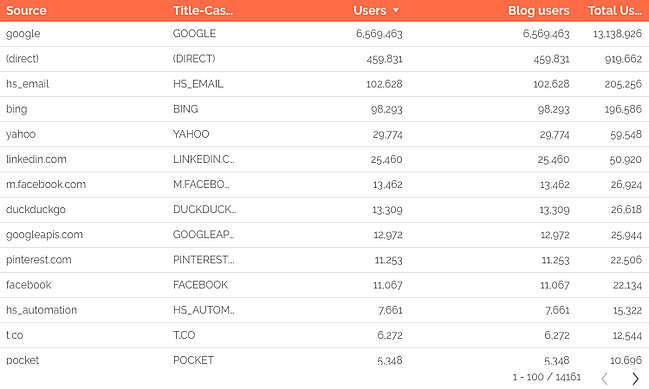
google data studio tips: table example

Here, Data Studio is treating Facebook mobile traffic (m.facebook.com) and desktop traffic (Facebook) as two different sources. There’s also l.facebook.com — desktop traffic coming via a link shim, which Facebook implemented in 2008 to protect users from potential spam. What if you want to combine all Facebook traffic into a single source?

A CASE formula solves this issue neatly. Here’s the formula:

CASE

WHEN condition THEN result

WHEN condition THEN result

ELSE result

END

You can have one condition (like the example below) or several. The ELSE argument is optional, so feel free to leave it out if you don’t need it.

Here’s the formula we’ll use to group Facebook traffic:

CASE

WHEN REGEXP_MATCH(Source,”^(l.facebook.com|m.facebook.com|facebook.com)$”) THEN “Facebook”

END

This formula tells Data Studio, “If the source matches l.facebook.com, m.facebook.com, or facebook.com, call it ‘Facebook.’”

To add a CASE formula, you must be able to edit the data source.

Click the pencil icon next to your source to bring up the data field editor.

Then click “Add a new field” in the upper right corner.

Enter your formula.

google data studio tips: formula

If the formula works, you’ll see a green checkmark. Give your new field a name and click “Save.” Now you can add this field to any chart or data viz that uses this data source.

You might be thinking, “Okay, great, but was that formula written in Klingon? How do I come up with my own?”

Don’t know RegEx? No problem! This blog post has five formulas to get you started.

20. Create a calculated blended field.

This is the pinnacle of Data Studio mastery, requiring all the skills you’ve already learned and a hefty dose of luck — just kidding, it’s super easy.

Create a blended data source per usual.

In this example, I blended together the GA views for www.hubspot.com and blog.hubspot.com.google data studio tips: blended field
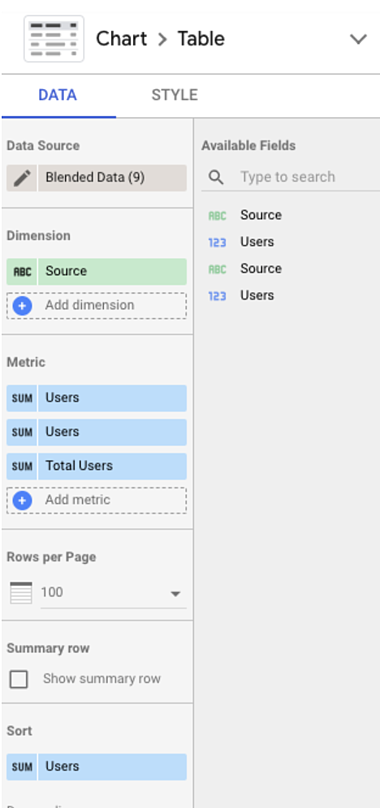
Then click “Add metric” > “Add new field” as you would to create a normal calculated field.

Enter your formula.

I wanted to see “Total Users” (i.e., users from www.hubspot.com plus users from blog.hubspot.com), which is a simple calculation:
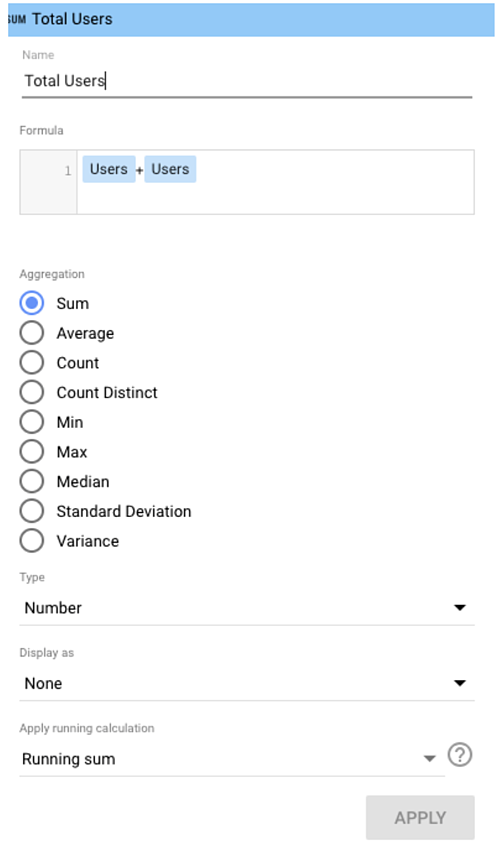
google data studio tips: calculation blended field

Note: It can get a bit hairy here if you’re using two different fields with the same name, as I’m doing here. Sometimes Data Studio is smart enough to recognize the difference, and sometimes it’s not.

If you run into issues, I recommend editing the name of one or both fields in the original data source(s), which you can do at any time by clicking the pencil next to the blended data source.

Then click the pencil next to the field name you want to change.

google data studio tips: editing name of fieldsThis pane will appear; edit the title accordingly.
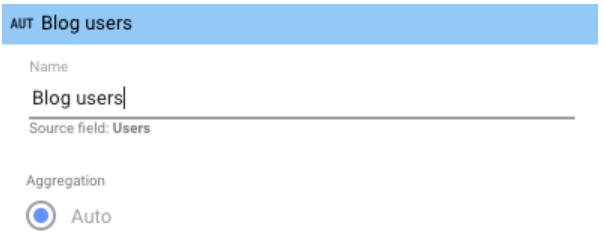
google data studio tips: editing paneThen click “Save” and go back to your calculated field to update the formula:
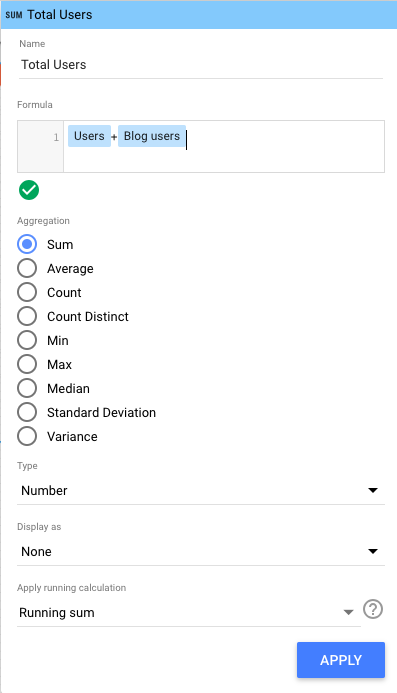
google data studio tips: update the formulaDone! I can now see both in my report.

Google Data Studio is the Best Way to Visualize Your Data

Now that you know Data Studio inside and out, you’re well-prepared to create stunning interactive reports for your coworkers, clients, and executives. Use the tips I shared above to make the most of it and successfully show the ROI of your marketing efforts.

Editor’s note: This post was originally published in October 2018 and has been updated for comprehensiveness.
SEO Starter Pack

Categories B2B

The HubSpot Blog’s 2022 Instagram Marketing Trends Report

If you’ve been on Instagram lately, you’ve probably noticed that the app looks a bit different every time you log on.

The heart-shaped notification button seems to move with a mind of its own, IGTV has disappeared, and the addition of the Reels and Shop buttons has completely changed the way we interact with the platform.

While these changes seem arbitrary, they’re the crucial next steps in Instagram’s evolution into a video-centric social shopping platform.

In 2022, Instagram will continue to prioritize video, expand on social shopping tools, make it easier for creators to monetize their content and partner with brands, and rework direct messaging (DM) interfaces.

While these shifts align with the trends we saw in our Social Media Trends survey, we decided to dive even deeper by asking another 580 Instagram marketers about how they’ll approach marketing on this changing platform in 2022.

New Data: Instagram Engagement Report [2022 Version]

Top Instagram Marketing Survey Findings

Based on our results, most Instagram marketers are already ahead of the game:

  • 79% have leveraged Instagram Shopping tools and one in three plan to use them for the first time in 2022.  
  • 82% post video content on the platform and the content formats they use most are video-based.
  • Instagram Live has the highest ROI of any content format. It is also the most effective for gaining followers, gets the most shares, and will see the most investment from Instagram marketers this year.
  • Content that reflects your brand’s values and showcases your products/services have the highest ROI on Instagram.
  • The best strategies to grow your following on Instagram are posting interactive and engaging stories, engaging with other users, and partnering with influencers.
  • Instagram marketers will prioritize fostering relationships with their customers in 2022 by focusing on interacting with their audience and creating content that encourages engagement.
  • 35% use the app for customer service and see high ROI.
  • 30% work with influencers (or creators) and 42% plan to start this year.
  • 84% say Instagram marketing was effective for their company last year.

what percentage of marketers find their Instagram Strategy EffectiveNow that we’ve given you a taste of our survey findings, let’s dive deeper and take a look at some Instagram benchmarks to help you see how your brand’s account stacks up against the competition. 

If you’re looking for some specific insights, click below to jump to the section you’d like to read first.

Instagram Marketing Benchmarks To Know In 2022

1. Over half of branded Instagram accounts have between 10K-100K followers.

More than a quarter, or 27%, of branded accounts have under 10,000 followers, while 19% have over 100K. Regardless of the size of your community, stay tuned for a breakdown of the top strategies for growing your Instagram following.

how many instagram followers do you have

2. Impressions can come from anywhere on the platform.

Hashtags, Explore, and Profile, are all tied at 19% for the top Instagram impression sources, but Home and Location are just slightly behind.

top sources of instagram impressionsHashtags and Profile are more easily discoverable by search, so make sure your handle and hashtags are search-optimized.

Some posts may do exceptionally well due to a certain combination of hashtags you used, or thanks to the algorithm suggesting your content on the Explore page. Take a look at where the impressions came from on your top posts and keep an eye out for any patterns you can turn into a consistent strategy to re-create your success.

3. Less than half of business accounts have major YoY follower growth.

But, this doesn’t mean brand accounts are dramatically losing followers. In reality, only 14% report a loss while 42% have a stagnant following. 

How have follower counts changed on your Instagram channels

Now that we’ve gone over some benchmarks, let’s talk about goals and strategies.

Instagram Marketing Strategies

Top Strategies and Goals of Instagram Marketers

With all the changes coming to the platform, marketers’ goals on Instagram are also shifting.

The top goals Instagram marketers have for 2022 are increasing brand awareness/reaching new audiences, advertising their products/services, increasing sales, fostering relationships with customers/increasing brand loyalty, and improving customer service and retention.

primary goals of instagram marketers

Let’s talk about each of these goals in terms of how they relate to Instagram’s changing platform.

1. Spreading Brand Awareness with Content Like Videos

Instagram has made clear that its focus is turning away from photos and toward video content. Not only does this indicate that Instagram users are more interested in seeing video content, but we can assume that video content will be more likely to be suggested to users by Instagram’s algorithm.

But which type of videos should you be making?

If the amount of Reels present on your Instagram feed and explore page didn’t give it away, Instagram also added a dedicated tab for Reels in the navigation bar to drive the point home — Reels are taking over.

And it’s not just Instagram — our social media trends survey found that short-form video is the most popular and effective format across all social platforms.

So to reach the widest audience on Instagram this year, focus on videos, especially Reels.

2. Driving Leads and Conversions With Instagram Advertising.

Advertising products/services is another top goal for Instagram marketers, and they will accomplish this by creating content showcasing their products/services and leveraging Instagram’s new shopping tools.

Content centered around a brand’s products/services is the second most popular type of content among Instagram Marketers and has the second-highest ROI of any content type.

Instagram Strategies with the Highest ROIMy survey also found that marketers who leverage this type of content are 13% more likely to say their Instagram strategy was effective last year than those who don’t.

However, the most popular and most effective Instagram marketing strategy is leveraging the app’s shopping tools. But with a handful to choose from, let’s take a look at which ones perform the best.

Screen Shot 2022-04-11 at 3.27.37 PM

3. Gaining Revenue With Instagram Shopping Tools

Although Instagram Shopping tools are still rather new and evolving, Instagram Shopping strategies offer the highest ROI and are already used most by Instagram marketers

While just 37% currently use the app’s shopping tools, 94% of them will increase or maintain their investment this year. On top of that, one in three plan to use Instagram shopping tools for the first time this year.

Also, marketers who leverage Instagram’s shopping tools are 15% more likely to say their Instagram strategy was effective last year than those who don’t. So which tools perform best?

Of the shopping tools, Instagram Live Shopping and Instagram Shops have the highest ROI and are the most leveraged.

Additionally, the use of both will grow significantly in 2022, with 55% planning to try Instagram Shops and 48% planning to use Instagram Live Shopping for the first time.

Instagram feed shopping posts, Instagram Stories Shopping, and Instagram Guides Shopping are all used by over one in three marketers and are just behind Instagram Shops and Instagram live Shopping for ROI.

Reels Shopping has the lowest use and ROI, however, 42% of Instagram marketers plan to use Reels Shopping for the first time this year, the 3rd highest of any Instagram shopping tool.

which shopping tools will brands use for the first time

Is selling on Instagram right for you? And, what are the biggest benefits and challenges you could see when using it? Stay tuned for a deep dive on even more data that we’ll be sure to link to this post. 

4. Building Customer Relationships and Community

The ability to foster meaningful relationships with customers is one of the biggest benefits of having a brand presence on social media platforms, so it’s no surprise that this is a top goal for Instagram marketers that will become even more of a priority in 2022.

Marketers will accomplish this by investing in interacting with their audience and creating content that encourages engagement.

The Importance of Interacting With Your Audience

Audience interaction is the #1Instagram strategy marketers plan to leverage for the first time in 2022, with 46% planning to try it this year. On top of that, 15% of marketers plan to invest in it more than any other Instagram marketing strategy.

Instagram offers a wide variety of ways to interact with your audience, from simple reactions to comments and DMs. Taking the time to engage with your followers can make them feel special and strengthen their bond with your brand. But interaction is a two-way street, so you’ll also want to create content that encourages engagement.

5. Putting Engaging Content Before Other Tactics

Creating content that encourages engagement is the strategy Instagram marketers plan to invest the most in for 2022, with 17% planning to invest more in it than any other strategy.

Additionally, 43% plan to use it for the first time in 2022, the second-highest of any Instagram marketing strategy, and it has 3rd highest ROI of any strategy.

instagram marketing strategy with the best ROIEncouraging engagement can be as simple as ending your video with a question that your followers can respond to in the comments, running a poll on your story, or going live and having a conversation with your viewers.

Going out of your way to connect with those in your digital community, especially when you aren’t trying to sell them anything, can help foster a deep relationship between them and your brand.

But there’s another great way to leverage Instagram to help serve your customers and keep them coming back – using the app for customer service.

6. Embracing Customer Service

Being a marketer doesn’t mean you should toss good customer service opportunities aside on Instagram. 28% of Instagram marketers say improving customer service and retention is among their top goals in 2022, and with good reason. Leveraging Instagram for customer service is the 2nd most used Instagram marketing strategy and has the 2nd highest ROI of any strategy.

To make the case for providing customer service on the app even stronger, I found that marketers and brands who leverage Instagram for customer service are 17% more likely to say their Instagram strategy was effective last year compared to those who don’t.

7. Leveraging Hashtags

Hashtags have been around on Instagram since 2011, and 82% of Instagram marketers continue to leverage them, with 85% following a documented hashtag strategy. But are they effective?

80% of Instagram marketers say hashtags were effective for their Instagram strategy last year. Furthermore, marketers who leverage hashtags when posting on Instagram are 23% more likely to say Instagram marketing was effective for their brand last year. That number goes up to 30% when looking at those with a document hashtag strategy.

We also found that marketers who use a mix of niche and general hashtags are 20% more likely to say Instagram marketing was effective for their brand in 2021. 

Make sure to leverage a few specific hashtags like #Dachsunds along with more popular ones like #Dogs for the best results.

How Many Hashtags Should You Use on Instagram?

Our survey shows that 62% of Instagram marketers use 4-9 hashtags, and only 1% use the maximum of 30.

how many hashtags do instagram marketers use

Also consider using a branded hashtag when posting on Instagram, such as #CocaCola, for example.

53% of marketers say most of the brands they work for use branded hashtags, which can be great for creating a community around your brand and offer an easy way to find posts from or about your brand in one place.

Next, let’s talk about which call-to-action is most effective on Instagram.

8. Including Calls to Action in Content

We asked Instagram marketers whether asking followers to “like,” “share,” or “save” their content is most effective at triggering the algorithm to promote their content, as these are known to be the top metrics Instagram monitors. Here are the results:

the most effective CTA type on Instagram

While Instagram marketers rank likes at #1, shares second, and saves last, I would argue that this is backwards.

To explain why, consider your behavior when on Instagram. If you’re like me, you probably give out likes mindlessly while scrolling through your feed, but how often are you sharing content to your story or in chats with friends? How often are you saving posts to look at later? Those pieces of content are probably much more carefully selected.

When we share posts on Instagram, we are telling others that we found the content so valuable that we couldn’t help but share it with them – the algorithm picks up on this. Sharing also gets bonus points because it inherently exposes more people to a piece of content.

Similarly, when saving content, we tell the algorithm that we found it so valuable that we want to bookmark it for future reference.

So while all three of these are the most important metrics Instagram tracks, I would prioritize saving, sharing, or even commenting in your call-to-actions ahead of asking for likes.

Strategies Marketers Aren’t Using in 2022

User-generated content, contests or giveaways, and affiliate marketing have low usage, ROI, and are the least likely to be leveraged on Instagram for the first time in 2022.

While these strategies can still be successful and valuable to some brands, marketers we surveyed say they are not as effective as the other strategies we asked about.

If you’re having difficulty building an effective UGC, affiliate marketing, or giveaway plan, consider alternatives, like partnering with influencers in your niche who can generate authentic content for your brand to establish social proof and spread awareness. Our marketing trends survey found influencer marketing to be the most popular and most effective trend, with the highest ROI.

Now that we’ve gone over Instagram marketers’ goals and strategies in 2022, let’s talk about which formats are most effective on the platform.

Which Instagram Formats Are Most Effective?

The formats Instagram marketers leverage most are live, stories, and interviews/Q&A/Expert discussions. Let’s take an in-depth look at each of them.

Instagram Live

Instagram Live has the highest ROI and use will grow significantly in 2022 as 49% of Instagram marketers will invest in Instagram Live for the first time and 22% will invest more in Instagram live than any other format.

which formats do marketers leverage on InstagramWe also asked Instagram marketers which format is most effective for gaining followers, and Instagram Live came out ahead there as well, though closely followed by stories and feed posts.

which instagram formats provide ROI


Instagram Stories

Instagram Stories have the 2nd best ROI and are leveraged by 45% of Instagram marketers. Of those who don’t use it, 45% plan to leverage stories for the first time in 2022, the 2nd highest of any format. Instagram stories are also the #2 format for gaining followers and getting your content shared on IG.

Which format gets the most shares on instagram

Interviews, Q&As, and Expert Discussions

Interviews/Q&As/Expert discussions are used by 31% of marketers, with 42% planning to try them for the first time in 2022 and 10% planning to invest more in them than any other format.

which format gets the most shares on Instagram

Instagram Reels

Only one in four Instagram marketers use Reels and just 29% of Instagram marketers plan to leverage reels for the first time in 2022.

While Reels fall in the middle of the pack across all metrics, we believe that this is feature is greatly underutilized and could actually provide unique and new opportunities for brands.

In fact, brands and influencers who have focused on it have seen major benefits to leveraging it. For example, we recently spoke with Kar Brulhart, who has organically grown her Instagram account from zero to 45,000+ viewers in under 10 months using Reels. She told us about the incredible opportunity Reels presents for Instagram marketers:

 “I went from less than 2,000 followers in February 2020 to over 15,000 the next month through Reels, because Instagram is pushing Reels to new audiences. And 75% of the people who find my account are coming from Reels — compared to Stories and posts.”

Considering the popularity of short-form videos and the emphasis Instagram is placing on Reels, Instagram marketers may want to give Reels a shot as they are relatively easy to make and can provide a boost in exposure.

Now that we’ve gone over the top formats, let’s take a look at which content types are most popular on Instagram.

Which Types Of Content Perform Best On Instagram?

The top Instagram content types reflect a brand’s values, are centered around a brand’s products/services, are interactive, authentic, and funny. Let’s take a look at what makes each of these content types so popular among Instagram marketers.

Content That Reflects Brand Values

Content that reflects a brand’s values was the #1 content type in our social media trends survey and that is also true for Instagram marketers, 44% of whom use it.

which instagram content types have the highest ROI

Instagram marketers say it has the highest ROI of any content type. Additionally, 45% say they will invest in it for the first time in 2022, the highest of any content type, and 11% will invest more in it than any other type of content.

which types of content to Instagram marketers plan to invest in

Content Centered Around A Brand’s Products/Services

Content centered around a brand’s products/services is leveraged by 39% of Instagram marketers and has the 2nd highest ROI. 39% will leverage this type of content for the first time in 2022.

content types with the highest ROIInteractive Content and/or Authentic/Behind-the-Scenes Content

Interactive content and authentic/”behind the scenes” content are both popular among Instagram marketers and will grow in 2022.

44% of Instagram marketers plan to leverage interactive content for the first time in 2022, followed by Authentic/”Behind the scenes” content at 40%. Both are tied at the #1 spot for the content type marketers plan to invest more in than any other in 2022.

Funny Content

Funny content is the most effective for getting followers, shares, and engagement on IG.

Now that we’ve gone over the different Instagram formats and content types, let’s dig into the top strategies for growing your following on Instagram.

Instagram Audience Growth Benchmarks

How Brands Grow Instagram Audiences

To grow your following on Instagram, the top 3 strategies are posting interactive and engaging stories, engaging with other users, and partnering with influencers.

At #4, sharing your Instagram page and content on various channels, like other social media platforms or your website, is also important for growth.

The next most popular strategy is diversifying your content to resonate with a wider audience, but you’ll also want to study your audience for trends and make targeted content to attract others with similar interests.

Another powerful growth strategy is adding a simple call-to-action to “like,” “save,” or “share” your content at the very end of your captions – if someone read it all the way through, they probably got value from your content and will be inclined to comply. If users take these actions, it will give your content a boost in the eyes of the algorithm and put it in front of more people, who may end up following you.

Lastly, you can also get a boost in growth by partnering with brands or accounts in a similar niche, as their audiences will likely be interested in your content as well.

These are the best strategies to grow your following in general, but we also asked marketers about the top strategies they used to reach their first thousand followers, and the results show some key differences.

How To Get Your First 1,000 Instagram Followers

Earning your first 1,000 followers on Instagram is a massive milestone, and 78% of Instagram marketers have been part of growing an account to 1k followers. According to them, creating shareable content and captions, as well as using relevant hashtags are key to reaching your first 1k followers.

strategies brands used to get their first 1000 followers

Remember that the formats most effective at getting shares are live video, stories, and feed posts, while the top content types for shares are funny, interactive, and reflective of your brand’s values.

Now that you know how to reach 1,000 followers, you may be wondering how long it might take.

How Long Does It Take To Reach 1,000 Followers On Instagram?

Around 1 in 4 Instagram marketers reach 1,000 followers in 1-3 months, while 39% say it takes 4-6 months. Only 13% were able to reach the 1k milestone in under a month, and just 1% took over a year.

But just as you gain followers, it’s also possible to lose them. Let’s take a look at what has caused Instagram marketers to lose followers, so you can avoid those mistakes.

What Causes Instagram Marketers To Lose Followers?

Not posting enough and being too “sales-y” are the top culprits when it comes to losing followers. 1 in 3 Instagram marketers also report losing followers from posting too often and not being consistent with their brand voice or aesthetic.

Lastly, using “banned” hashtags can result in your posts being hidden. You can check if a hashtag is banned by searching it on Instagram and looking at the top or most recent posts — if those sections come up empty, it’s likely banned. what causes instagram accounts to lose followers

Speaking of hashtags, we asked marketers how many they use, and whether broad or niche hashtags perform better. Let’s take a look at the results.

Instagram Video Features

In line with Instagram’s video-centric changes, 82% of Instagram marketers currently post videos on the platform, and those who do are 16% more likely to say Instagram marketing was effective for their brand last year.

The most popular video formats among marketers are Instagram Live, posting videos to their stories, posting videos to their feeds, and Instagram Reels.most used instagram video features

So let’s take a look at some feature-specific data on each of these.

Instagram Live

Instagram live is not only the most leveraged video feature, but marketers who use it are 22% more likely to say that Instagram marketing was effective for their brand last year. Here are the content types that get the most engagement when going live on Instagram:

Instagram Stories

78% of Instagram marketers leverage stories, and those who do are 23% more likely to say that Instagram marketing was effective for their brand last year.

But how often should you be posting stories? 43% post stories multiple times a week, while 26% post multiple times a day, and 23% post daily.

How often do marketers use Instagram storiesAnother common question is how long stories should be. 75% of Instagram marketers who leverage stories say their audience watches 4-9 story pages before dropping off, with only 7% saying their audience watches the entire story regardless of length.

We also asked about the ideal number of stories to have up at once – 74% of Instagram marketers say 4-9 stories is best:

how many stories do brands have up at once

Curious about which story types are most engaging? Check out this post.

Instagram Feed Posts

Though not exclusive to video, the modern Instagram feed is dominated by video content. 80% of marketers post to their feeds in their marketing role, but the frequency of their posting varies, with 45% posting multiple times a week, 23% posting once a day, and another 23% posting multiple times a day.

how many times a day do instagram marketers post to their feeds

You may also be wondering about how long your captions should be when posting to your feed. 2 in 3 marketers say the optimal caption length to maximize engagement with a feed post is medium (31-50 words).

What is the optimal instagram caption length

For a deeper dive on this, check out this post on instagram video formats.

Next, let’s take a look at whether Instagram marketers are leveraging organic or paid media on the platform, and which performs better.

Organic vs. Paid Instagram Content

Among those who use a mix of paid and organic content, paid content is somewhat more effective for reaching business goals and for gaining followers.

organic vs. paid engagementHowever, effective marketers are 20% more likely to leverage both organic and paid content compared to those who described Instagram as ineffective for reaching their business goals in 2021.

Speaking of effective and ineffective marketers, let’s end with a look at what sets the two groups apart.

Setting Effective and Ineffective Instagram Marketers Apart

Lastly, we asked Instagram marketers whether Instagram marketing was effective or ineffective in 2021, and looked at the data by the two separate groups. Here are some of the biggest differentiators:what sets effective and ineffective strategies apart on instagram

As we end this post, here are a few themes we’ve picked up from the chart above, and the overall results of our survey:

  • Video is key: Instagram is constantly evolving to welcome more and more video formats. While you don’t need to create a large live video event, consider starting small with Reels as it is being favored by consumers and the Instagram algorithm.
  • Engage constantly: Whether you’re responding to their comments, exchanging DMs, or creating content that sparks a conversation – it’s important to ensure that your Instagram strategy caters to your audience and meets them where they are.
  • Social Shopping is the future: Shopping on social media is the future of e-commerce, and Instagram is the best place to do it. With a handful of shopping tools to choose from, there is no better time to get started.
  • Use Instagram for customer service: Using Instagram for customer service is a quick and convenient way to answer customers’ most pressing questions, and marketers who use it see high ROI.
  • Hashtags aren’t going anywhere: Hashtags are highly searchable, make your content more discoverable, and most marketers who use them plan to continue doing so. While you shouldn’t go overboard with too many hashtags, consider how you can leverage them creatively within upcoming content or if there are ways you can participate in hashtag trends on the platform.

More of Our Instagram Marketing Research

Check out these posts for a deeper dive as well as tips and tricks related to our Instagram marketing data.

Interested in learning even more about Instagram marketing and engagement from some of our expert partner brands? Be sure to download the free resource below.

Improve your website with effective technical SEO. Start by conducting this  audit.