Categories B2B

7 VR Marketing Examples to Inspire You in 2022

I won’t lecture you on the importance of incorporating virtual reality (VR) into your marketing strategy. What I will do, however, is share a few fun facts about VR and show you seven examples of how this technology is used for marketing a product or a brand.

Let’s start with some facts and figures you should know about VR:

  • Consumer and enterprise VR market revenue is expected to reach $6.71 billion by the end of 2022, and $12.9 billion by 2024.
  • Augmented reality, virtual reality, and mixed reality market size worldwide are expected to jump by more than 220 billion dollars between 2021 and 2028.
  • By the end of 2022, it is estimated that virtual reality hardware and software sales will generate more than $6.4 billion dollars in revenue.
  • By the end of 2020, the number of VR headsets sold is predicted to reach 82 million — a 1,507% increase from 2017 predicted totals.

VR is growing in its adoption, and adding it to your marketing channels in the coming year is at least worth considering.

Download Now: Free Content Marketing Planning Templates

What is VR?

VR, short for virtual reality, is software that immerses users in a three-dimensional, virtual interactive environment — usually by headset with special lenses — to simulate a real-life experience. Many VR experiences take place in 360 degrees.

Businesses can use VR to demonstrate and promote their products to potential customers. In fact, many industries have used VR to transport people to places they might otherwise have to travel to or simply imagine.

Before we dive into some examples of businesses that have used VR for marketing, it’s worth noting that virtual reality has a few key differences from another term you might’ve heard before in the same sphere: augmented reality. The video below runs through the key differences.


Seeking inspiration for your own VR marketing campaign? Look no further. Below are seven of our favorite VR marketing campaigns and how they served the company’s marketing strategy.

1. Gucci Town

High-end fashion house Gucci recently launched Gucci Town, a virtual world within the Roblox metaverse. Players can explore the town, learn about the house’s history, and connect with other people in the game.


The interactive elements of Gucci Town are the mini-games, the browsable art exhibitions, and the Gucci store where people can purchase clothes for their Roblox avatars. When users wear the clothing they’ve purchased, they can spark conversations with others that are curious about the unique items and, as a result, are inspired to visit and discover what the town has to offer.

2. Etsy Virtual House

In 2021, Etsy debuted its virtual home feature that allows shoppers to “walk through” a virtual house filled with curated Etsy items. The homes are individualized and include photorealistic and true-to-scale renderings, seamless navigation, and 360-degree visuals.

For now, the Etsy Virtual House is available to shoppers during the holiday season. Each one-of-a-kind home is filled with holiday decor, gifts, Etsy Design Award winners, furniture, artwork, and other items.

Everything in the house is shoppable. All shoppers have to do is hover over an item, and a pop-up will appear with additional information and a link to purchase. The goal, according to Etsy, is to help shopping picture how the items would look in their home.

etsyImage source

3. Nikeland

Nike took its first step into the metaverse by partnering with Roblox to create Nikeland — a virtual world, modeled after the Nike headquarters in Beaverton, Oregon. Nikeland consists of Nike buildings, fields, and areas where players can compete in different minigames.

Nike motionImage source

Real-world movements power online play, and movements are tracked by accelerometers on users’ mobile devices. For example, motion in real life can translate to long jumps or speed runs in Nikeland. The virtual space also includes a showroom where players can buy Nike’s latest digital products for their avatars. The products include Nike’s Air Force 1, Nike Blazer, Air Force 1 Fontanka, and Air Max 2021.

Nike digital gearImage source

4. Wendy’s Metaverse Restaurant

In March, 2022, Wendy’s launched Wendyverse — a virtual restaurant on Meta’s Horizon World’s Platform. In a blog posted to Meta, the restaurant chain said users will be able to “walk behind the counter, interact with friends, and embark on a mouth-watering adventure.” Visitors to Wendyverse can play games like basketball and find easter eggs that include surprises like free food.

“For years we’ve been meeting our fans in unexpected ways and places with our unique approach to social media, gaming and engagement,” said Carl Loredo, Chief Marketing Officer for The Wendy’s Company. “We’re excited to take this to the next level by launching the Wendyverse in Meta’s Horizon Worlds and bringing a totally new dimension of access to our fans.”

wendyverseImage source

5. Samsung 837X

At the start of 2022, Samsung launched its own immersive virtual world called 837X. The world is modeled after its flagship store in New York City. The world has since evolved to include a customization-focused quest called “You Make It.” Described by the company as a “choose-your-own-journey” quest, You Make It consists of bright colors, various detailed landscapes, and three magical characters to join the user on an adventure.

samsungImage source

6. McDonald’s VR Zodiac Exhibition

From Jan. 31 to Feb. 15, McDonald’s created a virtual reality hall showcasing the Chinese Zodiac. The restaurant chain collaborated with designer Humberto Leon, who is of Peruvian and Chinese descent, to create the virtual exhibition.

Leon praised the project for showcasing a piece of Asian-American culture.

“It was a dream come true for myself to work with McDonald’s, because I feel like it’s the quintessential pop culture brand,” Leon said.

Visitors to the exhibition were able to explore and learn about each zodiac animal and get their fortune for the year. They could also download their signs’ information and personal horoscopes.

McDsImage source

7. A Tribal Past: Bear River, a Nation: What Can Eeling Teach Us?

In partnership with Oculus, Jessica Cantrell created a 360° film project where tribal members shared their stories and reconnected young people with their community’s past.

It was a form of community storytelling that leveraged an emerging VR tool to market the story and to help members of a historically marginalized community learn more about their culture.

Navigating VR in Marketing

As you read this, you might be thinking, “Why should a small-business marketer like myself be learning about high-priced VR campaigns?

Well, although VR might be too costly for many marketing budgets, it’s getting more and more prevalent. As it grows, we’re seeing a handful of brands leverage it for product promotion and virtual storytelling. And, while you might not be able to create a VR-based campaign, you can gather some great takeaways related to marketing innovation, content marketing, or visual storytelling — which can give you other ideas on how to better interact with your digital audience.

Want to see how other emerging technologies will impact your marketing? Check out A Practical Approach to Emerging Tech for SMBs: AI, Blockchain, Cryptocurrencies, IoT, and AR/VR.

New Call-to-action

Categories B2B

Phone Photography 101: How to Take Good Pictures With Your Mobile Device

Before the days of smartphones — if you can remember such a time — taking a great photo was a labor-intensive process. Now, it’s easy to master how to take good photos with your phone — no fancy cameras or desktop editing software required.

Brands are catching on, too — these kinds of visuals remain important to marketing. But make no mistake: Taking a great photo on your smartphone is not as simple as pointing and shooting. There are plenty of bad smartphone photos out there — I’m sure you’ve seen at least a few.

Download Now: The Marketer's Guide to Photoshop

What’s the secret to taking great pictures with your smartphone, then? As it turns out, there are a few of them. Check out these tips below to improve your smartphone photography game. (And once you have the photo-taking part down, check out some of the best photo editing apps for mobile.)

How to Take Good Photos With Your Phone: 25 Tips & Tricks

1. Use gridlines to balance your shot.

One of the easiest and best ways to improve your mobile photos is to turn on the camera’s gridlines. That superimposes a series of lines on the screen of your smartphone’s camera that are based on the “rule of thirds” — a photographic composition principle that says an image should be broken down into thirds, both horizontally and vertically, so you have nine parts in total.

According to this theory, if you place points of interest in these intersections or along the lines, your photo will be more balanced, level, and allow viewers to interact with it more naturally.

how to take good photos with phone: rule of thirds

Image Source

To switch the grid on …

  • iPhone: Go to “Settings,” choose “Photos & Camera,” and switch “Grid” on.
  • Samsung Galaxy: Launch the camera app, go to “Settings,” scroll down and switch the “gridlines” option to “on.”

2. Set your camera’s focus.

Today’s phone cameras automatically focus on the foreground of your frame, but not every picture you take on your phone has an obvious subject. To adjust where you want your camera lens to focus, open your camera app and tap the screen where you want to sharpen the view.

If you’re taking a photo of something in motion, for example, it can be difficult for your camera to follow this subject and refocus as needed. Tap the screen to correct your phone camera’s focus just before snapping the picture to ensure the moving subject has as much focus as possible. A square or circular icon should then appear on your camera screen, shifting the focus of your shot to all of the content inside that icon.

3. Use HDR mode.

High dynamic range or HDR, is a camera app feature that helps balance the light and dark elements in a high-contrast photo. It can be used to give photos a more creative, or artsy vibe, but it is commonly used to produce an image that looks similar to how you see it with your eyes.

Often with smartphone cameras, it’s hard to get the perfect exposure for light and dark areas. You could be taking a photo of someone in a shaded area outside against a bright background or in a room with low light against a bright wall. Setting the exposure to the background could make the person being photographed underexposed. Conversely, setting the exposure to the subject could result in the background being overexposed.

HDR prevents this by retaining both the details in darker areas and shadows and bright areas. The iPhone takes photos in HDR by default. For android phones, you may need to adjust HDRsettings manually.

4. Use natural light.

It’s hard to find a great smartphone photo that was taken with a flash. Most of the time, they make a photo look overexposed, negatively altering colors and making human subjects look washed out.

Take advantage of the sources of natural light you can find, even after dark. This gives you a chance to play with shadows, like in the second image below, or create a silhouette with other ambient sources of light, like traffic and surrounding buildings.

how to take a good photo with phone: use natural lightImage Source

Once you’ve taken the photo, play with the “Exposure” tool in your favorite photo editing app to see if you can make the image slightly brighter, without making it too grainy.

5. Focus on one subject.

Many of the best photos include just one, interesting subject. So when taking a picture of one, spend some extra time setting up the shot. Some professional photographers say that the subject shouldn’t fill the entire frame, and that two-thirds of the photo should be negative space — that helps the subject stand out even more.

But be sure you tap the screen of your smartphone to focus the camera on your subject — that’ll help to ensure that it’s focused and the lighting is optimized.

Pro Tip: Once you’ve taken your photo, you can use filters and apps to make the subject even more vivid, or to crop it to frame the subject correctly. The brightness, contrast, and saturation of the photo can also be adjusted accordingly — all from your phone.

how to take good photos with phone: focus on one subject

Image Source

6. Hold your phone still.

While smartphones have given us the benefit of taking photos on the go, the cameras on our phones are still sensitive to movement. To help avoid blurry or warped photos, steady your camera first.

You can lean on a friend or wall to prevent your arms or hands from wobbling, or prop your phone up using books or similar objects to steady your phone.

7. Consider buying a mobile tripod.

Although mobile devices make it easy to snap any photo on the go, there’s never been an easy way to ensure the shot stays level and balanced when you shoot — especially if you want to be in the picture and not just take a typical selfie with your extended arm.

Mobile tripods give you the freedom to mount your smartphone for quick hands-free shots without lugging any heavy equipment with you. Most mobile tripods are barely bigger than your mobile device and can bend to any angle. Learn how these miniature tripods can help enhance your mobile video experience below.

8. Embrace negative space.

“Negative space” simply refers to the areas around and between the subjects of an image — and it can take a photo from “good” to “great.”

When you include a lot of empty space in a photo, your subject will stand out more and evoke a stronger reaction from your viewer. And what does negative space look like? It’s often a large expanse of open sky, an empty field, a large wall, or water, as in the example below.

how to take good photos with phone: negative space

Image Source

9. Find different perspectives.

Taking photos from a unique, unexpected angle can make them more memorable — it tends to create an illusion of depth or height with the subjects. It also makes the image stand out, since most mobile photos are taken either straight -on or from a bird’s eye view.

Try taking a photo directly upward and playing with the sky as negative space, like in the first photo below. Or, you can try taking it at a slight downward angle.

Pro Tip: If you take a photo and find the perspective is a little askew or tilted, use the SKRWT photo editing app to make the lines look clean and square.

how to take good photos with phone: perspective

Image Source

10. Play with reflections.

There’s something so idyllic about seeing the sky reflected in a body of water. There’s a reason why we love seeing that — our eyes are drawn to reflections. So look for opportunities to play with them in photos.

There are plenty of out-of-the-box places to find reflections — puddles, larger bodies of water, mirrors, sunglasses, drinking glasses, and metallic surfaces are just a few.

how to take good photos with phone: capture reflections

Image Source:

11. Use leading lines.

In some photos, there’s a line that draws the viewer’s eye toward a certain part of the frame. Those are called leading lines. They can be straight or curvilinear— think staircases, building facades, train tracks, roads, or even a path through the woods.

Leading lines are great for creating a sense of depth in an image, and can make your photo look purposefully designed — even if you just happened to come upon a really cool shape by accident.

how to take good photo with phone: leading lines

Image Source

12. Look for symmetry.

Symmetry can be defined as “a vague sense of harmonious and beautiful proportion and balance.” And pictures that contain symmetry can be incredibly pleasing to the eye — it’s also one of the simplest and most compelling ways to compose a photo.

In photography, symmetry usually means creating an image that can be divided into two equal parts that are mirror images of each other. That’s a bit different than reflections — symmetry can be found “in the wild,” as per the staircase picture, or you can set up your photo accordingly, like photographer Eric Christian did in the first photo below.

And remember — use those gridlines from tip #1 to line everything up perfectly.

how to take good photo with phone:symmetry

Image Source

13. Keep an eye out for repetitive patterns.

Repetitive patterns are very pleasing to the eye — they appear whenever strong graphic elements are repeated over and over again, like lines, geometric shapes, forms, and colors. These patterns can make a strong visual impact, and photographing something like a beautiful, tiled floor can be enough to create a striking image. Other times, it’s more fun to keep an eye out for where they appear naturally or unintentionally, like with the congruent fire escapes on the left.

how to take good photo with phone: pattern

Image Source

14. Play around with color blocking.

Isn’t it cool when an entire photo is black and white, except for a single object? It turns out that yes, indeed, there are apps for that. One of our favorites is Touch Color — an app that automatically converts a picture to grayscale and lets you fill in the parts you want to colorize.

Color blocking can help to highlight the elements of a photo that you want to stand out, like a plant or something else with a bold hue. It achieves a similar goal as negative space, in that it can help a single subject stand out — but with color blocking, the photo’s other elements remain intact for a cohesive image.

how to take good photos with phone: Color Effects

Image Source

15. Avoid zooming in.

When you take a photo from a distance, it’s tempting to zoom in on something specific you’re trying to capture. But it’s actually better not to zoom in — doing so can make the photo appear grainy, blurry, or pixelated.

Instead, try to get closer to your subject — unless it’s a wild animal, in which case we would advise keeping your distance — or take the photo from a default distance, and crop it later on. That way, you won’t compromise quality, and it’s easier to play around or optimize a larger image.

16. Capture small details.

You may have heard the phrase, “It’s the little things.” Sometimes, that also applies to photos. Close-up images that capture small, intricate, and delicate details can make for really compelling visual content. Keep an eye out for textures and patterns like peeling paint, a gravel road, or a tile tabletop.

Pro Tip: Use the “sharpen” tool in your favorite photo editing app to (conservatively) sharpen the details of your photo. You might also download the Camera+ app and use its Clarity filter, which is what The Wall Street Journal‘s Kevin Sintumuang calls the app’s “secret sauce — it adds pro-camera crispness to almost any shot.”

how to take a good photo with phone: detail tile patterns

Image Source

17. If you use flash, only do so during the day.

Sometimes, using your camera’s flash can improve a photo — but rarely does it do so at night. Because dark shots reveal a much sharper contrast against your phone’s flash, it can make any flash look invasive and uneven

In already well-lit spaces, however, a flash can help to soften some dark shadows behind or beneath your main subject.

When framing your next shot, look on the ground or against vertical surfaces for any dark shadows you might want to remove. If you see any, flip on the flash manually in your camera app. Setting your phone’s camera flash to “auto” won’t guarantee that your phone will notice the shadows you want to get rid of. Just remember to turn the flash off again when you’re done.

Consider the importance of flash for enhancing or hiding certain lines and features the next time you’re shooting product photography.

18. Set your camera app’s exposure manually.

Another mobile camera feature you’ll want to set manually is your exposure. Tapping your screen when your phone’s camera is on doesn’t just refocus the lens on a new subject — it also automatically adjusts how much light the camera lets in. This, too, won’t always look just right. It’s best to adjust it by hand.

To change your mobile camera’s exposure by hand, open your camera app and tap the screen. When you see the lens refocus, you’ll see a very small sun icon and a vertical scale. Slowly swipe your finger up and down this scale to adjust the light level.

19. Create abstracts.

Abstract photos are meant to capture the essence of an object, or a series of them, without revealing the entire landscape as a whole. In other words, they serve the purpose of creating unique, surprising images from ordinary subjects.

This look can be accomplished by cropping an abstract portion of an otherwise normal photo, or by taking close-up shots of objects that leave the viewer wondering — in admiration, of course — what the subject might be. And subjects with patterns or repetition are great candidates for abstract photography, like in the photo of sliced figs below.

how to take good photos with phone: abstract architecture

Image Source

20. Take candids.

Posed photos can be great for the sake of memories — happy moments with friends, family, or the occasional run-in with a celebrity. But sometimes, candid shots of people doing things, or people with people, can be far more interesting.

That’s because candid photos are better able to effectively capture the emotion and essence of a moment. One of the best ways to capture this kind of shot is to just take as many photos as possible. You’ll have more to choose from, and the best photos often happen when the “stars align,” so to speak, in a single moment — everyone’s eyes are open, one person is tilting their head just so, and you finally got a shot of your chronically closed-lip friend smiling with his teeth.

take good photos with phone: eating candid

Image Source

21. Be unconventional.

Composition is a huge part of what makes a photo great, but so is the photo’s subject. Some of the most delightful and remarkable photos come out of cool, unique ideas. Images are more effective than text at evoking emotion from your viewers — that often means getting your photos to say something.

Try thinking outside of the box when it comes to what you’re capturing — your viewers could be pleasantly surprised by a cool or unexpected subject.

leaf-dog-constellation

Image Source

Want more tips on creating visual content? Check out these examples of explainer videos.

22. Make ’em laugh.

Speaking of evoking emotion, sometimes the most memorable photos are the ones that make us giggle. The image below of an older woman wearing a brightly-colored shirt stating “Hi hater” is funny because it’s unexpected — and there’s a part of us that admires her, too. The second image of the dog toy on a dinner plate pokes fun at classic Instagram food shots, but it’s from a dog’s perspective. If you can make your audience laugh, they’re likely to enjoy your photo.

pug-eating-toy

Image Source

23. Clean your phone’s lens.

A smartphone camera might be more convenient to carry around than a full-fledged photojournalist’s camera, but it comes at the cost of protection.

Your phone is usually in your pocket or your bag when you’re out of the house. All the while, the device’s camera lens is collecting all kinds of dust and lint. Be sure to clean this lens with a soft handkerchief before taking a photo. You might not be able to tell just how dirty the lens was until you start editing your picture, and making sure the lens is crystal clear before taking a shot can keep you from starting from scratch.

24. Attach an external lens.

Want to get really fancy? External lenses are for you. There are actually several out there that can be attached to the top of your smartphone’s native camera lens — from fish-eye to wide-angle lenses, these add-ons can bring an entirely new quality and perspective to your photos.

According to Wirecutter, the best camera lenses for iPhone photography are made by Moment, a manufacturer of mobile lenses. Start there, or do some research to find the lens add-ons that fit your smartphone photography needs.

Horses looking into fisheye external lens attached to phone camera

Image Source

25. Don’t be afraid to edit.

Composing and taking your smartphone photo is just the first step to making it visually compelling. Editing your photos is the next step — and a very critical one, at that. Filters can be a valuable photographic tool, particularly when it comes to two goals: 1) Removing blemishes from a picture, and 2) making food look even more delicious.

Beauty filters are a common fix— and now, the iPhone photos app offers many similar filters. There are also apps like Pho.to, which can automatically retouch facial photos without a lot of work. And when it comes to those photos of your daily meals? One of the latest apps available is Foodie, which comes with its own set of filters optimized for different types of food.

But there are many other great photo and video editing apps out there for mobile devices — check out this post to see some of the best ones out there.

Foodie

Image Source

Take Better Photos

Thanks to our mobile devices and the editing apps that come with them, we can now take high-quality photos and edit them without too many bells and whistles — all from the same device that we use to make calls.

Editor’s note: This post was originally published in November 2018 and has been updated for comprehensiveness.

Marketer's Guide to Photoshop

Categories B2B

How to Write a Powerful Executive Summary [+4 Top Examples]

Whether you’re an entrepreneur looking for investors for your small business or the CEO of a large corporation, an executive summary can help you succeed and is a critical component for long-term growth.

Download Now: Free Executive Summary Template

A short, attention-grabbing executive summary is an essential part of your business plan. Done correctly, it will ensure your company becomes or remains a key player in your industry. In this post, you’ll learn what an executive summary is and how to write one that engages investors, customers, and general audiences.

Essentially, an executive summary is the front cover of your business plan, convincing readers that it’s worth their time to read the whole thing.

A business plan includes a company overview, your company’s short-term and long-term goals, information on your product or service, sales targets, expense budgets, your marketing plan, and a list including each member of your management team. However, a CEO or investor might not have the interest or time to read your full business plan without first getting the general gist of your company or goals through an executive summary.

Ultimately, the executive summary is meant to inform readers of the most important information in your business plan, so they don’t have to read it all and can get caught up quickly.

To write an impressive executive summary that effectively embodies all the important elements of your business plan, we’ve cultivated a list of necessary components for an executive summary, as well as an example to get you started.

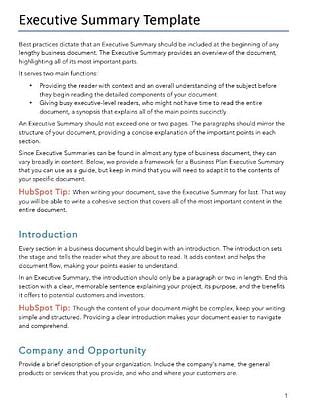
Follow Along With HubSpot’s Executive Summary Template

Executive summary template from HubSPOT

Click to Download

1. Tell your story.

When investors or CEO’s read your executive summary, they should understand what your business is about. This is one of the first elements of your business plan, so it should set the tone.

In your executive summary, be sure to tell your story. What does your company do and why do you do it? Who’s involved in your company? Answering these questions will help readers get excited about your company and eager to read the rest of the business plan.

2. Do your research.

An executive summary, while short, should include plenty of research. For example, your summary will include financial considerations and a competitor analysis.

While your business plan will flesh out the details, it’s important to include your key findings in your executive summary. Think of this like an elevator pitch. If someone stopped reading and you only had the executive summary to explain your company, what information would you include?

3. Pay attention to your tone.

The tone of your writing tells a story itself. When you’re writing anything, but especially a business document, make sure that the tone tells the story of who you are. Are you formal or more informal?

Ultimately, your tone should not only represent who you are as a company, but your target audience as well. What style of writing will represent your audience?

As you write an executive summary, don’t forget to consider what your tone and writing says about you and your audience.

4. Avoid cliché language.

With any style of writing, it’s best to avoid clichés. Clichés can convey the wrong message or be misunderstood, which is something you want to avoid when someone reads your executive summary.

Additionally, clichés tend to overpromise and under-deliver. For example, including something like “The Best Restaurant in Town” isn’t true because you’re untested as a business. Your executive summary should reflect the truth and who you are as a company.

5. Write it after completing your business plan.

An executive summary is a summary of your business plan. However, it’s hard to write a summary when you haven’t written your business plan yet. That’s why you should write your executive summary last, so you know what you want to include.

If you don’t have a business plan yet, don’t worry; we have a comprehensive business plan template to help you create one quickly and effectively.

Featured Resource: Business Plan Template

how to write executive summary: use business plan template from hubspot

Download Your Free Template Here

Now that you know how to write an executive summary, let’s dive into the details of what to include.

What to Include in Your Executive Summary

Your business plan should convey your company’s mission, your product, a plan for how you’ll stand out from competitors, your financial projections, your company’s short and long-term goals, your buyer persona, and your market fit.

An executive summary, then, should be a short, maximum two-page synopsis of the information provided in your business plan.

Ultimately, an executive summary should provide a preview for investors or CEO’s, so they know what to expect from the rest of your report. Your executive summary should include:

  • The name, location, and mission of your company
  • A description of your company, including management, advisors, and brief history
  • Your product or service, where your product fits in the market, and how your product differs from competitors in the industry
  • Financial considerations, start-up funding requirements, or the purpose behind your business plan — mention what you hope the reader will help your company accomplish

Feeling at a loss? Download a free template below that will take you through the executive summary creation process.

Executive Summary Template

executive summary template from hubspot

Download Your Free Executive Summary Template Here

In this free executive summary template, you’ll be able to outline several pieces of information, including:

  • Introduction: Explain what your executive summary contains.
  • Company & Opportunity: Explain who you are and your biggest opportunities for growth.
  • Industry & Market Analysis: Explain the state of your industry and your target market.
  • Management & Operations: Explain who your key leaders are and their roles.
  • Implementation & Marketing: Explain how you plan to deploy your product to the marketplace.
  • Financial Plan: Explain your company’s finances. Change the verbiage depending on whether you’re writing to investors or a general audience.
  • Conclusion: Summarize what you’ve covered.

Ready? Download your free executive summary template.

To understand more tactically how an executive summary should look, let’s review a few examples.

Executive Summary Examples

1. Connected

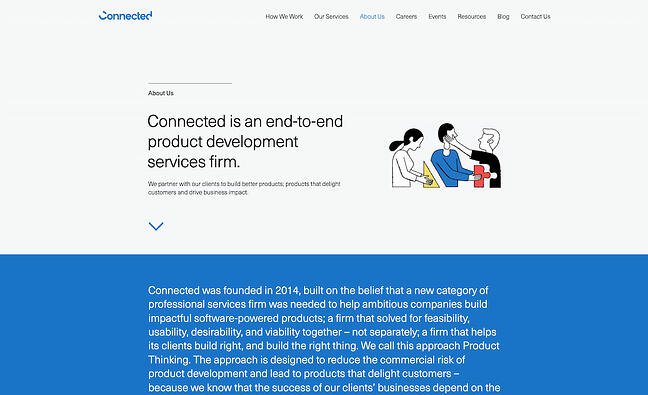
executive summary example: connectedConnected’s executive summary immediately grabs your attention with its headline, which describes what the company does in a succinct, clear way. Even if you don’t read the rest of the summary, you’ll understand what Connected does from the heading alone. The company then goes into its history, mission, and values at length.

Try It Yourself

Use the heading of your page to immediately describe what you do, as opposed to using “About Us” or “Executive Summary” as the title. Give readers the opportunity to get what they need above the fold and the option to read more. Note that this would not apply in an executive summary in a business plan.

2. Events Industry Council executive summary example: events industry council

Events Industry Council’s executive summary is short and sweet, yet provides plenty of information for readers to understand what the organization does and which products it offers. Note the brevity in the mission, vision, and values sections — that demonstrates that there’s no need to go on at length if it doesn’t suit you. The “Who we are” section has the most emphasis here, which is a powerful technique to draw readers’ attention.

Try It Yourself

Spend more time in the section that you feel your audience will care most about. If you’re pitching to investors, you might spend more time on the Market Analysis and Financials sections. If you’re writing for a general audience, you might focus on your company background.

3. Company Shop Groupexecutive summary example: company shop group

One of the first things you see when visiting Company Shop Group’s About Us page is its subheading: “Company Shop Group is the UK’s leading redistributor of surplus food and household products.” Like Connected, Company Shop Group includes what it does above the fold, so that readers have the option to either keep reading or walk away knowing what the company is about. The organization also includes multimedia to engage visitors and explain its business model in a more digestible format.

Try It Yourself

Include what you do above the fold and add multimedia elements to provide an alternative way for readers to learn more about you. Videos, images, and headings can make it much easier to scan your executive summary, but be careful to only use this method for the right audience and through the right medium. (You might not include images inside a formal business plan, for instance.)

4. FirstEnergyexecutive summary example: first energy

FirstEnergy’s executive summary is great inspiration if you’re a more corporate, formal brand. The company’s executive summary covers its mission, subsidiaries, operations, products and services, corporate responsibility values, and strategic plan goals. This is useful information for potential investors, as the company is publicly traded.

While it’s comprehensive, the executive summary remains short, using bullet points and images to break up the information and giving readers the opportunity to explore more with a sidebar menu.

Try It Yourself

Be conscious of the status of your company when writing your executive summary. If it’s publicly traded, you’ll want to include more information, such as your strategic plan and expansion opportunities. If you’re publishing your executive summary on your website, use a sidebar to allow readers to jump from page to page without leaving their place.

Start Your Executive Summary

An executive summary should be short and concise, but it should still convey who you are as a company. If you’re starting a company, remember to tell your story, while also including important background and financial information. A strong executive summary will pave the way for more investors to invest in your business and more customers to trust in your brand.

Editor’s note: This post was originally published in December 2018 and has been updated for comprehensiveness.

executive summary prompt

Categories B2B

HTTP 500 Internal Server Error: What It Means & How to Fix It

Troubleshooting an HTTP 500 internal server error is like solving a mystery.

You don’t know what exactly happened or why it happened — all you know is that something’s wrong and you need to fix it.

Free Guide: How to Run a Technical SEO Audit

To guide you through the hassle of troubleshooting the dreaded HTTP 500 internal server error, let’s go over what it exactly means and its most common causes and solutions.

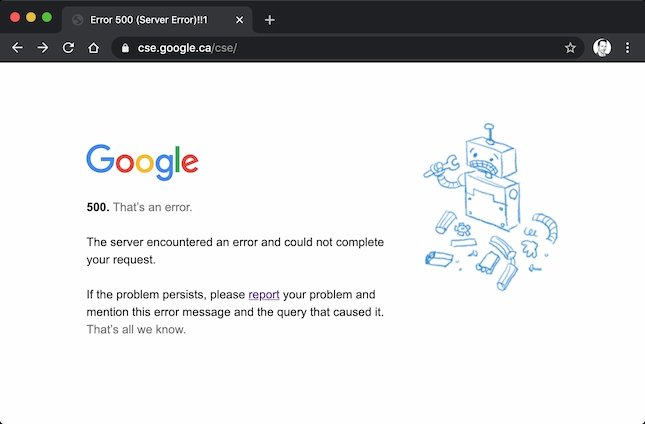
Here are some examples of what a 500 error page might look like in your browser:

screenshot of an http 500 internal server error message example

HTTP error 500 example: Dribble

Image Source

HTTP error 500 example: Google

Image Source

Other Common Error Codes

HTTP codes show you how your web browser and website communicate. These are some other common error codes you might see on your website:

HTTP 200

This is a standard status code for websites that are performing well.

HTTP 301

This is the code for permanent redirects. For example, say you have two site pages about widgets with duplicate information and one gets more traffic than the other. It makes sense to redirect the low-traffic page to the high-traffic page to improve SEO for your site.

HTTP 302

This code is for temporary redirects. This is for situations where you want to send users to an alternate page for a short amount of time.

HTTP 304

This code shows up when the website you’re requesting hasn’t seen an update since your last visit.

HTTP 403

This code comes from the server when you’re trying to access a restricted URL.

HTTP 404

A 404 code tells your users that your server can’t find that page they requested with their browser. 404 errors are common, and some sites use this to their advantage.

HTTP 405

This is an HTTP response status code error. It tells you that a web browser wants to access your web page and your server has rejected that specific HTTP method. This means that the browser can’t access the requested web page.

HTTP 410

This is a permanent code that tells site visitors that the page they’re looking for doesn’t exist.

HTTP 413

This code appears when a user tries to upload a file that exceeds the server’s file size limit.

HTTP 429

This error is a server response to stop sending requests because of overloaded resources. This code might show up if your site needs to make too many API calls to meet a request.

HTTP 503

This code tells users that the server is temporarily unable to load the page they’re looking for.

Check out this post for a comprehensive overview of error codes.

Potential Causes of a 500 Internal Server Error

A 500 internal server error is, as the name implies, a general problem with the website’s server. More than likely, this means there’s an issue or temporary glitch with the website’s programming.

Some potential causes of a 500 internal server error include:

Corrupted or Broken .Htaccess File

A .htaccess file is a text file with important server instructions. These instructions tell your software to enable or disable specific functions. They might help you protect passwords in a directory or restrict user access.

There are many ways to corrupt a .htaccess file. It can happen during plugin installation, file configuration, or while you are working on your server.

A Permissions Error

Permission errors come with file protection. Permissions errors might be bugs, user mistakes, or networking problems. Usually, this error means that the user isn’t allowed to perform the action they’re trying.

Faulty Third-Party Plugins or Themes

To increase user features and functionality, you might add a third-party theme or plugin to your website. These plugins can be great for your site, but they can also impact site security, bugs, and performance.

These plugins and themes are often created by individuals or small groups. This can be challenging because they may need more time to address bug fixes and vulnerabilities.

Exceeding the PHP Memory Limit

PHP is a server-side scripting language embedded in HTML. PHP is for managing content, databases, session tracking, and more. Each PHP process uses memory, and your hosting account has a limit for each one of these processes.

If a website needs more than this memory limit, you may see an HTTP 500 error.

HTTP Error 500 Browser Compatibility

Most businesses design their websites for maximum browser compatibility. This means that your website is easy to access and use on any browser or operating system. But your site may work perfectly in one browser and have issues or errors in others.

Because HTTP 500 is a catch-all error, you can see this error on any browser and in any operating system.

How an HTTP 500 Error Might Appear

This error can come up on any site you try to visit on a browser. Because it’s such a common error, there are many ways to communicate this code.

  • Internal server error
  • The page isn’t working
  • 500 Internal Server Error
  • 500 Server Error
  • 500. That’s an error.
  • HTTP 500.0 – Internal Server Error
  • Error 500
  • Error code: 500
  • The server returned a 500 Internal Server Error
  • Temporary Error (500)

How to Fix a 500 Internal Server Error

Unlike other server-side errors like a 502 code, a 500 internal server error is it doesn’t immediately tell you what the problem is, nor does it tell you how to fix it. If the error persists for too long on your site, it could even negatively impact your SEO.

So, let’s dive into some solutions so you can try to fix the issue.

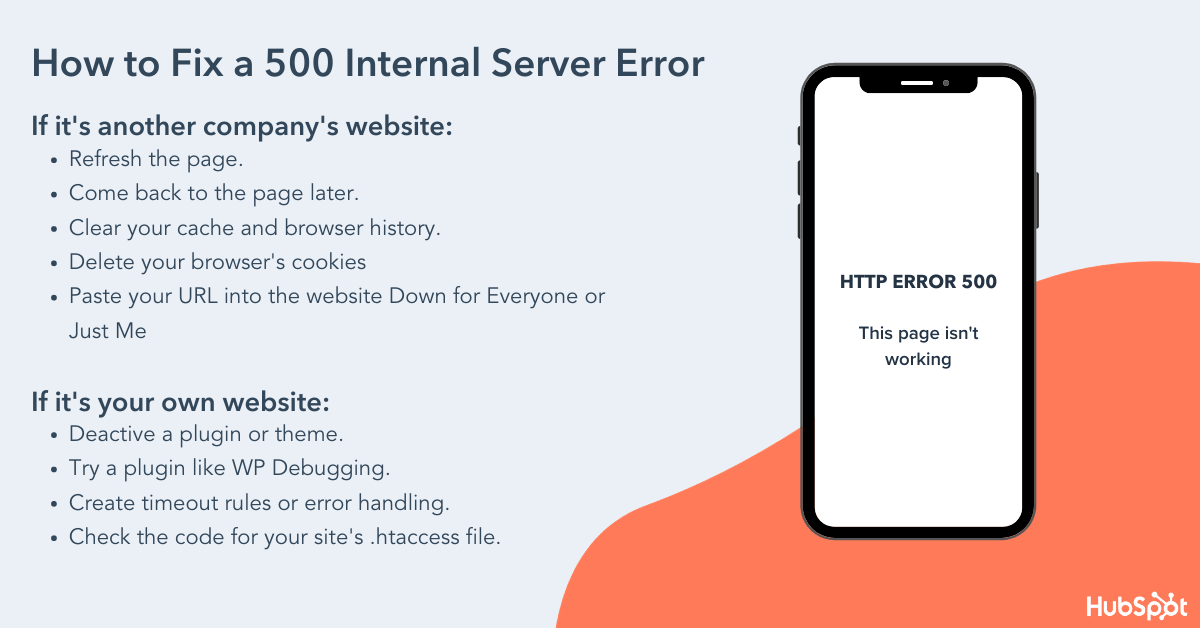
If You’re Trying to Load a Page with a 500 Internal Server Error:

1. Refresh the page.

This might seem obvious, but if it’s a temporary loading issue, you might find success if you refresh the page. Before trying anything else in this list, reload the page and see what happens.

2. Come back later.

Since the error is on the server side, I’m willing to bet the website owners are working as quickly as possible to resolve the issue. Give it a few minutes or up to an hour or so, and then reload the URL and see if the development team has fixed the issue.

3. Delete your browser’s cookies.

If clearing the browser history doesn’t work, you might try deleting your browser’s cookies. If the cookies are associated with the error-prone webpage, deleting the cookies might help reload the page.

4. Paste your URL into the website “Down for Everyone or Just Me.”

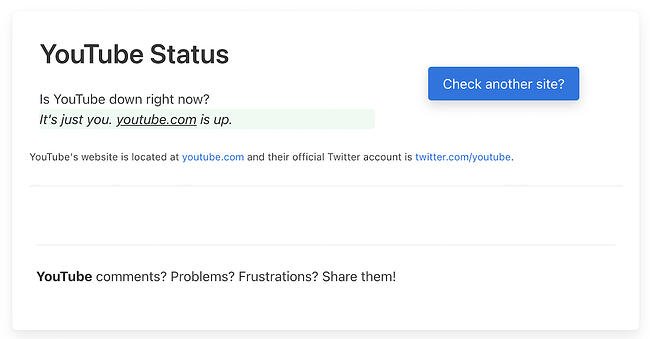
Head to downforeveryoneorjustme.com and paste in the URL where you’re seeing the internal server error. You’ll either be told that the website is only down for you, or that the website is down for everyone.

the homepage of downforeveryoneorjustme.com displaying the http 500 internal error status of youtube.comIf it’s a problem with your server, this should help assuage any concerns that it’s an issue with your own computer.

If the 500 Internal Server Error is on Your Own Website:

1. Deactivate a plugin or theme.

Newly activated software, add-ons, or third-party scripts might be conflicting with your current server configuration. To determine this, try (carefully) deactivating or uninstalling your software add-ons one at a time to identify what exactly is causing the internal server error.

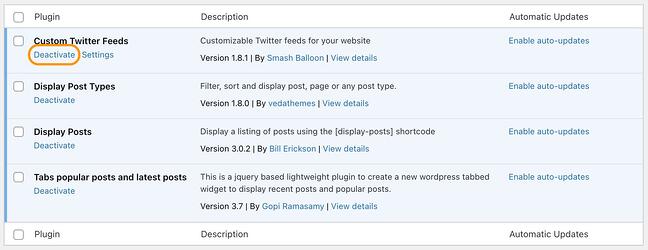
If you run a WordPress website, this is easy to do with plugins. From your dashboard, choose Plugins > Installed Plugins, then deactivate the first plugin. If the error resolves, you know this plugin is part of the issue. Reactivate the first plugin, then repeat this deactivate-reactivate process one at a time for all plugins to determine which ones are causing your error.

list of active plugins on a wordpress site and a deactivate button to resolve an http 500 internal server errorYou might find that having fewer active plugins on your site helps things run more smoothly.

Alternatively, if you just upgraded your software, your current plugins or themes might not be compatible with the new upgrade. Deactivating plugins or themes one at a time until the error disappears is the best way to find the root cause of your problem.

2. Use a plugin like WP Debugging to identify the issue.

If your site is powered by WordPress and you’re comfortable with WordPress debugging processes, consider installing a plugin to help you identify the issue with your server.

The debug plugin WP Debugging, for instance, helps you figure out exactly what’s wrong with your site, which will result in a speedier fix.

download page for the wp debugging plugin to help resolve the http 500 internal server error in wordpress

Image Source

3. Ensure your PHP setup is configured correctly.

If the issue is related to a PHP timeout, consider creating timeout rules or error handling in your script to resolve the issue. Here’s a full list of php.ini directives to configure your PHP setup.

Additionally, wrong permissions on a file or folder that has a script, like a PHP or CGI script, won’t allow the script to run. Check your permissions and make sure you set them correctly on your server.

4. Check the code for your site’s .htaccess file.

Incorrect coding or improper structure with your .htaccess file could be the reason you’re seeing the 500 internal error. The .htaccess file helps you manage how long resources should be stored in a browser’s cache. Try editing the file if you’re seeing a 500 internal server error.

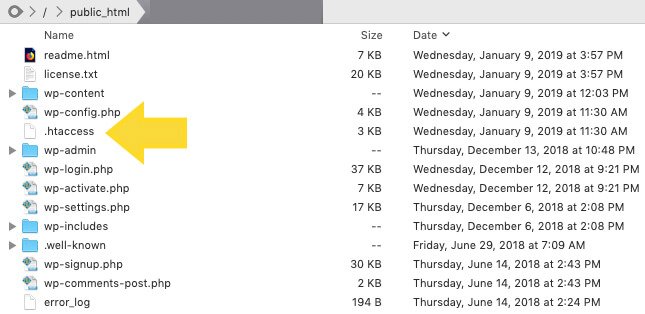
To locate your .htaccess file, access your website files through a file manager like cPanel or via FTP/SFTP. The file will probably be located in your public_html directory. There’s a good chance your server will hide this file from view by default and you’ll need to toggle hidden files on to see it.

a server file directory highlighting the htaccess file to resolve the http 500 internal server error

Image Source

Coding errors in .htaccess and custom scripts can also cause an HTTP 500 internal server error.

5. Ensure your new software is installed correctly.

Finally, check to see if your recently installed or upgraded software actually failed to install or upgrade. To refresh your software, check the vendor’s website for instructions.

How to fix a 500 internal server error

Last Resort: Ask a Server Administrator for Help

If troubleshooting popular software problems or debugging server-side scripts doesn’t fix your HTTP 500 internal server error, you should read about the most common causes for this type of issue in your server’s documentation — an HTTP 500 internal server error can occur in different operating systems for a multitude of reasons.

You can also ask your service provider to access your error logs and find evidence of the root cause of your problem.

Internal server errors are irritating because they’re unhelpful — it’s basically the web server’s way of saying, “Eh, I’m not sure.” Hopefully, one of the above steps will resolve the problem so you can get back to life as usual.

Editor’s note: This post was originally published in October 2018 and has been updated for comprehensiveness.

seo audit

Categories B2B

The Ultimate Guide to Google Analytics in 2022

Are you confused — even intimidated — by Google Analytics? Good news: you’re not alone. GA is notoriously complicated, and with the latest release — GA4 — things are just about clear as mud.

In fact, when I first started to delve into GA’s waters, I wondered if I’d ever truly get it. There were so many concepts to learn and reports to run. How did people ever conquer this thing?!

Free Guide: How to Run a Technical SEO Audit

Lots and lots of reading plus some trial and error, it turns out.

I’m not saying I’ve reached total mastery — there’s always something new to pick up — but I’m vastly more comfortable.

And I want you to be, too. So, here’s the cheat sheet for Google Analytics/GA4. This guide might be long, but it’ll take you from zero to hero in ~7,000 words. And if you still have questions, let me know! I’m @ajavuu on Twitter.

Before we move forward, you should know that there are currently two versions of Google Analytics: Universal Analytics and GA4.

What is Universal Analytics?

Universal Analytics is the current version of Google Analytics. If you set up your Google Analytics account before October 2020, you likely have Universal Analytics.

What is GA4?

GA4 is the latest version of Google Analytics. It has a slightly different UI and the reports, tools, and features have been upgraded. If you created a Google Analytics account after October 2020, you likely have GA4.

You’ll know if you have Universal Analytics or GA4 by the way your home screen looks. On the left is Universal Analytics and on the right is GA4.
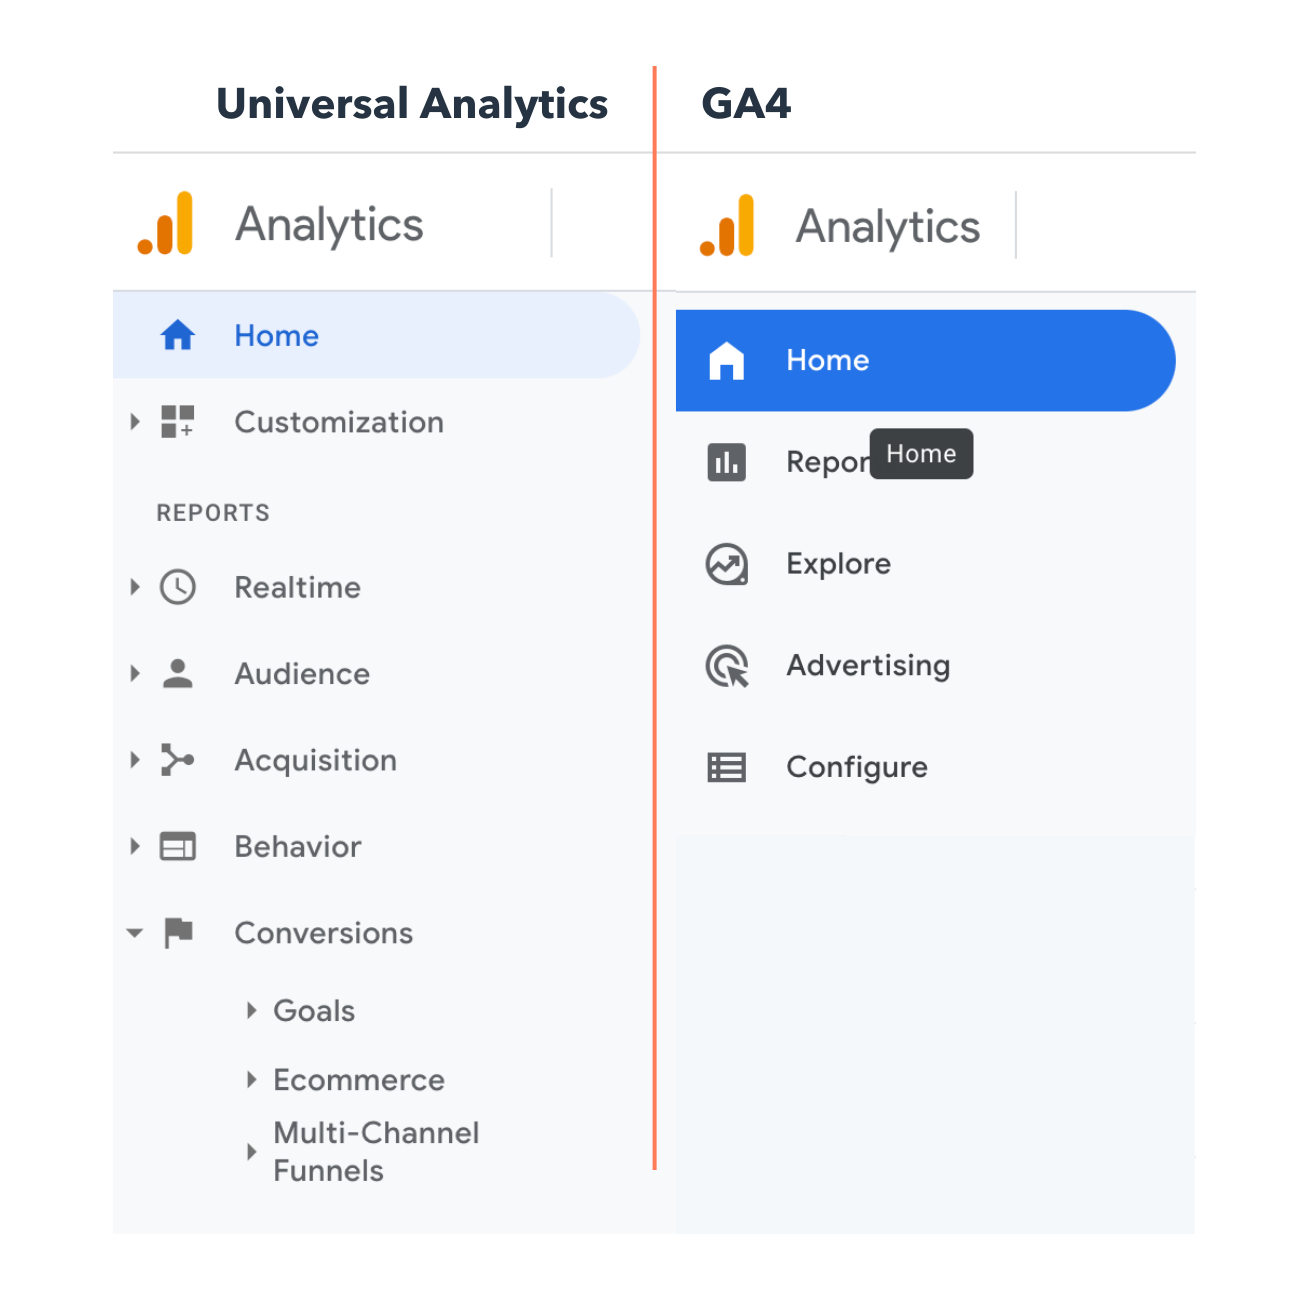
Google Analytics: Universal Analytics vs. GA4

Other marketing analytics options, such as HubSpot, can give you all the data you need with much less work.

Now, what steps will you need to follow when setting up GA? Good question.

Before you start using Google Analytics, you’ll have to set up a Google account. This means you must have a registered Google Account email address and password.

Once you’ve created a Google account, that doesn’t mean you automatically have access to GA — rather, you have to register for Analytics (which we’ll review how to do in the next section). But the important thing to note as you go to set up GA is that you can only access the tool by using a valid Google account.

Here are the steps on how to use Google Analytics for your website. (I’m using my class reunion website as an example.)

Step 1: Create a Google Analytics account.

First, you’ll have to create a Google Analytics account. Or, sign in to your current account.How to Create a Google Analytics Account: Step 1

Step 2: Add the name, URL, and industry of the website you want to track.

Choose which account you want to add the property to.

How to Create a Google Analytics Account: Step 2a

You should create and name your Property at this point and enter the website’s URL as well as industry and reporting time zone. Then you’ll be able to Create and Finish this step of the process.
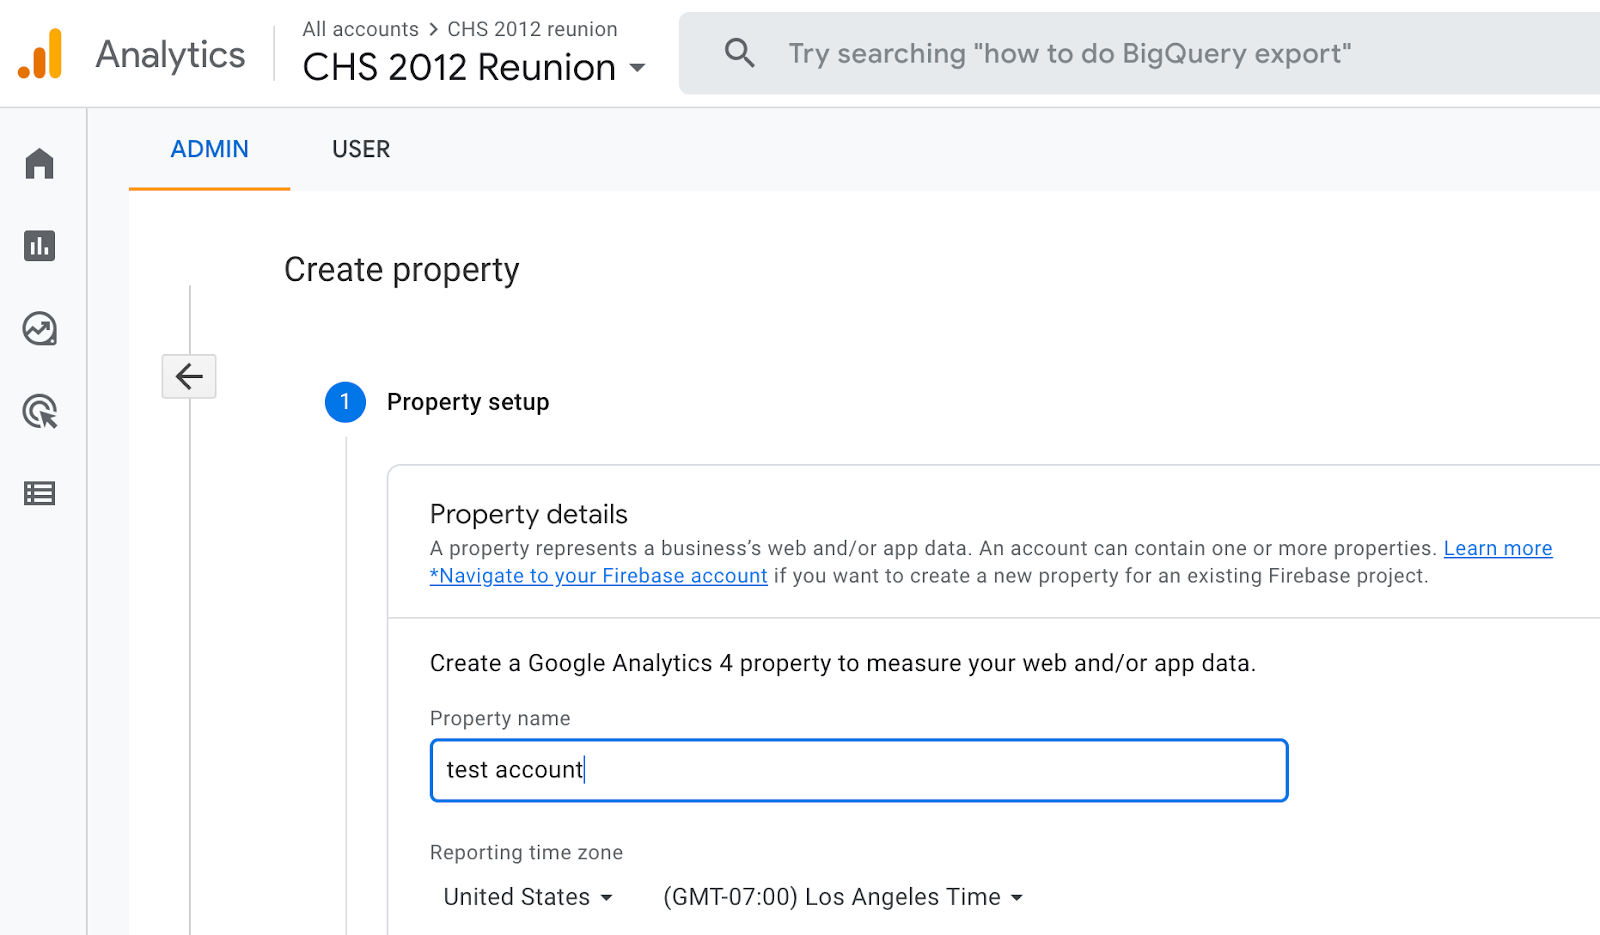
How to Create a Google Analytics Account: Step 2b

Step 3: Add a Data Stream or View to your property.

Note: GA4 no longer uses “Views” but it instead has “Data Streams” with similar functionality. Keep this in mind when sollowing these steps using Universal Analytics.

To add a view to your Universal Analytics account, go to the account and property you want to add a view to — use the menu to Create a View, name your view, select the type of view (web or app), and answer a few other questions. Remember, you can add up to 25 views to a property in GA.

How to Create a Google Analytics Account: Step 3a

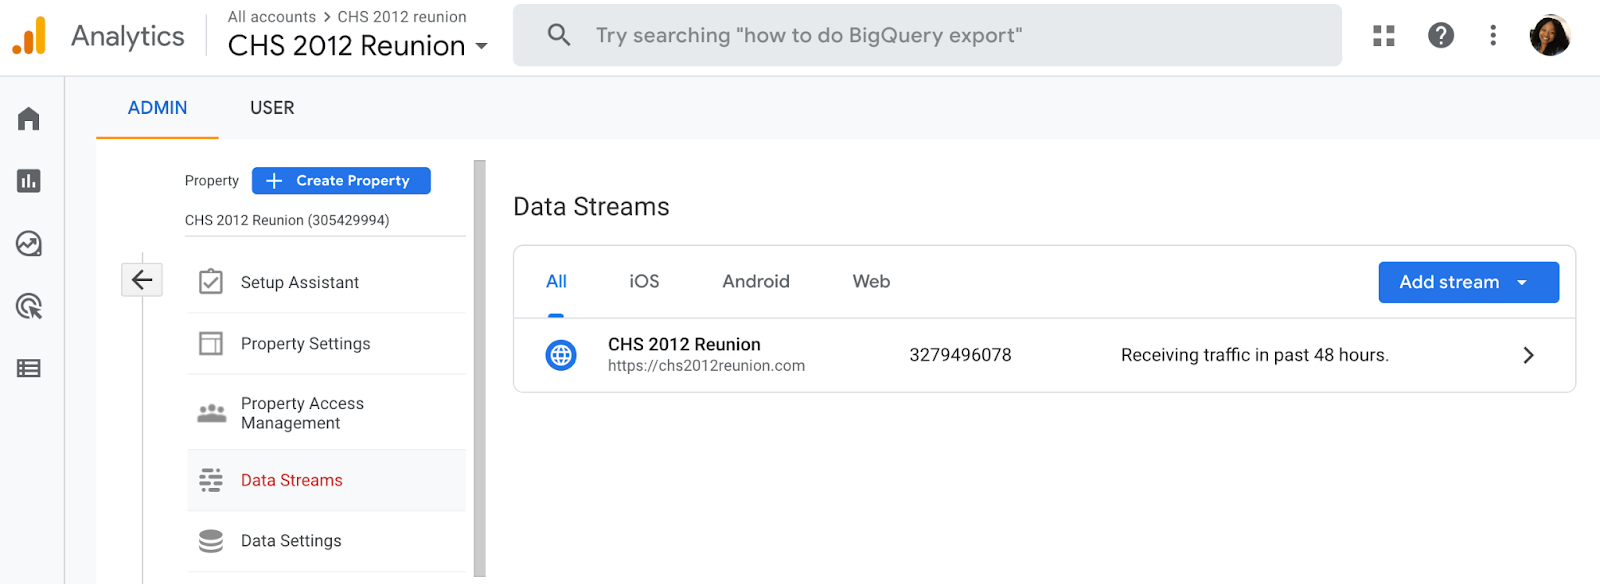
To add a data stream to your GA4 account, go to the account and property you want to add a data stream to — use the menu to add a Data Stream. Choose or add a stream, and save it.How to Create a Google Analytics Account: Step 3b
Step 4: Add your tracking code directly after the <head> tag of your site.

When you create a property, you’ll have access to a unique ID for tracking and a global site tag (code you need to add to each site page you want to measure). This is how you’ll be able to collect data in your property.

Then, paste your global site tag right after the opening <head> tag on each site page you plan on measuring.

You’ll be asked to choose your type of site (static, dynamic, web hosting, Google Tag Manager) so that you can set up the data collection accurately.

(For more, read our guide to installing the Google Analytics tracking code on your site.)

Step 5: Visit your GA portal and verify the code is working.

Lastly, verify your code is working. You can do this by looking at the Real-Time reports section while clicking around on your site in a different tab or on your phone. The report should show at least one visitor to the site (that’s you!)

How to Create a Google Analytics Account: Step 5

And that’s pretty much it! After that review, you may be wondering the following:

Do you need to add the GA code to every page of your site?

That’s a lot of manual work — especially if your website has more than 50 pages. Plus, what happens when you create new pages? Do you need to add the tag every time?!

The short answer is: no.

The longer answer: you only need to add the tag to every page template. So, if you have one page type on your site (meaning every individual page uses the same header module), you only need to add it to that module — and it’ll be applied to every page.

If you have two page types, you’d need to paste the code into the two separate header modules. Three page types? Three header modules.

And if you use a CMS like HubSpot, this task is even easier. These tools come with a separate field where you paste your tracking code just once. HubSpot users can follow these simple instructions for adding GA.

Additionally, to set up GA properly, you’ll want to understand the various layers of the tool — specifically, the hierarchy.

Understanding the Basics of Google Analytics

Google Analytics is made up of many parts, so it’s important to have a clear lay of the land as you begin learning. This section is dedicated to Google Analytics guidelines to help you master the basics of this powerful tool.

Google Analytics Hierarchy

Here’s a look at the GA hierarchy. Remember, Universal Analytics uses “Views” while GA4 uses “Data Streams”, so both are demonstrated in the visual below.
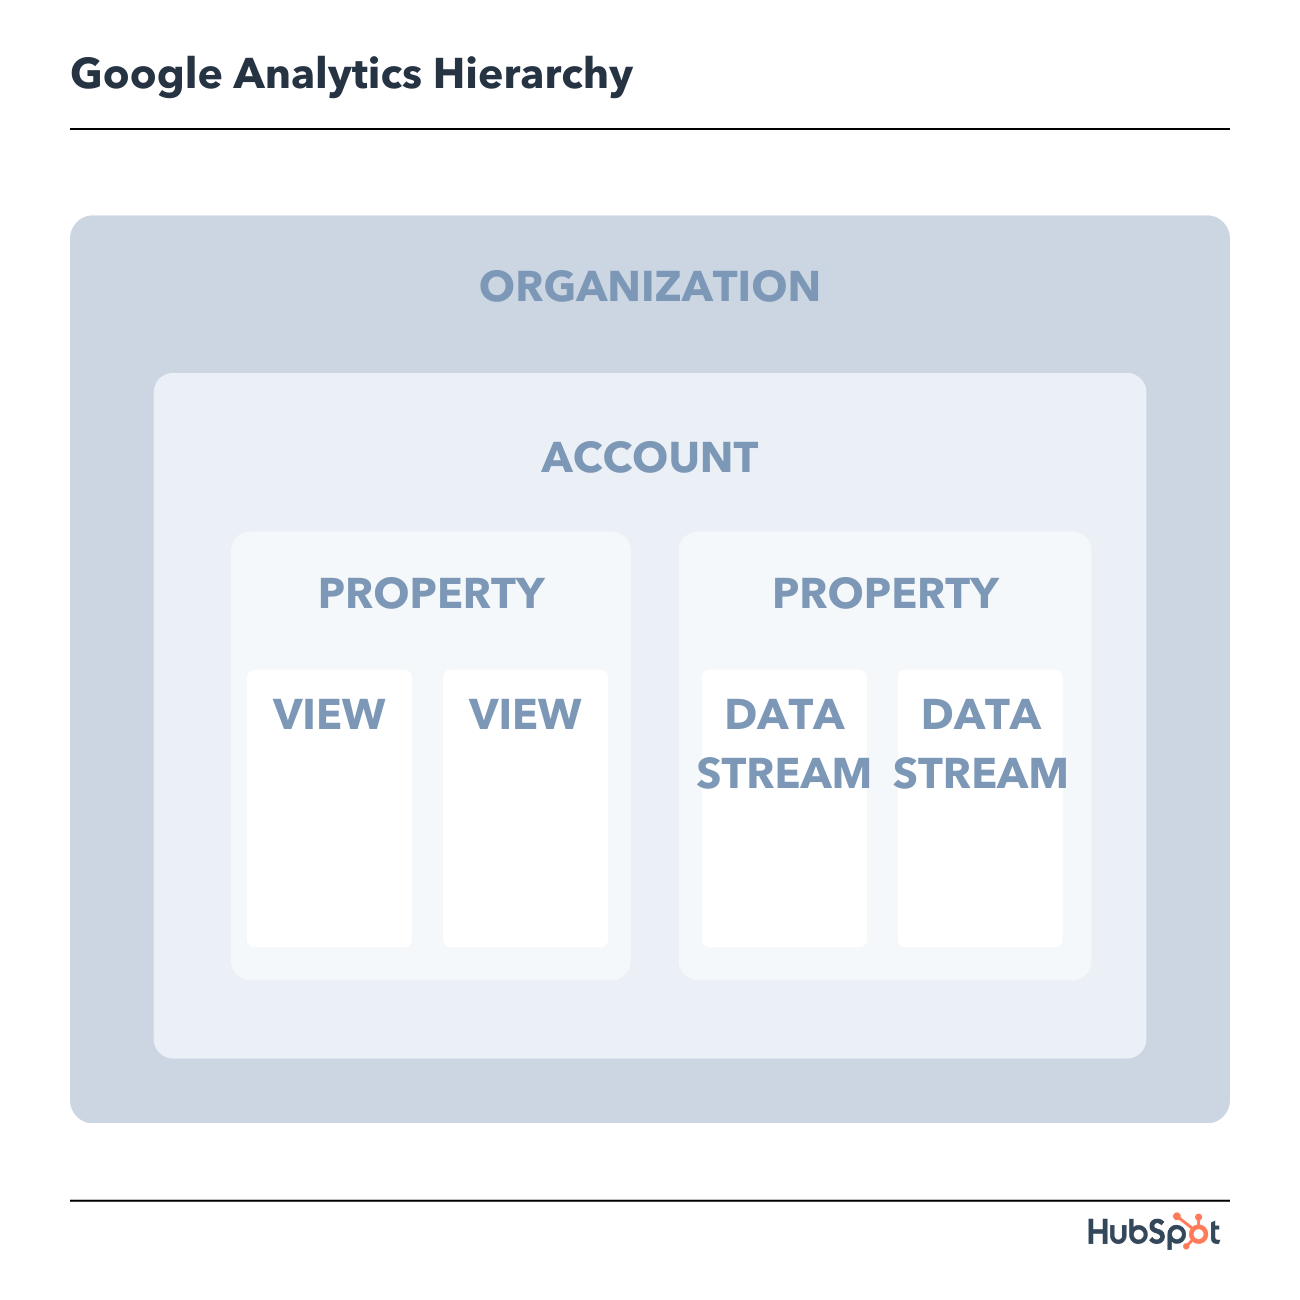
Google Analytics Hierarchy

Let’s dive into each of the sections within the hierarchy.

1. Organization

The organization is the highest level. It represents a company. For example, our organization is HubSpot, Inc. One organization can encompass multiple GA accounts.

Organizations are recommended for larger businesses, but not mandatory.

2. Account(s)

Accounts are not optional. Using Google Analytics requires at least one (sometimes several) accounts.

An account doesn’t mean a user account. I can log into the HubSpot Google Analytics accounts using my Google email ID. HubSpot’s head of technical SEO can also log into the same account using his Google email ID. Our historical optimization specialist can also log into the same account using his Google email ID.

Important details:

  • You can assign one property to each account or multiple properties to one account. Every account can hold up to 50 properties.
  • You can give user permissions for an entire Analytics account, a property in an account, or a view in a property.

You might be wondering, “What’s better: creating a new account for every property or adding every account to the same property?”

It depends on your use case and goals.

For example, suppose you have one website — the Stark Industries corporate site — and five subdirectories, including the Stark Industries blog, careers section, media resources, case studies, and investor relations information.

You want to create separate properties for each subdirectory so the people on each team can look at how their portion of the site is performing, as well as the larger site.

But maybe you have another site that discusses Tony Stark’s work with S.H.I.E.L.D. You want the S.H.I.E.L.D. team to see data for this subdirectory, but you don’t want them to see data for the rest of the website. You create a new account and property for the S.H.I.E.L.D. site.

3. Property

A property is a website or app. Each property can support up to 25 views.

4. View

At the minimum, you need two views per property:

  • One with zero configuration — essentially the “raw” version of the view
  • One with filters set up to exclude any traffic from within your company (i.e. a filter for your IP address) as well as bots and spam traffic

A view only captures the information after your filters and configured settings have been applied. And once you delete a view, that data is gone forever. For those reasons, it’s critical to keep an unfiltered view of your data.

5. Data Stream

A data stream in GA4 is a flow of data that gives you more insights into how your site is performing across different operating systems. There are three preset data streams you can choose from including web, iOS, and Andriod; or you can choose to create a custom data stream.

6. Google Analytics Dimensions and Metrics

To use GA successfully, you need to understand dimensions versus metrics. I’ve found the easiest way to think about it is:

  • Dimensions: categorical variables. Simple examples include names, colors, and places.
  • Metrics: quantitative variables. Basic examples include age, temperature, and population.

Or as my Data Analytics professor put it, “Metrics are what you can do math on.” Not the most eloquent phrasing, but it works.

Dimension Examples

  • Browser
  • Location
  • Landing page
  • Device
  • Customer type

Metric Examples

  • Sessions
  • Pageviews
  • Conversions
  • Bounce rate
  • Session duration

In any GA report, your dimensions are your rows and your metrics are your columns.

Google Analytics Metrics Example

Custom Dimensions and Metrics

GA lets you create custom dimensions and metrics from Analytics data plus non-Analytics data. To give you an idea, suppose you track the membership type of customers who have created an account in your CRM. You could combine this information with page views to see page views by member type.

Or maybe you run a blog. If you want to understand how audience engagement impacts other metrics (like conversions, pages per session, etc.), you could create three custom dimensions for each type of reader:

  • Advocate: user who shared one-plus posts on social media
  • Subscriber: user who signed up for your email list
  • Customer: user who purchased premium access

Using these dimensions will give you invaluable information.

7. Google Analytics Audiences

An audience is a group of users that have something in common. That commonality could be anything: maybe you’re targeting consumers in Australia, so you have an “Australian audience,” or you want to sell to millennials, so you have a “25-34 audience.”

GA comes with several built-in audiences (including the two I just mentioned, location and age). You don’t need to do a thing to set these up — once you have the tracking code installed, GA will automatically break down your visitor data into these audience reports.

However, you can also create custom audiences. Perhaps you’re only interested in “Australian millennials”; you’d need to make a custom audience that only includes visitors who are A) in Australia and B) between the ages of 25 and 34.

Creating an audience is fairly easy. Honestly, the hardest part is figuring out what you’re trying to accomplish and then identifying the user characteristics that’ll help you do that.

Once you’ve done that, follow these instructions to create a new audience segment. From there you can import a segment to use as the basis for your Audience Report.

8. Google Analytics Segments

A segment is a subset of your data. I like to picture an entire pizza made up of all different slices — one slice has pesto and mozzarella, another has sausages and spicy peppers, another has ham and pineapple, and so on. Metaphorically speaking, each slice is a segment.

You can create segments based on:

  • Users (e.g. users who have bought something on your site before, users who have signed up for a consultation, etc.)
  • Sessions (e.g. all sessions that were generated from a specific marketing campaign, all sessions where a pricing page was viewed)
  • Hits (e.g. all hits where the purchase exceeded $85, all hits where a specific product was added to the cart)

Like audiences, GA provides you with several segments. I wouldn’t stop there: you can get incredibly granular with your segments.

To give you some inspiration, here are a few of HubSpot’s segments:

  • Users who viewed a specific product page and watched the demo video
  • Users who viewed the same product page and didn’t watch the demo video
  • Users who view a specific Academy course page
  • Users who view a specific Academy lesson page
  • Users who view a blog post and a product page

The sky is your limit — well, that, and GA’s segment cap.

Google Analytics Reports

There are five primary reports available in Google Analytics that can give you insight into your website’s performance. You’ll find these reports on the lefthand size of the screen.

All of these options can be a bit overwhelming. And depending on which version of Google Analytics you have (universal analytics or GA4), you’ll see different reports.

Let’s walk through each report together. First, we’ll start with Universal Analytics reports and then move on to GA4 reports.

Universal Analytics Reports

1. Google Analytics Real-Time Report

Google Analytics Real-Time Report

As the name suggests, the Real-Time report gives you insight into what’s happening on your site at this very moment. You can see how many visitors are on your site, which pages they’re visiting, which social platforms they’re coming from, where they’re located, and more.

While this report is fun to look at occasionally, it’s probably the least valuable. Here are some ways to use Real-Time:

  • See how much traffic you’re getting from a new social or blog post
  • Know immediately if a one-day sale or event is driving views and/or conversions
  • Make sure tracking URLs and custom events that you’ve just set up are working as they should

These are useful, but as you’ll see, the other reports pack a far greater punch.

2. Google Analytics Audience Report

Google Analytics Audience Report

The GA Audience report gives you a high-level overview for the property you’re currently looking at. Check this report once a day to get a sense of how you’re trending overall.

Underneath “Overview,” you’ll see “Audiences,” as well as expandable menus for “Demographics,” “Interests,” “Geo,” “Behavior,” “Technology,” “Mobile,” “Cross-Device,” “Custom,” and “Benchmarking.”

Explore each of these sections to get a sense of what they can tell you about your visitors.

Every section describes an audience.

Active Users

Whoever named this report belongs in the same group as the person who named guinea pigs: “active users” doesn’t refer to users currently on your site — that’s the Real-Time report — and guinea pigs are neither pigs nor from Guinea.

The Active Users report shows you the number of users who visited in the last day (1-day active users), week (7-day active users), two weeks (14-day active users), and four weeks (28-day active users.)

Google Analytics Active Users Report

What’s the value of this report, you ask?

If you have more one-day users than longer-term ones, you’re struggling with retention. People aren’t coming back to your site or app — you need to figure out why.

I’d also recommend looking at this report with various segments; for instance, perhaps you see that users in a certain age bracket have much better retention than the average.

Lifetime Value Report

First things first: do you need a refresher on Customer Lifetime Value (CLV) and how to calculate it? We’ve got you.

The Lifetime Value report gives you a sense of how valuable users are to your company. You can see lifetime value for, say, the users you generated from email marketing versus the ones you acquired from organic search. Armed with this information, you can decide which channel to invest more in.

A few notes: Lifetime Value is capped at 90 days. The Acquisition date range, however — which you can adjust — reflects all the users you acquired in that time frame.

Imagine you’re interested in looking at transactions per user for users you acquired in the week before Black Friday. You’d adjust the date range to that week specifically. Then you’d see the average transactions per user for that cohort over the following 90 days.

Because HubSpot is a SaaS company, not an ecommerce business, I look at goal completions per user, page views per user, and sessions per user by Acquisition Channel.

If my team has recently wrapped up a marketing campaign, I’ll look at the same metrics by Acquisition Campaign.

But if you are in ecommerce and want to see transaction and revenue data, you’ll need to have ecommerce tracking set up.

(By the way, here’s how to track revenue in HubSpot.)

Cohort Analysis

Some people have gone so far as to call Cohort Analysis “the single most powerful report in GA.”

So, how does it work? This report groups users by one characteristic — so far, “Acquisition Date” is the only “Cohort Type” you can use. By the way, Acquisition Date is the day a user first visited your website.

You have several options from there.

  • First, pick your cohort size: day, week, or month.
  • Next, pick your metric, or what you want to explore for this cohort. It can be further broken down into Per user, Retention, and Total.
    • Per user means the total count of that metric divided by the cohort size. So if you choose Transactions per user, for example, you’ll see the average number of transactions per user for that cohort.
    • Retention is simple: user retention, or the number of users who returned that day, week or month (determined by the cohort size you selected) divided by the total number of users in that cohort.
    • Total: the total number of sessions, transactions, etc. that occurred for that cohort size.
  • Choose your date range. GA lets you see up to three months of data.

Now let’s dive into reading the report, because it’s not obvious.
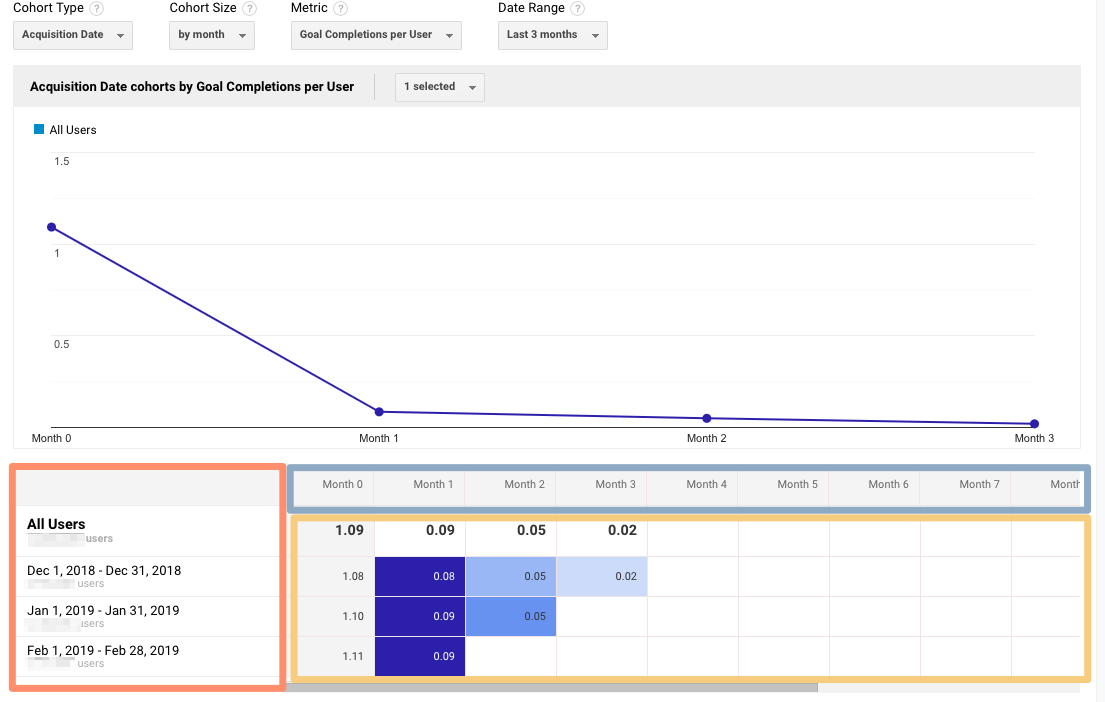
Google Analytics Cohort Analysis Report

The left-hand column shows you the Cohort Type you picked — Acquisition date, by default — broken down by Cohort Size (day, week, or month).

The first row shows you the totals for all the users in that cohort. Each row underneath that represents the activity in that day, week, or month (in this example, we’re looking at month.)

The row outlined in light blue reflects the Cohort Size you’ve chosen. Remember that data only goes back three months at the max.

The row outlined in yellow shows you the values for the metric you chose (in this case, Goal Completions per User). In the eternal words of Calvin Harris: baby, this what you came for.

Look at the first row. This tells you the average goal completions for the entire cohort in the first month after they were acquired was 1.09. Average goal completions for the entire cohort in the second month after they acquired dropped to 0.09. By the last month, it’s 0.02.

Now look at the next three rows. It looks like average goal completions per user in the first month after they were acquired increased slightly from December to January and again from January to February.

This is pretty usual behavior. Let’s imagine that instead, this report tells us average goal completions per user for February 1-28, 2019 (the last row) was 4.07. Woah! That’s nearly four times as high as December and January.

We’d definitely want to investigate further. And to do so, all we have to do is right-click on the cohort we’re interested in.

Make sure you click on the column if you want the entire day, week, or month analyzed. Click on a cell if you want to analyze only the users who, for example, completed a goal three days after they were acquired on February 27, 2019.

Google Analytics Cohort Analysis Report All Users

When you right-click, this box will pop up:

How to create a cohort segment in google analytics

Give this cohort a descriptive name. Change the views to “Any View” if you want to use this segment across your entire property (which I usually recommend), then click “Create.”

Voila — now you can compare this cohort to any other segment in any report you choose.

3. Google Analytics Acquisition Reports

Google Analytics Acquisition Reports

The Acquisition report breaks down your traffic by source: organic, direct, referral, email, social, paid search, display, affiliate, and (Other). (GA uses the (Other) category when it doesn’t know how to categorize a subset of traffic.)

From All Traffic, you can click into Channels.
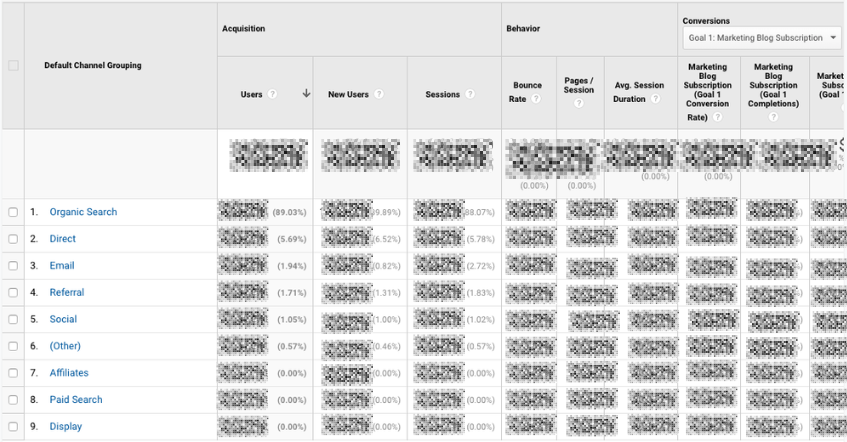
Google Analytics Acquisition Reports

Click on any category to explore each source in detail.

Depending on the category, you’ll see landing pages (which URLs your visitors entered the site on), source (which website brought them to yours), or keyword (which query took them to your site.)

Google Analytics Acquisition Reports Treemaps

To see this information presented visually, click on All Traffic > Treemaps. This post walks you through how to read and adjust the Treemaps report.

The next report, Source/Medium, breaks down the general category of traffic (which you saw in “Channels”) into the search engine or domain.

It’s useful if you want to get more granular insight into the ways people are coming to your site. For example, you might notice that a whopping 70% of your referral traffic is coming from LinkedIn, while just 5% is coming from Pinterest. Depending on your marketing team’s priorities it may be time to shift focus.

The last report, Referrals, reveals the specific URLs that sent people to your site, e.g. your referral traffic.
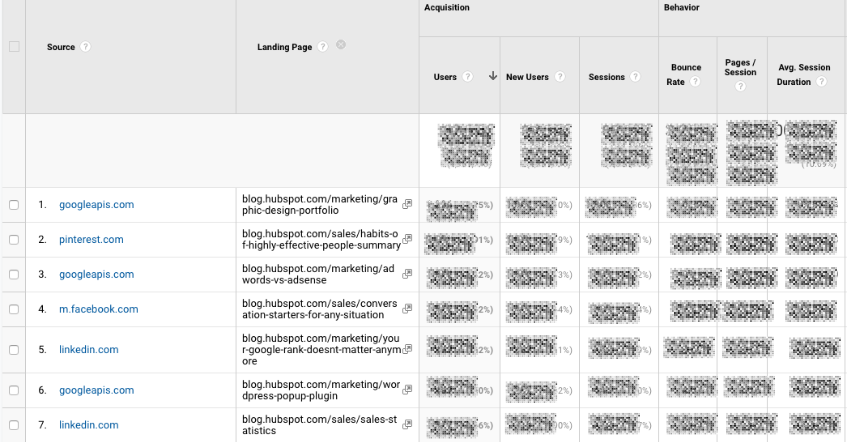
Google Analytics Acquisition Reports for referral traffic

I like to add “Landing page” as a secondary dimension so you can see which pages on your site are receiving the referral traffic.

4. Google Analytics Behavior Reports
Google Analytics Behavior Reports

Out of all the reports in GA, I use the Behavior ones the most.

Site Content

This report gives you a review all of the blog posts, landing pages, web pages on your site.

All Pages

Let’s start with Site Content > All Pages. This shows the top-trafficked pages for your current view and/or segment. It’s useful in and of itself — you should always keep a careful eye on your most viewed URLs — but I especially like it when I’m analyzing traffic growth or declines.

To give you an idea, maybe total traffic to my website has dropped 10% month over month. I’d navigate to Site Content > All Pages and change the date range to this month compared to the last month (making sure the days of the week match up).

Google Analytics Behavior Reports: All Pages

Then I can see the differences in page views by URL:
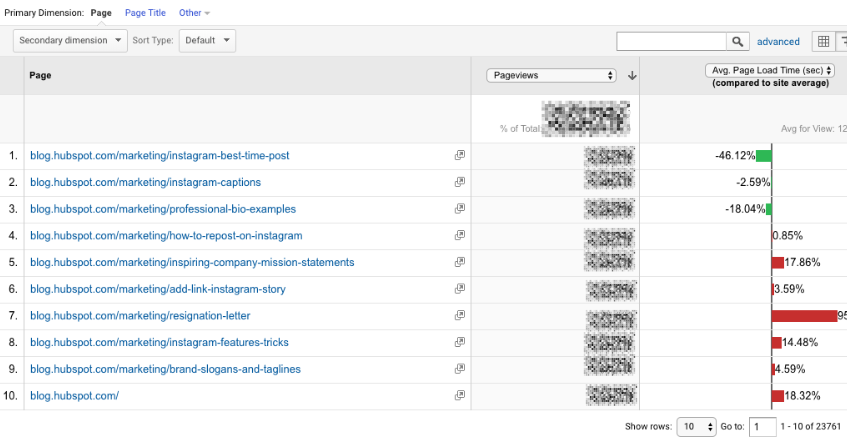
Google Analytics Acquisition Reports for all pages

This helps me identify which pages received less traffic and contributed to that decline.

Helpful tip: I like to change the “Sort Type” from “Default” to “Absolute Change” so I see the results sorted by the greatest differences in percentage rather than total views.

Google Analytics Behavior Reports: Absolute Change

I also add Page Title as a secondary dimension so I can see the name of each page alongside its URL.

Content Drilldown

This report breaks down the structure of your site by subdomain and then subfolder. To give you an idea, for HubSpot we can see data for each of our subdomains, including:

  • blog.hubspot.com
  • developers.hubspot.com
  • community.hubspot.com

And so on. If I clicked into blog.hubspot.com, I could then see aggregated data for:

  • blog.hubspot.com/sales
  • blog.hubspot.com/marketing
  • blog.hubspot.com/service

You get the drift. This report is probably most valuable for those managing highly complex properties.

Landing Pages

Landing pages is another one of my favorite reports. GA defines a landing page as the first page in a session — in other words, the visitor’s first interaction with your website.

There are a few ways to slice and dice this report.

First, if you’re interested in the sources (organic, paid social, direct, etc.) driving users to the landing page, you can add Source/Medium as a secondary dimension.

This is basically the opposite version of the report we added earlier.

Second, if you only want to see which landing pages users visited from a specific source, on a specific platform, or within a specific category, you can add the appropriate system segment:

Google Analytics Behavior Reports: landing pages

Maybe you’re most interested in the landing pages that mobile and tablet users see — so you choose the Mobile and Tablet Traffic.

Or perhaps you’re curious about users who ended up buying something, so you choose the “Made a Purchase” segment. There are lots of possibilities here.

Exit Pages

This report shows the last pages users visited in their sessions before they left your site.

That’s a little confusing, so let’s use an example.

I want to find a place to grab dinner with my friends so I search, “Mediterranean restaurants near me.” A place that looks good pops up, so I click on it. First, I check out the menu. They have a hummus sampler — yum. Then I click on their press page. It links to a recent article on Eater, so I leave the site to read it. The reviewer loved the food. I’m sold.

The Press page would be my exit page.

You may hear that you should analyze your exit pages to understand why users are leaving your site — I think this example reveals why that strategy doesn’t always make sense. Just because someone has left doesn’t mean anything is wrong with the content.

Check this report out but take the data with a grain of salt.

Site Speed

This report is pretty self-explanatory: it tells you how quickly your site is loading for users. Obviously, the faster the better — not only do faster pages correlate with higher revenue, but Google’s algorithm takes page load time into account.
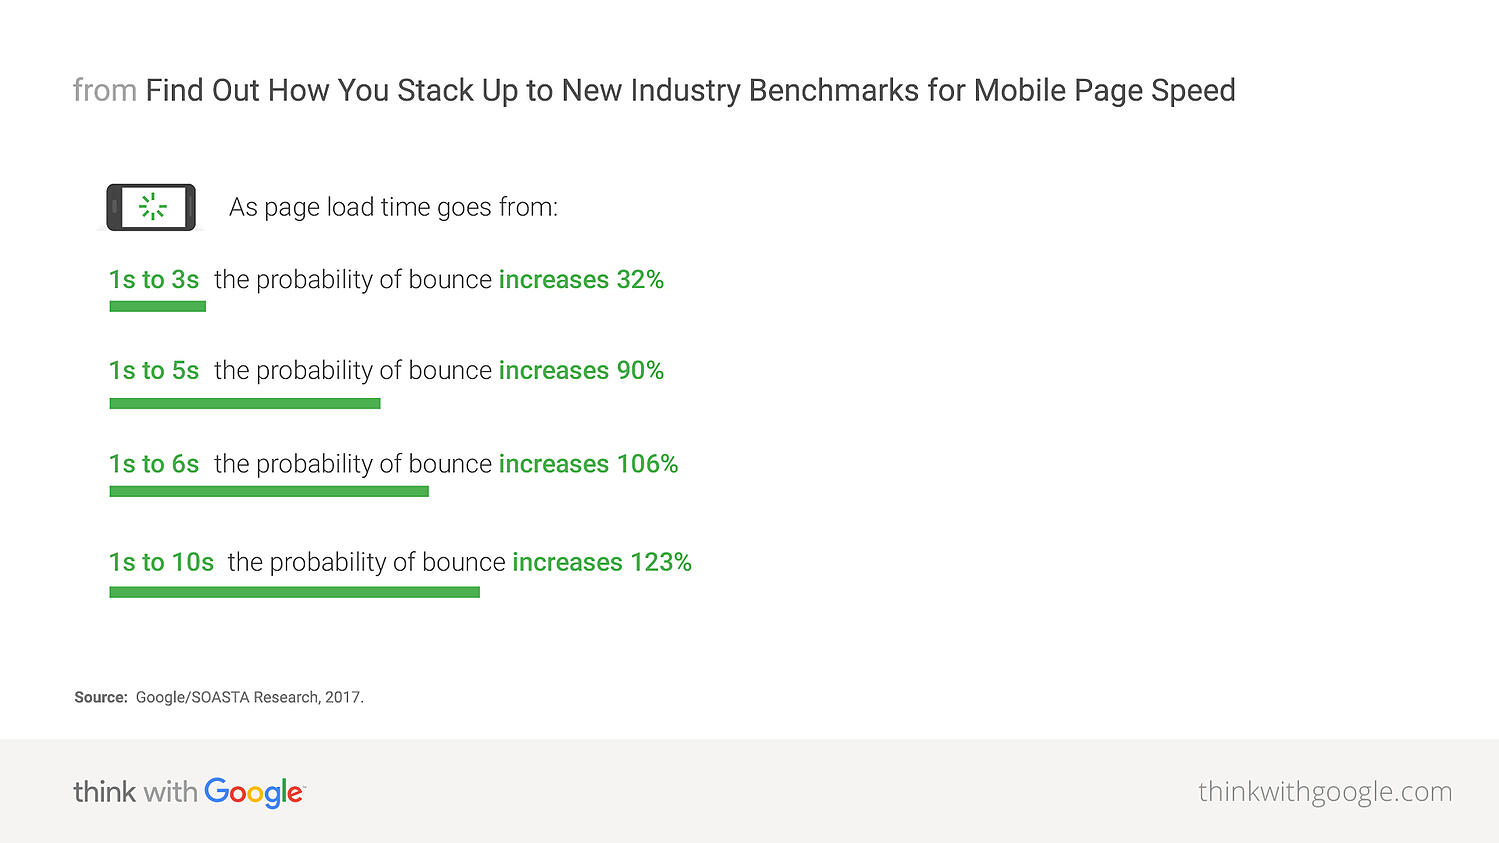
Site Speed report example

Site Speed Page Timings

This report delves into the average page load times for each URL. I use it to identify the slowest-loading pages on HubSpot’s site with the ultimate goal of figuring out why they’re taking their sweet, sweet time and how to speed them up.
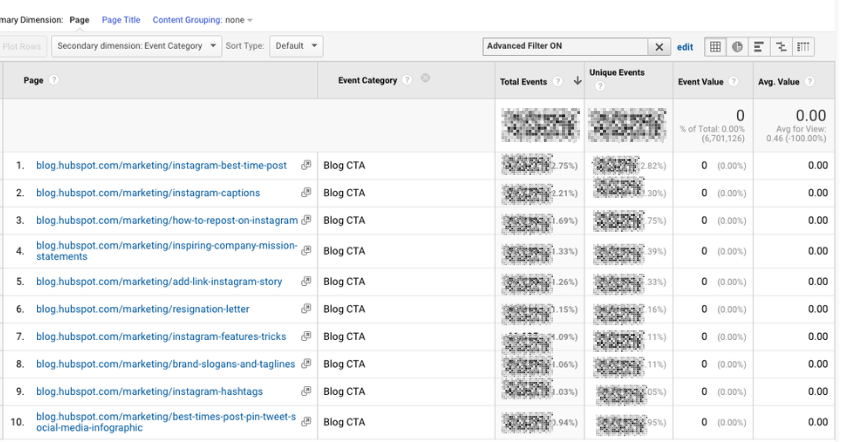
Google Analytics Acquisition Reports for site speed

The default metrics are page views and average page load time, but I also recommend looking at:

  • Avg. page load time and bounce rate
    • Change the Sort Type to “Weighted” so you see the blog posts with the highest page views first
  • Avg. page load time and page value

Site Search

First things first: if users can search your website, make sure you’ve set up Site Search in GA. You must enable it for every view separately (here are the step-by-step instructions).

Usage

I typically start with the “Usage” report, which tells me how many sessions occurred with and without one-plus searches. In other words, I learn how frequently people used site search for the view and time period I specified.

Search Terms

Here’s where you learn what people are searching for. Look for themes: if you see the same search terms coming up multiple times, there are a few conclusions you could draw.

Either you need to create new content that gives users the information they’re looking for, and/or you need to better surface existing content so it’s easier to find.

Pay attention to the “% Search Exits” column, as this tells you how many users clicked away from the search results page rather than choosing a result. You can usually infer there wasn’t a good answer for their question (or it wasn’t appropriately titled.)

Google Analytics Behavior Reports: Search Terms

Search Pages

This report displays which pages users are starting searches from. It’s important to think about this contextually. Maybe people are commonly beginning searches from your 404 page — that makes sense and isn’t anything to be alarmed about.

If, on the other hand, they’re starting searches from a product landing page, something’s wrong. The content clearly isn’t living up to the expectations they had when they clicked the ad link.

Loves Data provides a solid overview of GA’s Site Search reports if you want to explore them even further.

Events

A user clicks a button. Then they download a file. Next they watch a video.

No, this isn’t the world’s most boring bedtime story — it’s an example of a GA event. Three events, to be specific.

GA defines events as, “user interactions with content that can be measured independently from a web page or a screen load.”

Those user interactions are up to you; you’ll need to add special code to your site or app that tracks the specific actions you’re interested in. Here are the instructions.

If you’re not excited about events tracking already, I want you to get excited. There are infinite possibilities here: if you have an event set up for watching a product demo, and another for clicking a link to an external review of your tool, you can measure how many times each event happened.

Maybe you discover your video isn’t getting many plays. It’s probably time to optimize the current video, make it easier to find on your site, or create a new one. Or perhaps you see that way more users than you expected are checking out the third-party review of your product.

That tells you users want more social proof and testimonials. Since the review is favorable, you might want to put it front and center on your site.

Top Events

This report tracks the events taking place most frequently — pretty straightforward. You’ll see total events (e.g. how many times that event happened) and unique events (how many sessions included one or more occurrences of that event).

If you’ve set values for your events, this report also shows you how the total value of each event and its average value (or the total value divided by the frequency.)

Pages

In this report, you can see which pages generate the most actions. I typically add “Event Category” as the secondary dimension, then filter for the event I’m most interested in.

To give you an idea, my team tracks “Blog CTA.” This event fires whenever a user clicks a CTA embedded in a blog post. To get to the report below, I added “Event Category” as the second dimension, then filtered for “Page begins with blog.hubspot.com” (so I’d only see URLs on the blog) and “Event Category equals Blog CTA.”

Now I can see which posts generate the most CTA clicks. Hopefully, you’re starting to see the power of event tracking!
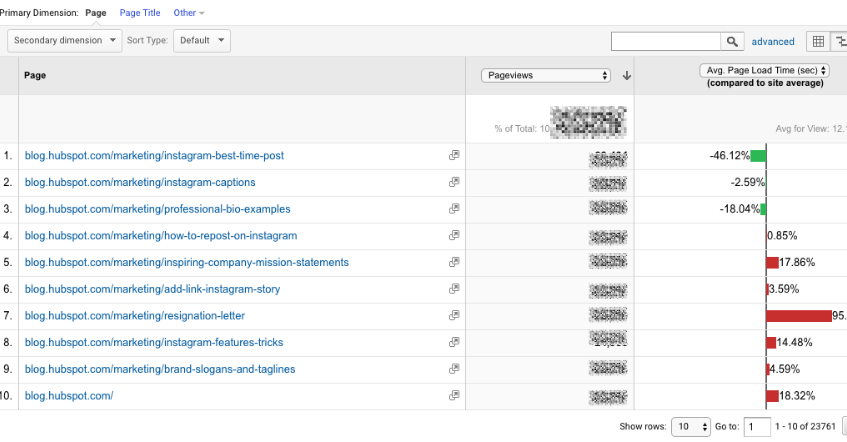
Google Analytics Acquisition Reports for pages

Events Flow

The Events Flow report tracks the order in which events take place on your site. It can tell you:

A. Whether particular events tend to happen first — and if they trigger other events

To give you an idea, maybe users frequently watch your demo video, then click the CTA to schedule a call with a salesperson.

B. Whether certain event categories are more common than others

Imagine you see that videos are played far more often than PDFs are downloaded.

C. Whether users act differently based on segment

For example, perhaps people coming in via organic scroll to the bottom of your pricing page far more than people coming in via social media.

Note:This report is very subject to sampling. (Read more about GA’s data sampling practices here.) Sampled data is usually pretty accurate, but it means the more important the conclusion you’re drawing, the less uncertainty you’ll be able to tolerate.

To reduce the level of sampling, make the date range smaller.

Publisher

If you monetize your website with Google AdSense or Ad Exchange, you can use the Ad Manager and Google Analytics integration to bring information on how your ad units are performing into GA.

I won’t go into any more detail here, but I recommend reading the following resources if you want to know more:

5. Google Analytics Conversion Reports

Google Analytics Conversion Reports

If you have a website, you have an objective — probably several — for the people who visit your site.

Ecommerce store owners want their visitors to subscribe to their mailing list, make a user account, add something to their cart, and/or complete the order confirmation process.

Media companies want their visitors to stay on their site for as long as possible and/or view a certain number of pages (all the better to maximize their ad revenue.)

B2B businesses want their visitors to download an ebook, sign up for a webinar, or book a call with a sales rep.

Google Analytics makes it possible to measure all of these things — plus many more.

A goal is essentially a conversion that you’ve defined (which is why this info shows up under the Conversion section.)

There are four main types of goals:

  • Destination: This goal is completed when a user reaches a specific page, like a product page, order confirmation page, or thank you page
  • Event: This goal is completed when a predefined event fires (like the Events you can set up as, well, Events — think watching a video or sharing something to social media)
  • Duration: This goal is completed when a user’s session lasts longer than a pre-set time
  • Pages/screens per session: This goal is completed when a user views a specific number of pages (or screens for an app) per session

Once you’ve identified your goals, take a look at these instructions for creating, editing, and sharing them. This guide on choosing goal values is also quite helpful.

Overview

Head here to learn how you’re doing goal-wise across the board. I get the most from this report when I compare date ranges and/or look at goal completions by segment.

For example, quickly looking at goal completions by device reveals mobile visitors sign up for the blog newsletter much less frequently than desktop and tablet visitors. That could be because it’s hard to sign up for the newsletter on a phone — or it could be mobile users are looking for one thing and ending their session as soon as they’ve found it. I should dig in more to decide which case it is.

Goal URLs

Knowing a goal was completed isn’t helpful in and of itself; you also need to know where it happened. Suppose you’ve embedded the same form in three separate pages on your site.

It’s great that Daenerys Stark from Dragonstone, Blackwater Bay just filled out your form to get in touch with a consultant, but which page did she fill it out on?

The Goal URLs report shows you. It breaks down conversions by “Goal Completion URL” (read: where it went down.)
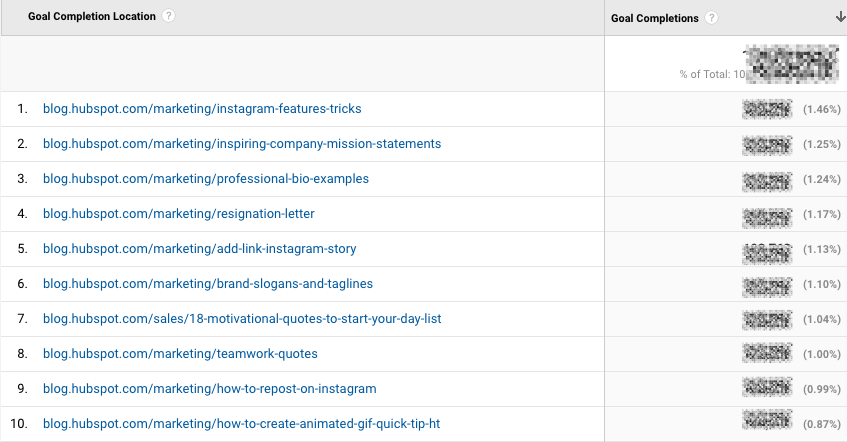
Google Analytics Acquisition Reports for goal urls

Reverse Goal Path

Reverse Goal Path is the unsung hero of the Conversion section. Well, I’m singing its praises now. This report allows you to see the last three pages a user visited before completing the goal.

It’s useful for goals that aren’t sequential. Maybe you have a contact form that appears in multiple places on your site, or there are two different paths that lead users into buying your ebook. Thanks to this report, you can understand the various ways people arrive at the end destination — and there’s no need to set up a funnel.

I usually filter down to a specific goal completion location or goal previous step 1, 2, or 3.

For example, since I’m interested in seeing which blog posts generated leads from content downloads, I added “Goal Previous Step – 1 containing blog.hubspot.com” to the filter.

Google Analytics Conversion Reports: Reverse goal path

Here’s what I got:

Google Analytics Acquisition Reports for reverse goal path

“(Entrance)” means the user came to the site on that step; “(not set)” means the user didn’t complete any steps prior to that one — because they weren’t on the website yet.

For a comprehensive exploration of Reverse Goal Path, take a look at OnlineMetrics’s guide.

Funnel Visualization

For sequential goals, Funnel Visualization is your go-to report.

Going back to the ecommerce example, the last goal would be “Arrived at the order confirmation page.” The goal before that, or goal #3, would be “Clicked checkout.” The goal before that, goal #2, would be “Added something to cart.” And the goal before that, goal #1, would be “Looked at product listing page.”

At each stage, you can see user drop-off. That lets you identify areas where you can improve conversion rates; for example, maybe you lose a lot of users during the checkout process. You change the flow so they can check out as a guest (versus needing to create an account), which dramatically reduces checkout abandonment.

To see this level of detail, you’ll need to map out your goals as a series. If all of your goals are simply the end objective, like “Arrived at the order confirmation page,” you won’t be able to reverse-engineer how users progress.

The Funnel Visualization report also requires you to mark the first step in the goal path as required or not. If you tell GA that yes, the first goal needs to be completed, Funnel Visualization will only show you the sessions where the user first finished goal #1. If a user skips goal #1 and goes straight to goal #2, their session won’t be represented here.

Goal Flow

If Funnel Visualization is the uptight relative who always made you take your elbows off the table and wash your hands before you ate, Goal Flow is the laid-back, fun relative who’d randomly take you out of school to go to the zoo.

All that to say: Goal Flow gives you a lot more freedom than Funnel Visualization. Unlike the latter, Goal Flow shows you all sessions that led to the completed end goal — regardless of whether the user completed the required goal #1 or not.

Another difference from Funnel Visualization: Goal Flow also shows you loopbacks — i.e. when a user goes back to a previous page or refreshes their current one.

If the user skips a step, Funnel Visualization “backfils” it. Goal Flow doesn’t.

If you edit an existing funnel or create a new one, Funnel Visualization will show you all your data from that moment onward. Goal Flow, on the other hand, can show you data from the past.

You can also toggle the Dimension and Level of detail of the report, as well as the segment, to get even more granular.

I recommend looking at various segments to see which convert at the highest and lowest rates — plus where they commonly drop out.
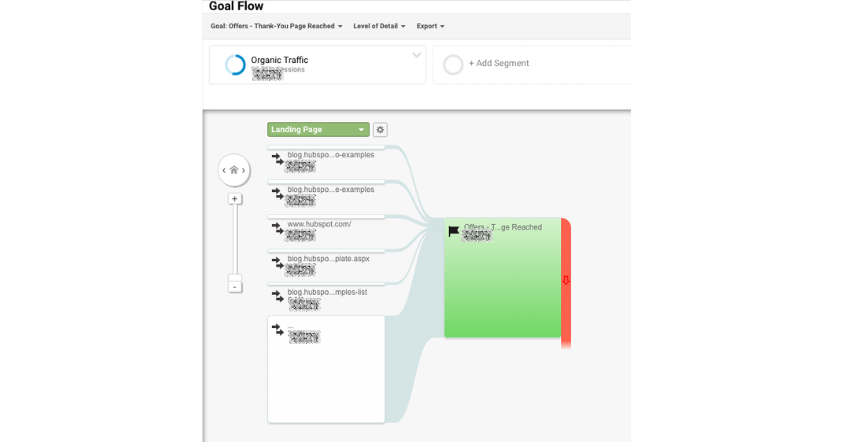
google analytics goal flow

Note: This report is subject to sampling. (Read more about GA’s data sampling practices here.) Sampled data is usually pretty accurate, but it means the more important the conclusion you’re drawing, the less uncertainty you’ll be able to tolerate.

To reduce the level of sampling, make the date range smaller.

Smart Goals

This report is helpful if you’re A) using Google Ads and B) not measuring conversions. Basically, Google uses machine learning to identify your “best” sessions — or those likeliest to generate conversions — and then translates those themes into Smart Goals.

Once you have Smart Goals, you can use them in Google Ads to optimize your ads performance.

Smart Goals are controversial within the marketing community because the data is minimal and businesses will be far better served by setting up their own conversion tracking. Keep that in mind if you decide to use them.

GA4 Tools

Although many of the tools, reports, and features of GA4 are similar to those from Universal Analytics listed above, there are some key differences we’ll address in this section.

1. Home

GA4 Tools: Home

The Home tab is a customizable dashboard of reports, stats, and other figures. You can adjust what you see in the Home tab so that you see a snapshot of the overall performance of your website.

In the example below, we can see users, new users, active engagement time, and total revenue because these metrics are most important for my site.

GA4 Tools: Home real-time report

2. Reports

GA4 Tools: Reports

The Reports tab shows the Reports Snapshot first which includes the same information from the Home tab in this example.

GA4 Tools: Realtime snapshot

You can also switch to other reports listed below:

  • Reports Snapshot
  • Realtime
  • Life Cycle
  • User

3. Explore

GA4 Tools: Explorations

Explorations in Google Analytics let you look into the ways your visitors navigate your site to discover new pages and content. There are several preset explorations you can activate, or you can create a new one from scratch.

4. Advertising
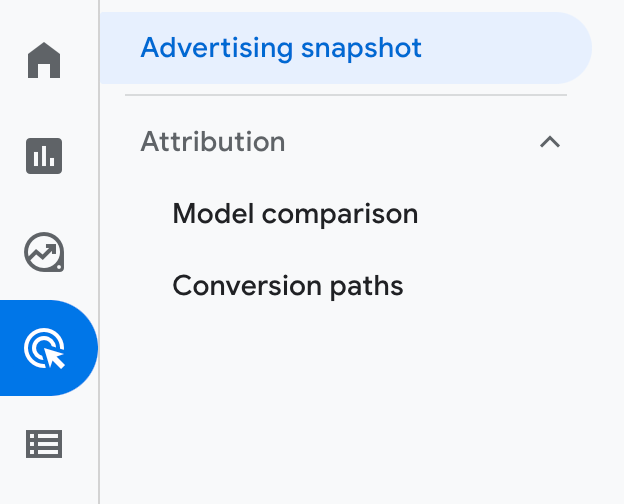
GA4 Tools: Advertising

When you click on the Advertising tab, you’ll start on the Advertising snapshot screen. Here, you’ll see the channels and touchpoints that drive the most conversions on your site. In order for this tab to be most helpful, you’ll need to set up goals and conversions in Google Analytics.

GA4 Tools: Advertising Snapshot

5. Configure

The Configure tab is where you’ll set up key pieces of your reports including events, conversions, audiences, and other custom definitions. As you get more familiar with your Google Analytics instance and the data you want to see, you can configure these settings to get a granular look into your data. This will allow you to solve problems, answer questions, and make decisions that are specific to your site and the outcomes you want to achieve from it.

GA4 Tools: Configure

Now You’re Ready to Track

Google Analytics is a highly valuable tool for any business as it gives you tangible data that you can apply to grow your business. Bookmark this guide and come back to it as your data tracking becomes more sophisticated.

Good luck on your Google Analytics journey.

Editor’s note: This post was originally published in August, 2017 and has been updated for comprehensiveness.

seo audit

Categories B2B

What is “Quiet Quitting”? And Why It’s Trending on Social Media

Ever had a job where you clocked in, kept your head down for 8 hours, and clocked out? No staying extra hours to finish out a project or volunteering for tasks beyond your assignment workload.

Download Now: Free Company Culture Code Template

This is what Millennials and Gen Z are calling quiet quitting. Learn why it’s trending on social media and how companies should address it.

What’s quiet quitting?

Quiet quitting is a term that took off on TikTok in a video by content creator Zaiad Khan.

@zaidleppelin On quiet quitting
#workreform
♬ original sound – ruby

In the video, which currently has 3.5 million views, the Tiktoker explains what quiet quitting is: A rejection of hustle culture and a reclaiming of work-life balance.

Shortly after, other TikTok users shared their thoughts and experiences with quiet quitting – the hashtag now gaining 97.6 million total video views.

quiet quitting tiktok hashtag

So while the term includes the word “quitting,” it actually has nothing to do with it.

Confusing, I know. When I thought of quiet quitting, I pictured employees slowly backing away from their desks and sneaking out of the building Homer Simpson style, never to be seen again.

Instead, quiet quitting involves completing your work responsibilities without going above and beyond. This looks like logging out at 5 p.m., not seeking additional tasks or projects, and taking regular time off.

According to a Gallup survey, around half of the U.S. workforce is already quiet quitting, with work engagement dropping in the second quarter of 2022.

A recent article by the Washington Post dove into the trend and examines how women and people of color are already at a disadvantage in the workplace.

They face harsher punishments for mistakes, they have higher burnout rates, and they’re less likely to be promoted. As a result, quiet quitting could hold them back further. So, for many people of color, it’s something they can’t afford to do.

For others, it’s a form of rebellion. And for some, it’s an odd term to describe something they’ve done for decades.

How Companies Should Address Quiet Quitting

In an NPR article, critics of this term say that quiet quitting is a misnomer for setting boundaries at work and having a healthy work-life balance.

They also argue that this term highlights how many companies exploit employees and set an expectation of overperformance without adequate compensation.

This conversation comes following the Great Resignation, an economic trend in which employees quit their jobs in masses in 2021.

This was reportedly driven by low or stagnant wages, high cost of living, health concerns relating to the COVID-19 pandemic, and a desire for remote work. Not to mention burnout.

With this in mind, instead of seeing quiet quitting as a trend that’s harming the workplace, employers should see it as an opportunity to improve their workplace culture.

The fact is: Employees are only “quiet quitting” as a result of a poor workplace environment – and there’s data to support this.

A workplace study by HBR states that quiet quitting is a reflection of “bad bosses” rather than employees’ unwillingness to go the extra mile.

Their researchers found that managers who ranked highest in balancing business needs with employees’ needs had the highest percentage of employees willing to go the extra mile – 62% to be exact with only 3% quiet quitting.

This is a stark contrast to the managers who ranked the lowest in the category only having 20% of their employees willing to go the extra mile and 14% quiet quitting.

An employee who receives adequate support from their manager, is given growth opportunities, and is rewarded for their work will be motivated to perform at the highest level.

It’s up to employers to create the environment in which that happens. It starts with setting boundaries surrounding work hours – this can look like a no-contact policy around out-of-office times.

Management training is also important as that will likely have the strongest impact on the employee. Training on growth coaching, skill development, and pay transparency will help toward building trust with employees and promoting a positive work life.

In addition, set quarterly career chats between managers and their direct reports to discuss areas of interest and focus, current or expected challenges, and more. The more engagement managers build with their teams, the lower the likelihood of quiet quitting.

What to Do if You’re Managing a Quiet Quitter

If you realize you have a quiet quitter on your team, the first thing you should do is realize it’s likely due to a lack of trust between you and your employee.

Where do you go from there? Work on your relationship.

One of the best ways to do this is by having regular 1-on-1s in which you build your relationship. Find common ground, listen actively, pay attention to their interests, and share resources to support them in their growth.

In addition, set quarterly career chats to discuss their current trajectory. Here are key areas to discuss:

  • Interests and values
  • Strengths and gaps
  • Job satisfaction
  • Career goals

Once you have a clear understanding of what they’re working toward and what’s missing in their role, create an action plan together on how to meet their goals.

From there, set up a check-in schedule in which you’ll discuss progress, obstacles, and opportunities.

Next, be consistent and reliable. Think about it from a personal note – would you keep a friend who didn’t keep their word and on whom you couldn’t rely? Probably not. So, why should employer-employee relationships be any different? If anything, these traits are even more important as they influence your career.

Lastly, treat your employees like people. Being an engaged employee doesn’t (and shouldn’t) mean giving your all. Work-life balance is a key part of job satisfaction and if that’s not a current priority for your team, you’ll end up with a long list of quiet quitters.

In most cases, a quiet quitter is simply an employee who doesn’t have the right support. Once you offer what they need, you’ll have an engaged performer on your hands.

company culture template

Categories B2B

How Much Do Content Creators Make? [Average Salary in 2022]

The creator economy is bustling — so much so, a LinkedIn report found job postings for creators have nearly tripled since 2021.

While the demand is there, one important question remains: is the salary keeping pace?

Here, we’ll cover the average salary of content creators, what influences the number, and strategies to increase your salary.

Download Now: 150+ Content Creation Templates [Free Kit]

Table of Contents

Content Creator Salary in 2022

What influences the salary of content creators?

How to Increase Your Salary as a Content Creator

Finding a Job as a Content Creator

Content Creator Salary in 2022

The average salary for content creators in 2022 is $44,192 per year. That works out to be just over $22 an hour, or $3,680 per month.

The salary range is $36,000 to $58,500, with top earners generating up to $74,500 annually across the United States.

For comparison, here’s a roundup of similar jobs and their average annual salary:

social media content creator salary

Now let’s explore the different factors that influence the salary of creators in this field.

What influences the salary of content creators?

The term “content creator” is an umbrella term that includes everything from blog writing to videography. Because of this discrepancy, the salary for one role may be vastly different from another, even though the job titles are similar.

Let’s explore some additional factors that influence salary:

Location.

Not surprisingly, location can impact your base salary. For instance, while the national average salary for a content creator is $44,192 per year, this number jumps to $58,186 in New York City.

In fact, California, New York, and Massachusetts pay above the national average for this role. Take a look at the highest paying cities in the US for content creators:

city average annual salary
Sunnyvale, CA $63,681
Santa Rosa, CA $61,708
Cambridge, MA $59,792
Vacaville, CA $58,557
New York City, NY $58,186

Years of experience.

Experience also plays a large part in how much you can earn. Ultimately, your level of experience indicates to employers whether you’re capable of doing the job. The more years you have working as a content creator, the more you can expect to earn.

For example, the average salary of a junior video editor is $48,962 per year. On average, a senior video editor will make almost $20,000 more per year.

In-demand skills.

Content creators who posses certain skills are in great position to earn more than their counterparts. For example, a multilingual copywriter — or a marketing manager who specializes in automation— may earn more for these additional skills.

How to Increase Your Salary as a Content Creator

Here are a few strategies to land on the higher end of the salary range as a content creator:

1. Find your expertise.

While content creation is a multi-faceted job, it can be helpful to specialize in a certain area, such as web analytics, social media, search engine optimization, or content creation. This is especially crucial for freelance content creators who want to set themselves apart from the crowd.

2. Grow your skillset.

The field of content creation is always changing. For example, if you’re an SEO writer, you should always stay ahead of new algorithm updates and changes.

Set aside time to learn new skills, complete certifications, and read about new techniques and trends. In doing so, you can remain competitive and advocate for yourself.

Besides beefing up your technical skills, you can also benefit from developing your soft skills. After all, besides doing the technical scope of work, you’re also responsible for everything that goes into the business aspect, such as looking for clients, negotiating deals, or deciding your rates.

3. Create your own brand.

Branding isn’t just for businesses. Maintaining an online portfolio, blog, podcast, or social media account is an effective way to showcase your expertise, share your work, build authority, and network with new clients. Simply updating your LinkedIn profile and posting updates can boost awareness around your work.

Finding a Job as a Content Creator

Most content creators pursue one of the following career paths: freelance, in-house, or agency. If you want to find a job as a content creator, you may be wondering which avenue you should take.

content creator career pathsLet’s take a closer look at these options:

  • Freelance — this is a solid path for creators who value flexibility. Freelancers set their own rates and have the freedom to work on multiple projects without committing to one employer — although you may have reoccurring clients. The downside? Freelancing is unpredictable, and work is never a guarantee.
  • In-house — this involves working for anything from a scrappy start-up to a large corporation. Perhaps the biggest perk is income stability. You also have more opportunities to collaborate with team members. That said, the work may lack variety which may get monotonous.
  • Agency — at an agency, you work with a team of experts to complete projects. Agency life is fast-paced, so expect to encounter a variety of industries and grow your portfolio at record speed. Like working in-house, you can expect consistent pay and work. However, with projects constantly crossing your desk, it’s easy to burnout in this environment.

As a content creator, you have the luxury of working in different environments. If you’re looking for the best fit, start by assessing your lifestyle, compensation requirements, work preferences, skill level, and comfortability working solo versus on a team.

Back To You

Content creation is an exciting area, but it’s important to be fairly compensated. Remember to stay consistent with your quality of work, and never forget the value you bring to the table.

content templates

Categories B2B

5 Ways to Figure Out What to Sell on Amazon

With over 300 million active customers on Amazon, it’s no wonder you want to sell a product on the internet’s most visited ecommerce website. Fortunately, choosing what to sell on Amazon, and how to sell it, isn’t as hard as you might think. In fact, most of your research can be done for free on the site itself.

To ensure you choose a low-risk, high-return product to sell on Amazon, we’ve created this guide. Keep reading to learn about top-selling items, what you should sell, and how to conduct research to ensure whatever you’re selling is a safe bet on the ecommerce giant.Download Now: Ecommerce Conversion Rate Calculator

Top Selling Items on Amazon

First, for inspiration, let’s take a look at some of the top-selling products on Amazon.

Amazon itself curates a list of current best-sellers, ranging from toys to books to video games —and the list is updated hourly. Here are some of the top product categories:

1. Home & Kitchen

what to sell on amazon example: home and kitchen products

Given the wide range of products that fall within Home & Kitchen — appliances, furniture, décor, and more — it’s no wonder that 32% of sellers on Amazon opt to sell in this category. Plus, it’s a pretty booming industry with global retail sales of home and household appliances amounting to $448 billion dollars in 2021.

It’s important to note that because Home & Kitchen is so popular it may be more difficult for new sellers to find success in this category. So, if you’re considering breaking into this market, make sure you have a product that is high quality and serves a specific niche.

2. Clothing, Shoes & Jewelry

what to sell on amazon example: clothes, shoes, and jewelry products

It should be no surprise that Clothing, Shoes, & Jewelry is one of Amazon’s top product categories. After all, the ecommerce platform holds a nearly 35% share of all apparel sold online, making it one of the best-selling online fashion retailers. Specifically, Amazon shoppers prefer casual clothing over luxury apparel, with their top brands being Hanes and Amazon Essentials.

It’s important to note that this category can get a bit oversaturated, so it’s critical you ensure you’re able to offer something unique. People don’t turn to Amazon for expensive brand items — instead, they look for discounts. So, if you’re thinking of selling clothes, shoes, and jewelry, make sure your product is high quality and low price.

3. Electronics

what to sell on amazon example: electronics

From computers and TVs to surveillance systems and wearable technology, consumers are always looking for the latest in tech — especially when they are online shopping. In fact, almost half of all computer and electronics sales occur online.

Amazon consistently displays impressive prices on some of the world’s most popular electronics, so it makes sense that consumers often buy from the platform. This could be a promising category to consider as a third-party seller if you’re able to buy electronics in bulk.

4. Beauty & Personal Care

what to sell on amazon: beauty and personal care products

Though the Beauty & Personal Care industry experienced a 15% decrease in global sales in 2020, don’t underestimate its significance and resilience. The market bounced back with a revenue increase of nearly $3 billion in 2021 and is expected to continue to grow.

The Beauty & Personal Care category includes everything from makeup and skincare to fragrances and hair products. Even though there is quite a bit of competition in this market with 23% of third-party sellers listing items, those who specialize in creating handmade cosmetics may really excel in this category.

Of course, like anything, the more popular the product category, the more intense the competition. It’s important you find your niche to ensure you’re not competing with the 300,000 other search results for “white t-shirt.”

Before we get to what to sell on Amazon, let’s discuss how much it costs.

You’ll want to do your research on shipping costs and Amazon seller fees, so you know how much you’ll need to spend depending on your item. This information can help you narrow your decision — for instance, a two-to-three pound item will be lightweight and easy to ship, which can help lower your shipping fees.

Along with weight, you’ll want to consider products that aren’t easily breakable when you’re transporting them.

Additionally, most products on Amazon vary between $10 and $50, so you’ll want to choose items you can sell for relatively cheap while still making a profit.

How to Know What to Sell on Amazon

Once you’ve determined you’re willing to pay shipping costs — and that your product likely falls within a fair price range — it’s time to figure out what you want to sell. Here are five methods that can help you narrow down your search:

1. Manually conduct research on Amazon.com.

To manually research popular products on Amazon, you’ll want to start with Amazon’s best-selling items in a certain category. From there, you’ll start exploring that category’s sub-categories and narrow down on a niche.

When you check out Amazon’s best-sellers list, you might also look at the “Customers also bought” section to get ideas for similar products.

Once you make a list of items, check Google keyword planner to see whether those products have search volume, which indicates a level of demand. Alternatively, you could use Sellerapp’s product intelligence tool specifically for Amazon. Sellerapp offers a seven-day free trial, which allows you to begin investigating popular products on Amazon via keywords to further narrow your list.

2. Use a chrome extension to research products in a niche market.

There are two popular chrome extensions to help you conduct keyword research on Amazon: Jungle Scout and Unicorn Smasher.

Jungle Scout shows you monthly sales volumes on products and displays products with low competition. It allows you to save products to track them over time. Undoubtedly, Jungle Scout’s analytics can help you quickly and efficiently narrow down on a product or an industry in which you could excel. However, Jungle Scout is relatively pricey, particularly if you’re just starting out.

Unicorn Smasher is Jungle Scout’s free alternative. While the data isn’t as accurate as Jungle Scout, and it lacks some of Jungle Scout’s sophisticated features, it’s nonetheless a helpful free option to gather estimated monthly sales and estimated monthly sales revenue for Amazon products.

Some other popular product research extensions include:

3. Find a gap in the market.

You can find gaps by using one of the previously mentioned chrome extensions to research products with high monthly sales volume and low competition. However, you might also come across a gap on Amazon through a simple organic search.

For instance, when I search “perfume” there are over 30,000 results, but when I search “natural vegan amber perfume” there are only 247.

This is a simplified example, but sometimes you need to narrow down your product search to find a place to make an impact on Amazon. Plenty of people are already selling perfume, but there might be a certain scent, style, or feature that is missing on the site.

amazon search example for perfume

amazon search example for natural vegan amber perfume

Alternatively, you can find a gap in the market by reading customer reviews in your product market niche. Even if there are plenty of products similar to yours already, you might find that customers are unsatisfied with the current brands and want something you can provide.

4. Find products that don’t have too much competition.

If you’re trying to sell a product that currently has 100,000 search results, it’s likely going to be very difficult to stand out against the competition and achieve the sales you want. Fortunately, it’s relatively easy to find a niche within a larger market that has less competition, which ensures your product is more easily found by searchers. Best of all, those searchers are likely more willing to buy your product, since they needed to search for a more specific keyword.

For instance, let’s say you want to sell cookbooks. The search term “Cookbooks” has over 70,000 results.

Alternatively, the search term “Cookbooks for instant pot cooking” has only 3,000 results. Not only is your product more likely to become a best-seller in this category, but it’s a more targeted keyword. If someone searches “Cookbooks” they could mean anything from “Kids cookbooks” to “Holiday cookbooks.” If someone searches “Cookbooks for instant pot cooking,” however, they’re more likely to be satisfied with your product.

5. Search for categories with at least three results with Best Sellers Rank (BSR).

Amazon’s Best Sellers Rank (BSR) reflects both recent and historical sales of an item. A high BSR indicates that the product is in-demand, which is critical to know as a seller.

If you find just one product in a category with a high BSR, and none of the other items are best-sellers, it could be an indication that a single product is dominating the market. Instead, you want to target product categories that feature multiple items with a high BSR because it signifies demand in that area and allows room for your product to succeed.

For instance, let’s say you want to sell sports products, but you find “basketball” has only one item with a high BSR. However, upon further research, you find “football” as a category has multiple best-selling products on the first page.

As a new seller, I would prioritize selling footballs over basketballs since this research demonstrates a user’s willingness to peruse different footballs before purchasing one.

best selling footballs on amazon

What to Sell on Amazon

Undoubtedly, you can obtain an impressive profit from selling products on Amazon, but it’s critical you’re able to offer unique, budget-friendly products with minimal competition to truly succeed on the site.

Over-saturation on the platform proves it’s more difficult than ever to stand out, so it’s not smart to sell on Amazon for the sake of selling on Amazon. Instead, you want to ensure you’re truly able to offer something of value.

If you have a product in mind, follow the tips above to refine your strategy and find a niche segment within a larger demographic. If you don’t have a product in mind, start with the basics: what are the most-searched keywords on Amazon, and which products are most successful?

Once you have a list based on keyword research, consider similar products the user might find more compelling or useful than the ones currently listed on Amazon.

Editor’s note: This post was originally published in March 2019 and has been updated for comprehensiveness.

New Call-to-action

Categories B2B

If Gen Z Changed the Game for Marketers, What Will Gen Alpha Be Like?

Right now, Gen Z is the main target audience for brands trying to stay relevant and attract new consumers. Gen Z’s love for platforms like TikTok and Twitch caused many companies to switch up their marketing tactics —turning to strategies like influencer and social media marketing. However, there’s a new generation that is expected to change the marketing landscape even more: Gen Alpha.

This generation is the first to be born entirely in the 21st century — in a fully digital world. Alpha is also expected to be the largest generation in history with over 2 billion people by 2025. With those numbers, this generation will have a lot of buying power, so companies need to prepare their marketing strategies. Here’s what brands and companies need to know about this next generation of consumers.

Download Now: 2022 State of U.S. Consumer Trends Report

Who is Gen Alpha?

Generation Alpha is the demographic that comes after Generation Z and is made up of anyone born during or after 2010. Right now, Gen Alpha is composed of children under the age of 12, so the oldest in this demographic will become teenagers in 2023. The cut-off year to be considered born into Gen Alpha is 2025.

Gen Alpha kids are also sometimes called “mini millennials” because they are the children of Millennials, are believed to have a really close relationship with their parents, and are likely to have similar consumer habits.

What is Gen Alpha Like?

According to Heather Dretsch, assistant professor of marketing at North Carolina State University, Gen Alpha children will likely mimic their parents when it comes to the kinds of products they consume as they get older. That’s because millennial parents are extremely conscious of the products they use.

“As health-conscious caretakers, millennial parents seek out a lot of information about the products they buy and expose their kids to,” Dretsch said. “From toys and food to clothing and personal care products, they love to be in the know about the best brands for their children, and they choose only the safest, cleanest, highest-quality ones.”

Since Millennials are deciding what brands are to be trusted in their homes, Gen Alpha will likely choose those same brands and products for themselves because they’ll be all they know. With that in mind, Dretsch says Gen Alpha kids are already aware of cheap knockoffs and competitors — and they already have a strong preference for higher-quality products and industry-leading brands.

Gen Alpha is also more connected than ever due to growing up in the age of social media. In a 2022 survey by market research company GWI, it was found that 38% of children said they spend most of their time on social media after school. GWI said the number increases by 43% on the weekends.

That same survey shows that 43% of children preferred to speak to their friends online over the weekend instead of seeing them in person.

Not only are Gen Alpha kids connected to their peers via social media, they are also socially aware and keep a pulse on global concerns like climate change.

For example, Shopify writer Dayna Winter spoke to three young children and asked them what is the one invention they would create if they could. Ten-year-old Zy said she’d invent a device that would make getting vaccines easier and “less scary.” Eleven-year-olds Fia and Mylo both worried about climate change. Fia would invent a machine that picks up trash from the ocean, and Mylo described climate change as a “snowball” that’s getting bigger as time passes but is small enough to stop before it’s too late.

All three children are part of an online program called Upstander Academy where they learn about social justice and regularly interact with guest speakers that include politicians, activists, and entrepreneurs. The program was started by World-Changing Kids founder Lindsey Barr. Barr, who is also a mother, told Winter she started the program because she noticed children have already developed an interest in social justice.

“They want to talk about social issues,” Barr said. “They care about homelessness, they care about refugees.”

Gen Alpha’s interest in world issues has a lot to do with constantly being in front of a screen and having a lot of access to the internet via tablets and smartphones. That screen time has only increased during the pandemic, which caused children to spend a lot of time at home with their devices.

The way Gen Alpha interacts with the digital world also differs from previous generations. Thanks to platforms like TikTok, YouTube, Minecraft, and Roblox, Gen Alpha children are accustomed to content that gives opportunities to contribute and not just consume.

For example, Fia told Winter she enjoys playing in Roblox Studio because it’s where users can learn code and create games for Roblox.

How Future Marketers Can Prepare for Gen Alpha

So what does all of the above information have to do with marketing to Gen Alpha? Well, now we know the following about that demographic:

  • They have refined taste when it comes to the products they consume.
  • They are deeply concerned about issues like social justice and climate change.
  • They enjoy technology and content that keeps them informed, connected, and creates opportunities to contribute instead of just consume.

With that in mind, here’s what marketers need to do to reach Gen Alpha:

Be authentic and transparent.

Again, Gen Alpha is incredibly socially aware, which means they are also aware of how certain products, services, and industries have long-term impacts on the environment and society. With that in mind, brands will need to be transparent about their mission, impact, and what they’re doing to provide solutions.

For example, fashion brands shouldn’t shy away from discussing the negative impacts fast fashion has had on the environment. Instead, these brands should invest in creating products that are environmentally friendly and of long-lasting quality. Brands should make it clear to Gen Alpha consumers that the company is doing the work to lessen its impact on the environment.

Being transparent also means acknowledging the role your company may have played in issues like social justice and climate change — be it good or bad.

For example, let’s say your fashion brand has a history of generating large carbon emissions through its manufacturing process. A great way to gain the attention (and trust) of Gen Alpha is through marketing materials proving the company is actively combatting the issue by changing manufacturing practices and partnering with organizations fighting climate change.

This shows honesty and social responsibility, and it provides a solution.

Create experiences and not just products.

Gen Alpha kids are growing up during a huge content creator boom where everyone is given the chance to lend their creativity to platforms like TikTok. Knowing this, it’s important that brands and companies figure out ways to give people in this generation opportunities to contribute and not just buy.

One way to do this is to leverage interactive marketing tactics like user-generated content that allow audiences to be a part of the experience. For example, the England-based band Glass Animals has a website that allows fans to create their own art, memes, and music to be used for the band’s future projects.

Gen Alpha also loves to learn, especially regarding the latest technology. So if you’re a tech-based company or brand, holding interactive workshops that showcase your products’ different features can also pique their interest.

Create meaningful content that connects with Gen Alpha wherever they are.

Social media and virtual communities play a huge role in the lives of Gen Alph —, so in the future, brands will need to leverage interactive social media campaigns that meet Gen Alpha where they are. A great example of this is Pringles’ #PlayWithPringles campaign.

The campaign was started after the company noticed consumers were already on TikTok making content involving Pringles cans. So Pringles decided to join in the fun by starting its own challenge as a brand campaign. The company partnered with TikTok creators and influencers to challenge users to make creative videos using Pringles cans. After five months, the campaign generated over one billion views and more than 278 million videos.

Gen Alpha is expected to be the most socially aware and digitally savvy generation thus far, so brands will need to be smart about how they connect with them. While there is still so little information about this young generation, the information above can help your brand prepare to delight them in the future.

New Call-to-action

Categories B2B

19 Black Influencers To Follow and Learn From

Welcome to Breaking the Blueprint — a blog series that dives into the unique business challenges and opportunities of underrepresented business owners and entrepreneurs. Learn how they’ve grown or scaled their businesses, explored entrepreneurial ventures within their companies, or created side hustles, and how their stories can inspire and inform your own success.

Zippia found that 67.5% of all content creators and influencers are white.

As people look to influencers to find someone like them to take inspiration from, the overwhelming amount of White content creators means that Black consumers likely have a hard time finding what they’re looking for.  

In this post, we’ve compiled a list of Black influencers from various industries with authentic perspectives and advice that are worth following.

Download Our Guide to Influencer Marketing Essentials

Black Influencers to Follow on TikTok

1. Marquees Brownlee — Technology Youtuber

Niche: Technology and software

Marquees Brownlee is a tech influencer known for his reviews and instructional videos. He has over 3M views on his YouTube channel, and, as an influencer in a predominantly and overwhelmingly white industry, he is a great representation and inspiration for those looking to make waves in their own communities.

On TikTok, he reviews mobile gadgets, digital tech, and software developments to help his audiences make informed decisions about their purchases.

@mkbhd

RIP. The last iPod has been officially discontinued.

♬ original sound – Marques Brownlee


2. Tabitha Brown — Actress and Influencer

Niche: Food and lifestyle

Tabitha Brown is a food and lifestyle influencer well-known for her calm demeanor and comedic cooking videos. She shares recipes and inspirational content on TikTok and shows audiences what plant-based living looks like. She also gives actionable advice to those looking to follow in her footsteps, helping aspiring entrepreneurs searching for inspiration.

@iamtabithabrown “YOU” season is not the same as “YOUR”  they can be uncomfortable as you get back to YOU, but lean into the discomfort ❤️. You deserve YOU!! Love you!
#spreadlove
#tabithabrown
♬ original sound – Tabitha Brown


3. Dayna Bolden — Creative Director of Bolden Creative Media

Niche: Lifestyle and entrepreneurship

Dayna Bolden is the Creative Director of Bolden Creative Media and a lifestyle and entrepreneurship influencer and blogger. On TikTok, she shares lifestyle content like morning routines and travel advice, and she’s a worthwhile follow for entrepreneurs looking to learn about maximizing their potential and achieving success.

Black Influencers to Follow on Twitter

4. Shana Minei Spence, MS, RDN, CDN — Registered nutritionist

Niche: Lifestyle and wellness

Shana Minei Spence, a Registered Dietitian Nutritionist, created a platform for open discussion on nutrition and wellness to dispel misinformation in the lifestyle and wellness industry.

She shares content on Twitter about finding balance, food education, and recipes she enjoys making, giving her audience access to high-quality and accurate information. She’s an excellent inspiration for entrepreneurs looking to learn how to engage with audiences, build a following, and make an impact in their niche.

5. Tiara Willis — Licensed esthetician

Niche: Beauty, skincare, and lifestyle

Tiara Willis, licensed esthetician, has built a community for women of color, who are often left out of beauty, makeup, and skincare discussions.  

Willis shares tips, insight, and information with her followers to help them make informed decisions about the products they use and how they relate to people’s skin complexions.

She’s a worthwhile follow for people looking to learn more about skincare and for entrepreneurs looking to learn how to interact with audiences, build community, and share information (she was the first person to sell out a ticketed Twitter Spaces event about content monetization).

tiara-willis

Image Source

Black Influencers to Follow on Instagram

6. Donye Taylor – Director of Creative Initiatives at Fohr

Niche: Marketing and advertising

Donye Taylor is Director of Creative Initiatives at Fohr, an ambassador marketing company, and a marketing and advertising expert that helps brands develop marketing content that stands out and shares their unique brand personality.

On Instagram, she shares marketing tips, tricks, and advice that her followers can learn from and apply to their practices to up their marketing game. Taylor also runs a fun and relevant series where she explains how she would market musical artists’ projects. Most recently, she created a sample campaign for rapper Jack Harlow.


7. Shontay Lundy – Creator and Founder of Black Girl Sunscreen

Niche: Entrepreneurship and beauty

Shontay Lundy is the creator and founder of Black Girl Sunscreen (a sunscreen for Black people) and disruptor of an industry that historically underserved and excluded Black people from conversations about sun care and sun safety.

Lundy grew the brand into a million-dollar business that you can find on the shelves of popular stores like Target, Ulta, and CVS Health. On her Instagram, Lundy shares inspirational content for entrepreneurs and founders embarking on their own ventures.

8. John Henry — Founder and CEO of Loop

Niche: Business and finance

John Henry is the founder and CEO of Loop, AI-powered car insurance, and an entrepreneur and influencer in business and finance. He is well recognized for his impact and was named in Forbes 30 under 30, Inc. 30 under 30, and Ebony Power 100.

He shares must-know information on Instagram about the bias and privilege in insurance that excludes people in lower-income communities, which ties directly to his company’s mission of making care insurance more equitable for people of color.

As an influencer, he also shares advice for entrepreneurs on their own ventures that may be facing roadblocks and looking for inspiration.


9. Cinneah E – Project Manager at PayPal, Creator of Flynanced

Niche: Finance, travel, and business

Cinneah E is an influencer in many different niches.  Most significantly, she shares tips and actionable advice for people in the workforce, like how to continue to live the lifestyle you want while maintaining a 9-5, how to have an effective job search, and how to continue to develop skill sets through continued education opportunities.

More Black Influencers to Follow