Categories B2B

The Fastest Growing Social Media Platforms of 2023 [New Data]

Are people still using Facebook? Is BeReal the next big thing? And is TikTok still just for Gen Z?

If you’re looking for answers to those questions, we’ve got ‘em.

We asked 600+ U.S. adults about the social media platforms they use in May 2022 and again in January 2023 to find out which apps are growing and which are slowing down. Here’s what we found out:

Download Now: The 2023 State of Social Media Trends [Free Report]

Social Media Usage in 2022 vs. 2023

While 84% of US adults unsurprisingly use social media, where are they going when they use it? 

usage of social media platforms by us adults infographic comparing 2022 and 2023 data

Here are a few fast facts about the top platforms US consumers use in 2023, keeping in mind that this list might be different in other countries.

  • Facebook (69%), YouTube (57%), Instagram (45%), TikTok (33%), and Twitter (30%) are the most popular social media apps.
  • BeReal (313%), Twitch (29%), LinkedIn (20%), and TikTok (16%) saw the most growth since last May.
  • Reddit (-11%), Pinterest (-9%), and YouTube (-4%) are the only platforms that saw a decline in usage.
  • While Facebook is the most popular social media platform for people over the age of 25, Instagram, TikTok, and YouTube are the most popular among ages 18-24.

With that, let’s take a deeper dive into the fastest-growing platforms.

The Fastest Growing Social Media Platforms

1. BeReal

BeReal has seen 313% growth in usage from consumers we polled, which was likely fueled by hype. But — as we wonder with all emerging social media platforms — will it last?

The young platform, which gives users one opportunity to post a picture of themselves wherever they are with no filter during a few timeslots — designated by the app each day, went from being used by roughly 0.7% of the population to 2.8%, growing the most of the social platforms we analyzed. But, the real story is how it’s taken off with Gen Z. Usage from just this age group jumped from 1% to 13% (a whopping 1,200% increase).

BeReal does benefit from being the newest social platform we asked about in these surveys, so it had the most room to grow. On the other hand, with other competitors trying to copy its platform, it risks being another trendy social media platform that gets forgotten or lost in the shuffle.

Due to BeReal’s format, it also might not be the most welcoming channel or community for brands, as people join to see the “real” versions of their friends and aim to use the platform to amplify authenticity and human connection. 

2. Twitch

Whether you’re watching Keke Palmer start a family with The Sims, or enthralled by someone’s live coverage of a cool event, it’s clear that streamed content is here to stay. And while social platforms like Facebook, Instagram, and TikTok have enabled and tested live features, Twitch still reigns supreme as the place to go for long-form live video. 

Example of a Twitch homepage.

While it might not seem like an obvious social platform as many people go there to view videos rather than record or interact in them, it’s still continuing to compete with other social channels that have launched their own live-video copycats. 

Since our first survey, Twitch usage grew by 29%, thanks to Gen Z and Boomers with the percentage of total consumers using it growing from roughly 7% to 9%.

Gen Z drove this increase, with their Twitch usage jumping from 13% to 17%.

Boomers are also getting in on the action. In May 2022 just 0.3% used the platform while closer to 3% use it today. While this seems like a small percentage, it still could equate to thousands of additional users. 

3. LinkedIn

Between May and January LinkedIn grew 20% amongst consumers we surveyed, boosted by Boomers. However, the platform is starting to see declines with other age groups.

While LinkedIn usage declined mildly for every other generation, LinkedIn usage among Boomers grew from 11% to 20%, an 85% increase.

All-in-all, we’re not too worried about the slight declines as LinkedIn continues to be a mix of social media and utility that job hunters and recruiters will need, and use to buffer their portfolios, for years to come.

So, if you’re a marketer who leverages the platform, while it’s important to keep demographic shifts in mind — you likely don’t need to pivot your strategy there just yet.

Check out the video below for some tips on how to get started or improve on your current LinkedIn strategy: 

4. TikTok

Despite TikTok’s ongoing regulatory concerns, people who loved the platform back in May seem to be sticking around, while others are beginning to experience the channel for the very first time.

Between May and January, TikTok usage among our surveyed consumers grew by 16%. Usage also grew across all generations — especially with Boomers.

When looking at the generational increase, the number of Boomers who’d used TikTok grew by 164%, showing again that they’re catching on to many viral Gen Z trends and apps.

From our research, we estimate that one in three American adults now use TikTok.

If you aren’t on TikTok yet, you should keep it on your radar and take some time to consider if the app makes sense for your brand. Just keep in mind that it will require some video-related time and resources, as well as user-research into all the trends going on there, to build a successful strategy. You can learn more about TikTok marketing here. 

5. Twitter

Despite fluctuations in leadership, Elon Musk’s controversial takeover, and office-wide changes at the company, Twitter’s social media platform is still holding a strong user base and grew 7% among our consumer audience.

While our sample shows that Twitter pulled in roughly 12% more Gen X users and 27% more boomers, this should be taken with a grain of salt as 9% fewer members of Gen Z survey-takers said they use Twitter in January compared to May.

While it’s still hard to predict how Twitter will continue to grow and perform, especially for marketers, in the future — here’s a helpful guide on how to build and retain audiences and followers that could drive ROI for your brand. 

6. Instagram

It’s no shocker that Instagram is one of the favorites among multiple generations. Between May and January, usage by consumers we surveyed grew 6%. While the channel continues to win over Gen Z and gain attention from Boomers, it might be losing some of its Millennial audience. Below are just a few fast facts.

  • Around 45% of U.S. adults use Instagram, up 6% from last May.
  • Instagram grew 11% with Gen Z and 53% among Boomers (from 18% to 27%).
  • Millennial usage of Instagram went from 65% to 54%, a 17% drop.

Now that we’ve covered some of the fastest-growing social media platforms, here are the ones slowing down in 2023.

Which Platforms are Losing Steam?

While many of the large platforms that saw slowed growth from our consumer pool aren’t going anywhere, the data hints to some consumer shits marketers might want to know about or keep on their radar.

Click here to learn why Reddit, Pinterest, and YouTube might be losing steam compared to their competition.

More Social Media Insights

Want more social media insights? Check out these helpful resources:

Prefer to download a report with everything you need to know? Check out our Social Media Trends Report for free below.

New call-to-action


Categories B2B

3 Consumer Behavior Predictions for 2023 [State of Consumer Trends Data]

Every year, consumers spend differently than the year before. This is because their preferences are evolving, their priorities are shifting, and their behaviors aren’t quite how they were before. So how are marketers supposed to meet their expectations in the new year? By making data-informed predictions.

To help marketers and business professionals prepare for the road ahead, we conducted a bi-annual survey of 600+ U.S. adults in January 2023 known as the State of Consumer Trends Report to learn more about the latest consumer trends and data. Here, we’ll share our top three biggest consumer behavior predictions based on HubSpot Blog Research.

Download Now: 2022 State of U.S. Consumer Trends Report

Consumer Behavior Predictions for 2023

1. Consumers will buy products on influencer recommendations over alternatives.

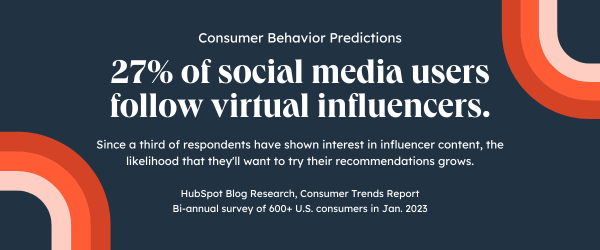
HubSpot Blog Research found that 17% of social media users bought a product based on an influencer’s recommendation, and this number goes up to 32% among Gen Z. Additionally, 27% of social media users follow virtual influencers.

Online word-of-mouth marketing is infectious, and brands that acknowledge the power of influencer recommendations have a lot to gain in 2023.

For example, Olipop, a new soda alternative company, has a large presence on TikTok. Using the strategy of influencer marketing, the newly popular brand has amassed over 180,000 followers, stemming from the positive reviews of the company’s product flavor range, and health benefits over choosing traditional soda.

Image Source

Consumers want to trust the recommendations of people they relate to, so if they see people with similar interests, tastes — or even appearance — rave over a product, they’re more likely to want to give it a try.

2. Consumers will engage in social media platform shopping more.

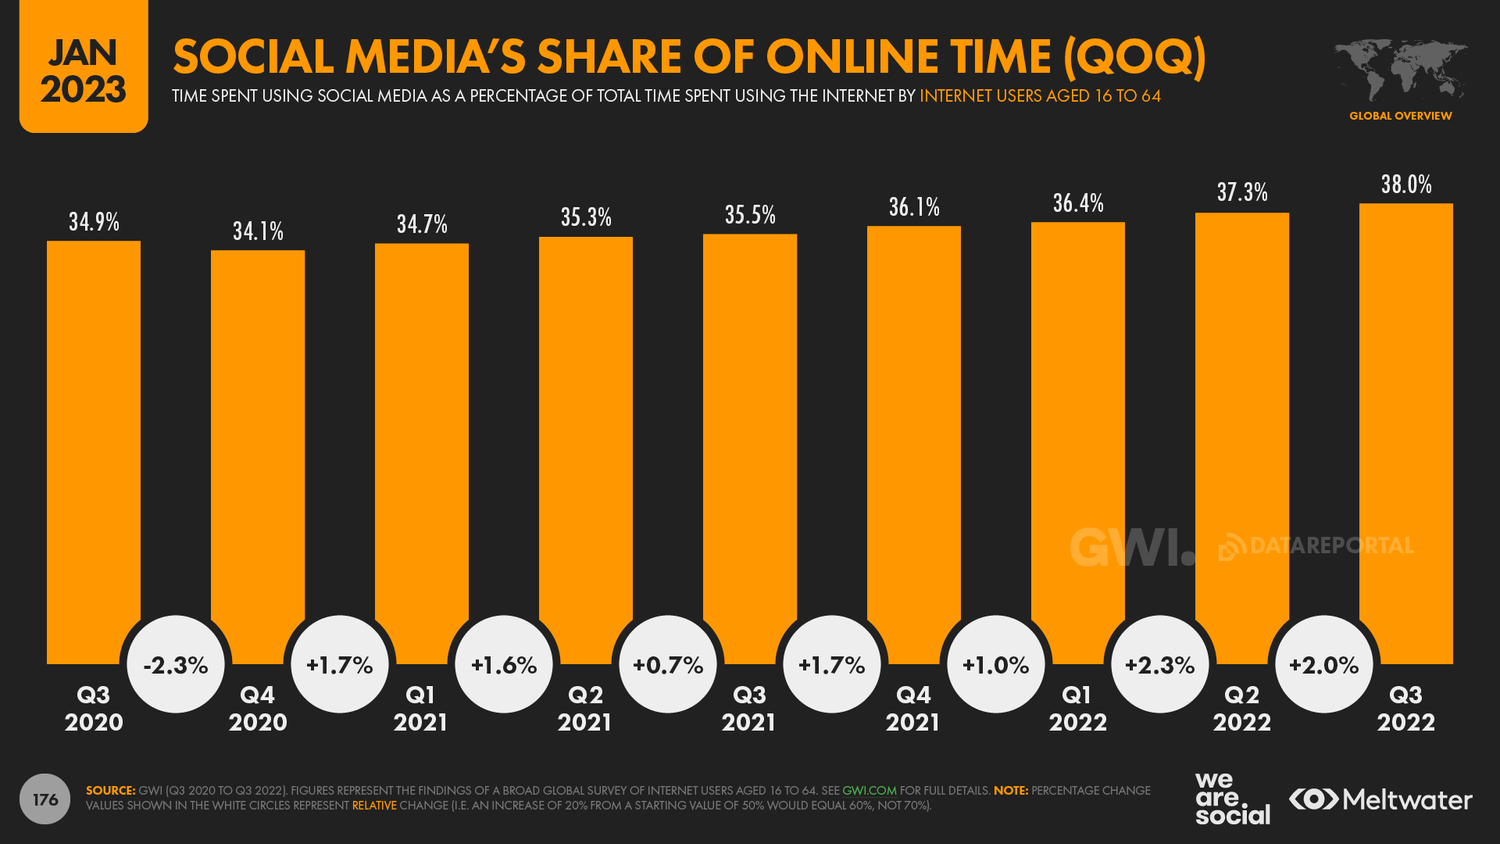
And it’s not just our data indicating this trend. Social media usage as a whole is growing with users spending more time everyday on these platforms. It’s only logical to expect that shopping or increased interest in brand content will result in more online purchases.

Image Source

3. Consumers will be pickier with which companies they buy from.

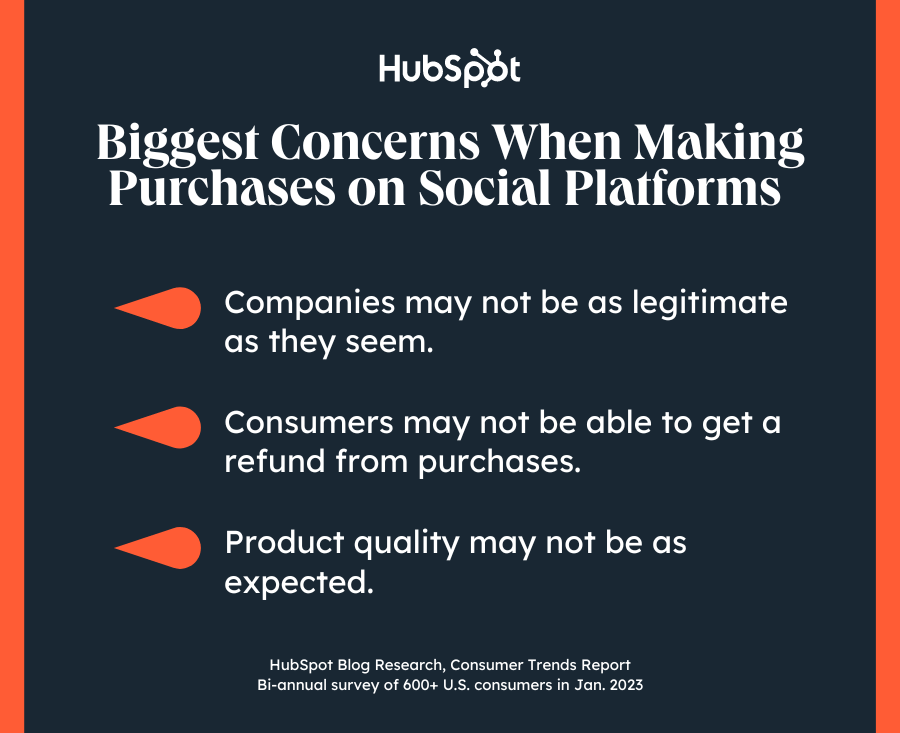
The three biggest concerns social media users have when it comes to making purchases on social platforms are that the companies aren’t legitimate (54%), that they won’t be able to get a refund (48%), and concerns about the quality of the products being sold (44%).

We predict that more consumers will be shopping on social media, however, the brands they’ll buy from will have to prove their legitimacy, quality, and policy before they expect buyers to click purchase.

Brands with a social media presence will have to refine their brand identity to be more trustworthy and set realistic expectations for followers about the image and features of a product.

Keep an Eye on Consumer Behavior

Consumer behavior will change as the year progresses, and marketers should try to understand using informed decision-making. While these are only predictions, you should study your target audience for any changes in their behavior that you can prepare for to keep them loyal.

New Call-to-action

Categories B2B

How Marketers Can Still Thrive in a Recession [Data Analysis]

When life gives you lemons, make lemonade. Right?

In a recent Glimpse survey I ran for the HubSpot Blog, 78% of marketers said they were already facing one of the biggest lemons of 2023 — recession.

What’s more, almost half were already seeing negative impacts. On top of that, one in three think a recession will have an even bigger impact on marketing than COVID-19.

While we can’t predict the future, our data hints that brands that focus on the right opportunities can still grow. But, what exactly are those opportunities? Read on to find out.

Download Now: 2022 State of U.S. Consumer Trends Report

Tips for Marketing Growth a Recession

1. Use data to connect with customers.

Feel like you might not be in touch with your customers anymore? You’re not alone.

Our research shows that over half of marketers don’t know crucial information about their target audience. And this is just one of three signs your company is facing a Crisis of Disconnection.

This disconnect isn’t at all shocking. Our lives have all changed drastically over the past three years. 

As the recession progresses, customer relationships with brands will continue shifting — and it’s up to companies to keep up.

The first step is gathering holistic, real-time data on consumer attitudes, preferences, and behaviors.

Ideally, you get data, known as first-party data, directly from your customer. This is especially important as data privacy regulations are becoming more strict and things like third-party cookies are on the way out.

Once you have data, use it to understand your evolving customer and pivot your marketing efforts and messaging in a way that aligns with what they’re experiencing. This helps your brand create meaningful connections.

Unsure where to start with your data strategy? Read this guide.

2. Don’t let low social media budgets stifle your creativity.

A recession means your marketing budget will likely be in a pinch — our economic trends survey from Oct. ‘22 found that 37% of marketers are already seeing budget cuts.

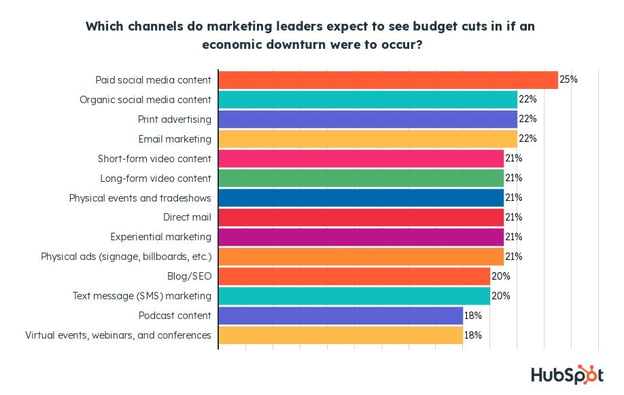
And according to marketing leaders, paid social media content is the channel most likely to be cut in a recession.

where marketing leaders expect to see budget cuts

Luckily, there are a few highly effective places for your brand to turn.

User Generated Content

User-generated content is all about your satisfied customers sharing their experiences with your brand on social media.

Sharing and interacting with UGC on your official page will deepen connections with your customers and incentivize others to share their stories too. This is a great way to promote your brand in an authentic and credible way.

Organic Social Media Content

Tapping into organic content on social is a no-brainer when budgets are tight. Instead of spending money on paid ads, create content tailored to the interests of your audience and let the algorithms do the rest.

The best part is you don’t need anything fancy to succeed on social these days – authentic and relatable content wins over polish and high production value any day.

Create a few fun pieces of content, analyze your results, lean into what’s performing best, and sit back as  your audience grows.

New Platforms and Features

Nowadays it seems like new marketing channels pop up every month, and the good news is they’re usually free.

Leveraging new social media features and trends like live audio could also enable your brand to be the first to enter or master an exciting space.

BeReal is a great example of a new social platform that blew up this year, offering a chance for brands to reach their audience on a platform that isn’t yet saturated with ads.

3. Lean into the brand loyalty you have.

While consumers suggest that brand loyalty will matter less in a recession, marketing leaders are still confident brand loyalty and trust will play a role in purchases during the recession.

We asked 500 marketing leaders how they expect consumers to react in a recession, and 39% believe shoppers will stick to brands they are most loyal to.

It makes sense that people might continue to invest precious dollars in products from brands they know and love, rather than risking money on a poor experience or bad product quality from a new company.

You can use this as an opportunity to reward your most loyal customers and build deeper connections with them.

Whether you offer a discount code to your most frequent customers or send them a personalized card thanking them for their loyalty, little tokens of appreciation can go a long way. This could combine the benefits of cost-effectiveness and customer loyalty.

4. Keep growing your audience.

There’s another side to the coin — 28% of marketing leaders also say that, in a recession, consumers are more willing to try new brands. While this might be less common, there’s still an opportunity for marketers to grow their audiences and market share.

For example, if a customer is frustrated with a competitor’s service, the experience they provide, or lacks trust for the brand, they might be less willing to spend the hard-earned pennies they’ve saved in an uncertain time. But, if your brand catches these ex-customers with great marketing at the right time, they might be willing to try investing in you. 

5. Promote low-cost or high-value products.

If you sell fairly affordable products, there’s another factor at play that could help you meet new targets during poor economic times.

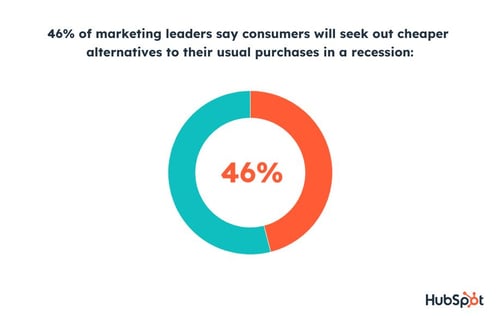
46% of marketing leaders say consumers will simply seek out cheaper alternatives to their usual purchases in a recession, which aligns with earlier consumer research.

46% of consumers will seek out cheaper product alternatives in a recession

If your products are cheaper or provide better bang for the buck than competitors’, focus on gaining market share from customers who previously swore by pricier options.

Meanwhile, luxury brands can focus on marketing the added value customers get for shopping with them. For example, a brand selling hand-stitched leather wallets can position itself as a longer-lasting alternative to a discount wallet.

6. Save time and money with AI and automation.

When it comes to shrinking resources, nothing’s more important than saving time and money. Luckily, that’s what automation is all about.

AI and automation can help you trim your budget in a few ways.

First, you can automate repetitive and manual tasks, from email marketing to social posts and ad campaigns. This not only saves you time, but prevents you to work heads-down on heavier-lift high-impact projects.

AI can also help you optimize your marketing efforts, improving your targeting and bringing down costs.

Lastly, automation and AI can help you give customers a more personalized experience. Ultimately, making it easier to reach audiences with the right message at the right time.

While convenient, this type of technology can seem hard to implement at first. Luckily, software like HubSpot can help. For example, many Marketing Hub and CRM features already bake AI or automation in to make onboarding, implementation, and usage easier — even for those who are less tech-savvy. 

Remember: It’s Not Your First (or Last) Unprecedented Time

While recession news can make anyone nervous, remember that you aren’t alone.

And, if you’ve been a marketer since 2020, you’ve gained a lot of training in pivoting, adjusting to minimal resources, and meeting customer needs in unprecedented times.

While we’ve created the list above as a starting point for recession planning, you’ll want to analyze your industry, customer base, and performance to determine how things could shift and what to prepare for next.

Now that you’ve read our data-based predictions on what tactics might help you, learn how marketers at all levels are already pivoting during this time to compare, contrast, and identify even more ways to retain and gain audiences.

And, keep checking out the blog for more data, expert insights, and guides on how to navigate all the marketing pivots that might be headed your way.

New Call-to-action

Categories B2B

6 Marketing AI Predictions to Watch in 2023

AI has gone mainstream, and it’s slowly creeping into the day-to-day lives of marketers.

Although this technology is still in its early stages, it’s already changing how we work. With the help of AI-powered tools, marketers can automate a variety of tasks, from drafting email subject lines to scaling entire marketing campaigns.

If you’re curious about where AI is going — and how you can leverage it — we’ve listed six AI predictions to watch in 2023.

Free Guide: How to Use AI in Content Marketing [Download Now]

1. AI will give content marketers a significant lift.

Sure, artificial intelligence isn’t close to writing the next New York Times best seller. But it can streamline many content marketing tasks. Specifically, it can give marketers a lift in the writing process.

For example, picture a content marketer stuck in the content ideation stage. Instead of waiting for inspiration to strike, she inputs a prompt into an AI chatbot — such as, “Provide a few blog ideas about TikTok marketing” — and receives a list of ideas to get the ball rolling.

AI tools — like ChatGPT, Jasper, and HubSpot’s content assistant — can also do much of the legwork when it comes to research. These tools use complex algorithms to gather, analyze, and interpret information from across the web, identifying patterns and trends in a matter of seconds.

For example, suppose you need to write a video script to promote a product. To get started, you paste hundreds of customer reviews into an AI chatbot and ask it to summarize the key takeaways. Then, you use its output as a rough draft. In the end, you have a new ad highlighting everything your customers love about the product — and you did it in a fraction of the time.

Ultimately, we predict that AI will assist content marketers by executing tedious, repetitive tasks — like coming up with ideas, writing rough drafts, and summarizing large amounts of data.

2. Consumers will demand more personalization, and AI can make it happen.

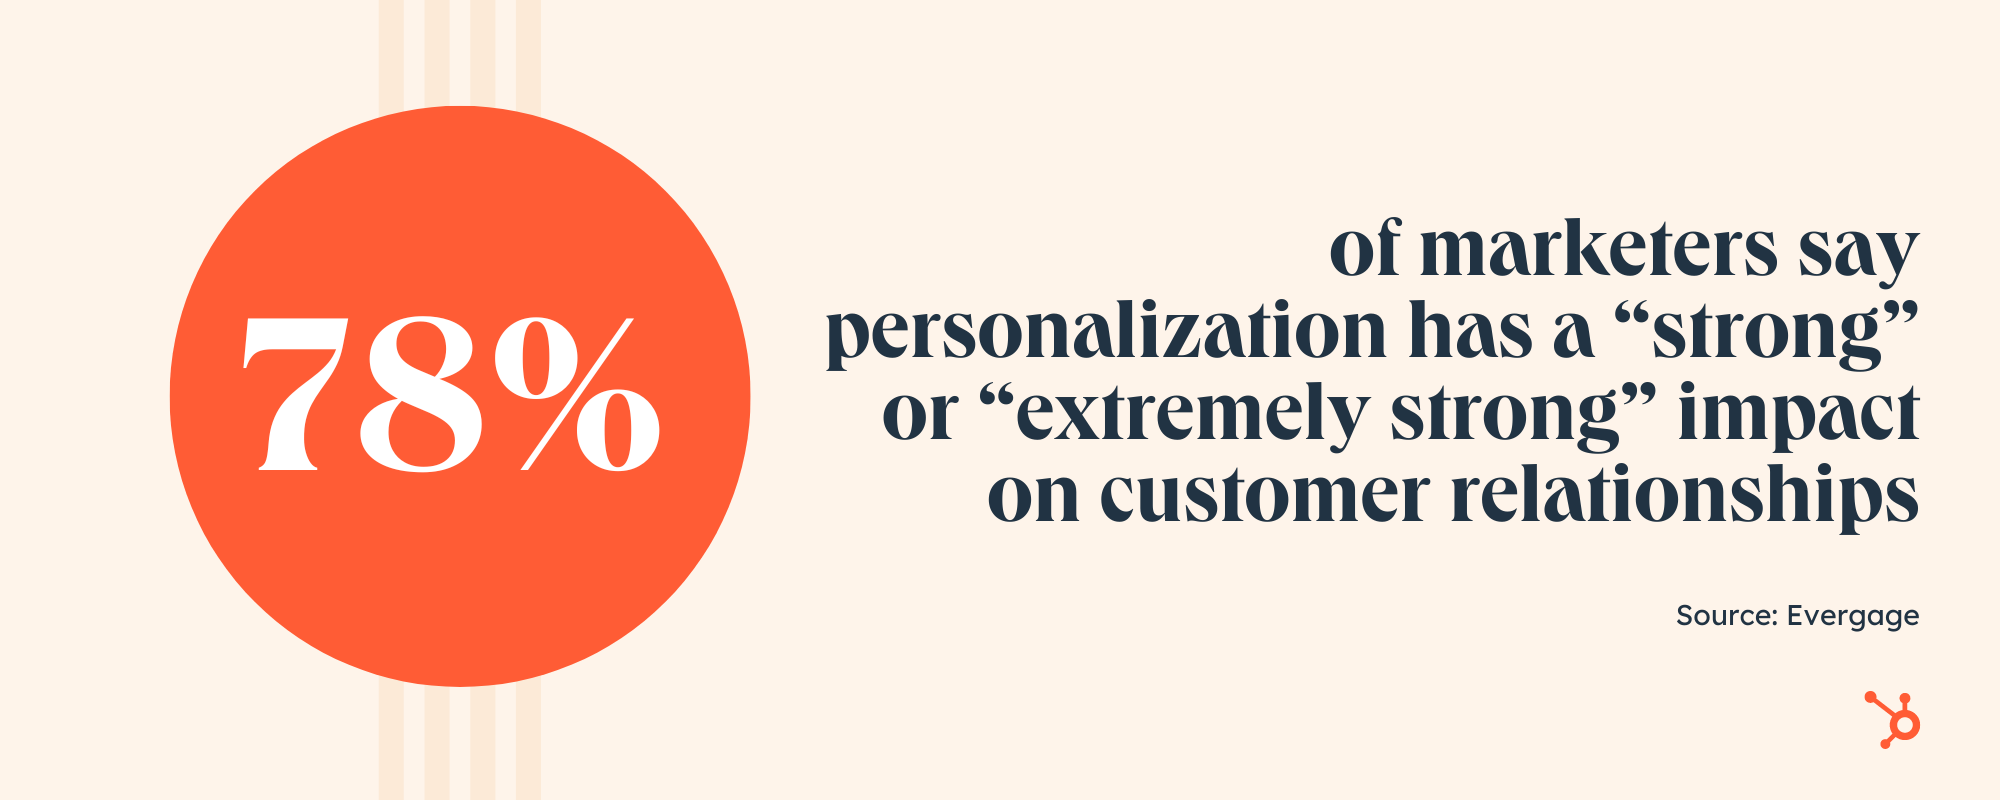
78% of marketers say personalization has a “strong” or “extremely strong” impact on customer relationships.

While it was once extremely hard to create these experiences with older marketing techniques and technology, AI has opened the door for more pinpointed personalization opportunities.

Marketing AI Predictions: more personalization

Right now, AI is primarily used to help us “get things done,” but it has the power to help marketers scale faster, personalize more, and find target audiences easily.

We’re already seeing heavy AI personalization in the marketing industry. For example, many tools allow brands to send marketing emails with names and personalized information based on contact list information. In retail, consumers regularly get emails or e-commerce recommendations for certain products based on what they’ve recently viewed or purchased.

With evolving technology and our ability to capture data on prospects and customers, it’s not shocking to think that AI-based personalization trend will grow stronger in the near future. In 2023 specifically, expect AI to be used more and more to create solid one-to-one personalization.

3. We’ll see an influx of mediocre content generated by AI.

Because AI can churn out content at lightning speeds, some marketers may ramp up their content demands too quickly. As a result, we’ll see an influx of AI-generated content that’s far from perfect.

This leads to an important point: AI is better left for the first draft, not the last. For example, AI-written content may look flawless on the surface, but it lacks critical human elements, like humor, empathy, and cultural context.

Copying and pasting it’s output into your marketing isn’t enough. You need to add your own brand voice and perspective.

On top of that, generative AI works with limited data, so the information it uses may be outdated, incorrect, or even biased. To get around this, marketers must put guardrails in place to maintain quality.

4. Companies will embrace “Responsible AI.”

To state the obvious, AI systems rely on data to make decisions. This data comes from various places, including social media posts, online databases, public records, and general online activity (e.g., posting a review on Yelp).

While this process seems harmless enough, it can reveal a lot about a person’s life. What’s more, consumers may not be aware that their information is being used to make decisions that can affect them.

Currently, companies are expected to self-regulate when it comes to using AI. But as privacy concerns continue to mount, we predict more companies will implement their own AI guidelines.

Marketing AI Predictions: responsible AI

For example, Microsoft has developed its own Responsible AI Standard which relies on six principles: fairness, reliability and safety, privacy and security, inclusiveness, transparency, and accountability.

Ultimately, data is the fuel for most AI systems. The problem? If consumers don’t trust AI, they’ll keep a safe distance. Therefore, accountability and transparency from companies will go a long way in 2023.

5. AI will become a secret weapon for SEO strategists.

We predict SEO strategists will reap huge benefits from AI in the coming year, thanks to its ability to automate time-consuming tasks.

This type of self-driving technology can identify relevant keywords, conduct competitive analysis, and optimize webpages, such as fixing broken links, duplicate content, and incomplete meta descriptions.

For example, Campbell’s Soup uses AI-powered SEO automation to compress 75,000 images in a single day. This allows the brand to rank on page one of SERPs for 4,000 keywords within a few weeks.

The best part? AI is helping human SEO marketers rather than making their jobs obsolete. AI technology allows SEO experts to get results that aren’t possible without machines. Not worrying about a mountain of SEO-related tasks frees them up to work on more intensive projects.

Because it benefits web traffic and results, expect the investment into AI-powered SEO tools to grow.

6. AI will fit more naturally into the daily lives of marketers.

AI is already having a huge impact on the marketing industry. That said, many marketers are still exploring AI and its potential.

Those who embrace this technology — and integrate it into their workflow— can maintain a competitive edge while saving time in the process. 

As AI tools get more user-friendly, eventually they’ll becoming so natural to your work that you don’t notice it. As John McCarthy, one of the fathers of AI, once said, “As soon as it works, no one calls it AI anymore.”

Back to You

It’s 2023, and AI has gone mainstream. There’s no denying its potential to transform a variety of industries, and marketing is no exception. It can help companies create more, scale faster, and build more personalized experiences. But to pull it off, marketers must stay agile as they embrace and innovate with AI.

New Call-to-action

Categories B2B

How to Find SERP Feature Opportunities [+ Free Tools]

Search engine results pages (SERPs) have become a critical battleground for businesses, with SERP features increasing in visibility and importance.

→ Download Now: SEO Starter Pack [Free Kit]

Considering the fact that the top 3 Google search results get 54.4% of all clicks, SERP features eat up a whopping amount of organic traffic — 18.5% for featured snippets alone.

With SERP features becoming ever-present, understanding how they work and how to maximize them has never been more essential. In this article, you’ll learn how to find SERP feature opportunities. You’ll also get real-life examples and advice from SEO pros.

Table of Contents

What does SERP mean anyway?

SERP stands for Search Engine Results Page. It’s the page that search engines, like Google or Bing, display after a user queries a keyword or phrase. The SERP is usually populated with blue links and different SERP features that are intended to instantly fulfill a search query.

SERP features include featured snippets, local packs, news boxes, images, videos, and more.

SEO pros optimize their content for SERP features to drive more organic traffic to their website.

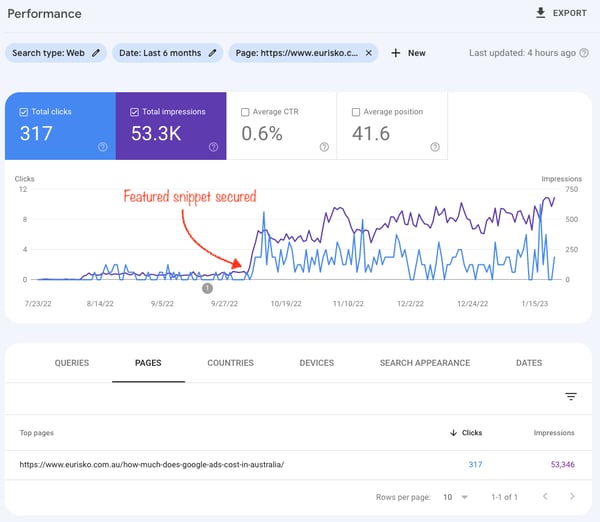
Include the search question in the page title and [rewrite] the question in the H1 tag. Answer the question as clearly as possible in the first paragraph, also including some relevant keywords from the questions. Bold the answer to help the reader find it as quickly as possible, says Jamie Press, Digital Marketing Specialist at Eurisko.

A featured snippet has skyrocketed organic traffic for Eurisko.

Image Source: Jamie Press, Digital Marketing Specialist at Eurisko

How to Rank in SERP Features

Search engines use a variety of factors to decide which content is worthy of a SERP feature. To help you optimize your content, we’ve listed some of the most common SERP features and provided practical tips on how to get your content to stand out.

You’ll also see pieces of advice from top-notch SEO practitioners. Let’s dive in!

Featured Snippets

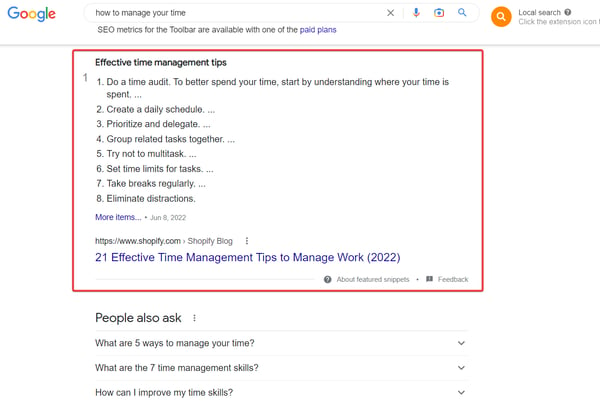
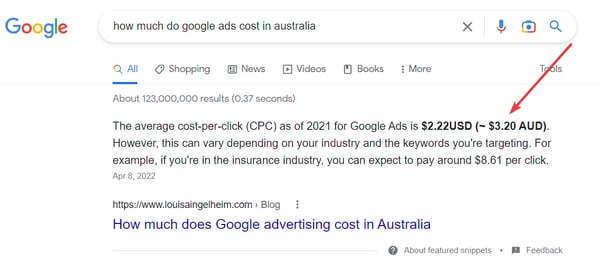
An example of a featured snippet in the list format.

Featured snippets (FS) appear at position #1 of search results about 98% of the time and provide a summary of the best answer to a user’s query.

In most cases, Google pulls out the summary from one of the top 10 ranking pages. When your article wins a featured snippet, you can jump from being ranked #7 to the top spot #1 in an instant.

To optimize your content for featured snippets, you should:

  • Dig into the questions that your target audience is asking.
    • Look for such queries in the People Also Ask section and analyze search questions with SEO tools like Ahrefs, AlsoAsked, or Semrush. Create copy that strictly answers the user’s search query.
  • Use header tags (H1, H2, H3, etc.) to structure your content and make it easy for search engines to understand the main points. Include keywords and search questions in these headings.
  • The content should be between 54-58 words long for a paragraph intended for a featured snippet.
  • Include the search question in the page title and rewrite the question in the H1 tag.
  • Use lists, tables, and other formats that can be easily extracted for a featured snippet.

Bold the main points to improve time on the page and the reading experience.

  • Supplement content with relevant images that illustrate your main points, meet the user’s search intent and the primary keyword, and make the reading experience a whole lot more enjoyable.
  • Add an image under the paragraph and use the keyword that triggers the featured snippet as an image alt text to win the thumbnail, from John Ozuysal, Co-Founder and CMO at Datapad.

Win SERP features with thumbnails.

In contrast to a super structured approach, Sara Bodner from Conklin Media offers a slightly different way to win featured snippets.

She discovered that it’s helpful to include the primary long-tail keyword (a question) you’re targeting in an introduction paragraph rather than allocating a standalone heading. Then, Bodner bolds the question and answer summed up in a couple of sentences.

Play with formatting to influence SERP features.

Image Source

Another way to beat the competition is to build some internal and external links to the piece. This signals to Google that your content is more worthy to be featured in snippets.

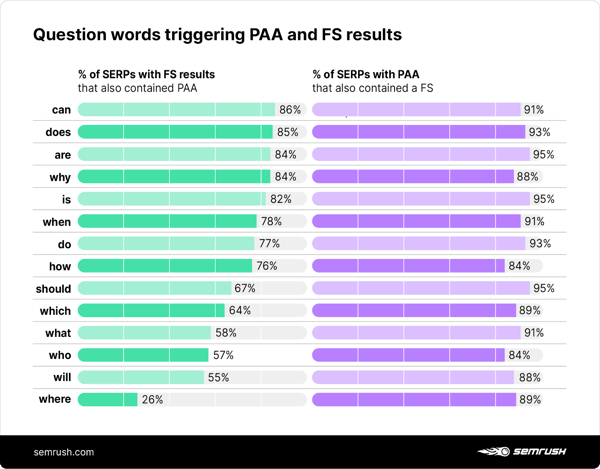
Pro tip: Start your headings with “what,” “why,” “does,” “where,” and other question words to trigger FS and PAA. Sprinkle them within the headings and the copy. This way, you’re increasing the chances to compete for SERP features up to 86%, as a Semrush study shows.

chart showing question words triggering PAA and FS results

Image Source

People Also Ask

Now, let’s learn how to compete for the People Also Ask feature. By winning this SERP’s real estate, your organic traffic can double since your content might appear twice on the first Google page.

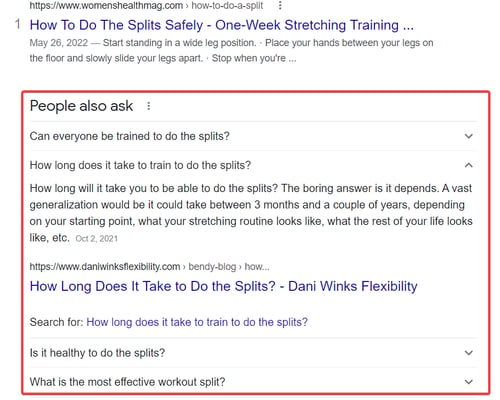
A snapshot of PAA

A People Also Ask (PAA) feature appears as a list of related questions and answers to the search query in the SERPs. The following steps will help you rank in PAA:

“Examine the SERP to spot common questions users are asking about the topic in the Related searches and PAA and use autocomplete data tools like AnswerThePublic and Answer Socrats,” suggests Jaden Oh, Director of Search TRAFFV.

Likewise, you can opt for tools like Also Asked and People also ask by Frase to discover search questions.

  • Don’t worry about the search volume. Long-tail keywords usually have zero search volume, yet the chances of your content appearing in FS and PAA surge up to 73% as the number of words in the query increases to up to 10 words.
  • Tweak your H2s and H3s — include the secondary keywords.
  • Another practice is to dedicate the FAQ chapter at the bottom of an article and answer 3 to 6 subject-related questions. Use FAQ schema markup to provide additional context about your content to search engines.

Olga Mykhoparkina, Founder of Quoleady, agrees with this advice:

“Whenever we write a content brief for an article, we try to allocate a section at the end of the blog article called FAQ. There we put all the PAA questions followed by short, value-packed answers. No vague or watery statements whatsoever. Google usually picks it up and includes one of the answers in PAA.”

Local Pack (3-Pack)

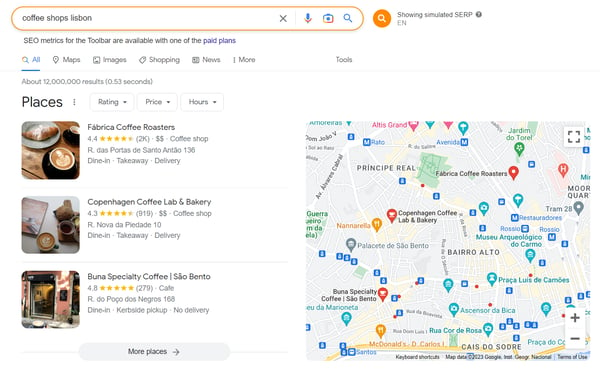
A snapshot of 3-Pack for local searches.

A Local pack or 3-pack appears for search queries with local intent, such as “best Italian restaurant in [city].” This SERP lists relevant businesses with their addresses, phone numbers, and reviews. To rank your site in local packs, you should:

  • Ensure your Google My Business profile is up-to-date and complete with accurate NAP information, such as your business name, address, phone number, hours of operation, and reviews.
  • Optimize your website for local SEO by including your city and state in your title tags and meta descriptions.
  • Encourage customers to leave reviews on your Google My Business profile and other review sites to propel Google to rank you higher in the local pack.
  • Build high-quality local backlinks from relevant websites in your niche to pump up the site’s credibility and authority in Google’s eyes.

Image Pack

An example of the Image Pack.

An Image Pack is triggered when a search engine detects the user’s intent to see images. If your business can benefit by showcasing its products through images, we recommend you optimize your page for being listed in the image pack.

  • Use high-resolution, unique images with descriptive and keyword-rich file names (e.g., image-pack-serp-features-opportunities.png), alt tags, and captions.
  • Use ImageObject schema markup to provide additional context about the images to search engines. To get your company to rank in the Image Pack “include your image URL in the code, such as a headshot or logo within ‘Person’ or ‘Organization’ schema markup. “Ensure these types of Schema are only used on one relevant page on your site,” says Allie Kotula, SEO Director at Terakeet.
  • Host your images on a reliable and fast server to avoid any issues with loading time.
  • Interlink content on your site using relevant keywords in the anchor text to pass link equity and help the article climb in rankings and most likely secure a spot in the image pack.

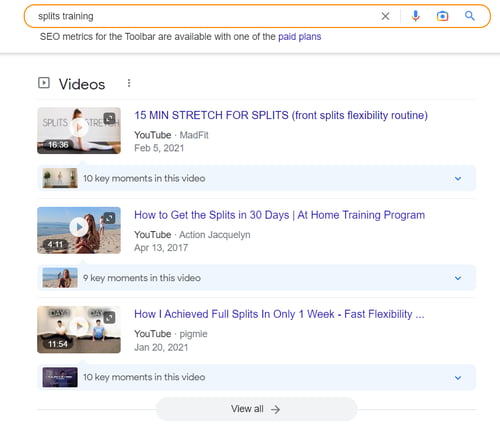
Video Pack

The Video Pack feature in the SERP

Google adds Video Pack to the SERP. Video packs typically appear for “how-to” content, webinars, product reviews, etc. To optimize your content for the video pack, follow these rules:

  • Give your videos explanatory titles, descriptions, and tags. Select an enticing thumbnail image. Consider adding a transcript to make your video more accessible.
  • Include primary and secondary keywords in the video title and description respectively.
  • Use casual language to name videos as if you were searching via voice.
  • Host your videos on YouTube so that Google shows them in the SERP. Plus, YouTube provides an abundance of tools for optimizing your content to be displayed more frequently in the SERPs.
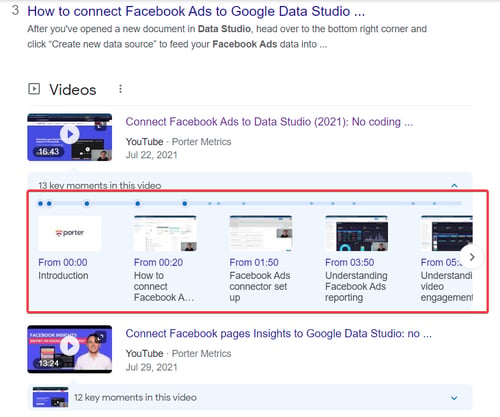
  • “Always break down the video chapters by using similar H2s and H3s that you put on blog posts. Publish videos on YouTube and add them to relevant articles,” says Juan Bello, Co-Founder at Porter Metrics. This tactic helps Porter win video packs almost every time and drive qualified leads.

Optimize your videos for SEO

Embedded videos hosted elsewhere, like Vimeo, require VideoObject schema markup to be eligible for this feature. Check out best practices on how to get videos in the SERP recommended by Google.

Product Pack

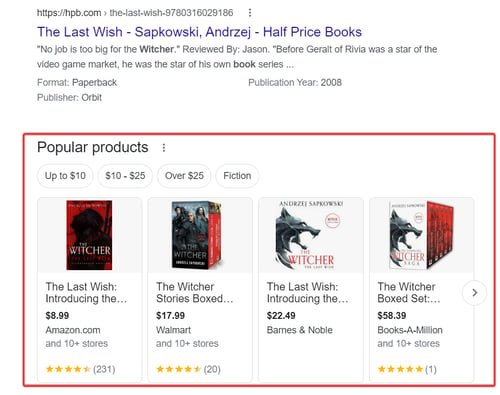
The listing of the popular products

Product Packs appear in a carousel format and showcase a collection of related products based on a user’s search query. These packs often appear for queries such as “best running shoes” or “iphone 12 pro max price” and can be an effective way to drive traffic and sales to your website.

Use these tips to secure your spot in the Product Pack and optimize your e-commerce website for maximum impact:

  • Ensure your products are indexed by Google by submitting a sitemap to Google Search Console.
  • Use structured data (schema.org) to mark up your product pages to help search engines understand the context of your pages. Farasat Khan from Scalable Media suggests enriching structured data with the following:
    • @context and @type that specify that this is a product schema.
    • The name of the product.
    • An image with an array of URLs for the product’s images.
    • A description with a detailed description of the product.
    • The SKU, or the product’s stock-keeping unit (SKU) number.
    • The brand of the product.
    • Offers that include information about the product’s price, availability, and link to the product page.
  • To validate the product snippets your eCommerce store ranks in, head over to the search console and review the valid items in the “Shopping > Product Snippets” tab.
  • Optimize your product pages for relevant keywords. Include them in titles, meta tags, and on-page content.
  • Use high-quality images and videos to demonstrate your products.
  • Encourage customer reviews on your website, as search engines use them to determine the relevancy and ranking of your products.
  • Build backlinks to your product pages from reputable websites in your niche.

Pro tip: Use Schema Validator to ensure your product pages are properly optimized and Schema Mark Up generator to speed up the creation of JSON-LD markups.

It is important to note that these are not the only types of SERP features, and the weight given to each factor can vary depending on the search query and other ranking factors.

Additionally, search engines are constantly updating their algorithms, so it’s vital to stay up-to-date with the latest SEO trends and best practices.

How to Find SERP Feature Opportunities

There are several strategies for how to spot SERP feature opportunities to rank in PAA, video and image packs, and featured snippets. Those tactics depend on whether you’re creating new content or updating existing pieces.

New Content Best Practices

All strategies can be boiled down to these two essential steps.

1. Research keywords and topics for your niche.

Look for long-tail keywords and questions with keyword research tools, like Semrush, Ahrefs, or AnswerThePublic.

Utilizing long-tail keywords is essential because these often have lower competition and make great targets for gaining SERP real estate with structured data-rich answers. The more specific the query, the better the chance you appear in featured snippets or PAA.

Lee Moskowitz, Director of Growth Marketing at SetSail, begins the process by establishing demand for certain keywords.

“First, I work to establish that a demand exists. Start with the essentials and leverage keyword tools and the “people also ask” section. Then, I read queries that my audience asks on platforms other than Google, such as LinkedIn or within specialist online communities [Facebook Groups, Slack channels, Discord channels, etc],” Moskowitz says.

2. Conduct a SERP analysis.

When looking for SERP feature opportunities, start by examining competing pages. Take note of the following:

  • Their page and content structure.
  • hat keywords appear in the headings.
  • How many internal and external links are pointing out to this page.
  • How many images are distributed throughout the piece.
  • Alt text on images.
  • Analyze the length of the text of the current SERP features and its formatting (e.g. bold, italic, highlighted, a list, a table, a question, etc.).

If you’re targeting highly competitive keywords, think about how to craft a piece that can outrank existing content in the SERP. Maybe those are missing out on expert quotes, supplementary illustrations, or real-life examples, or their content is overall weak and watery.

If the current sites in SERP features are tough to win over, bet on long-tail keywords considering the user search intent. Target queries that don’t currently have a featured snippet but should have one.

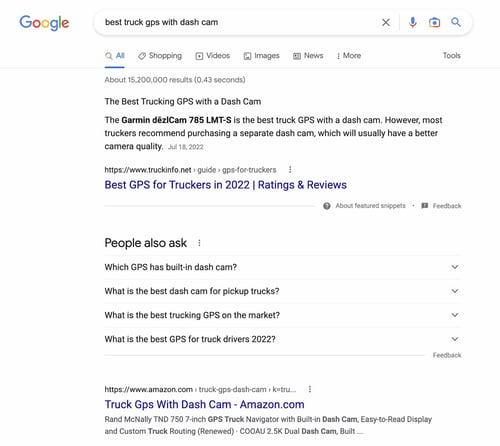
“For example, if Google is using a featured snippet for ‘best gps for truckers’ and there is a high demand for ‘best truck gps with dash cam’ but no featured snippet, it’s possible that Google wants to provide the one but lacks quality content. Hence, I create a page for such keywords,” explains Kyle Fretwell, founder of TruckInfo.

By chasing long-tail keywords, Fretwell regularly wins featured snippets, outcompeting giants like Amazon.

how to find SERP feature opportunity example

Best Practices for Existing Pages

You may rank high but not get real estate in SERP features. This could result in high impressions but low conversions, as the page that occupies a featured snippet gets the crown. How should you address that? We’ll explain below.

1. Find your top-performing pages and potential winners.

In Google Search Console, find pages that rank for 1-10 positions and copy the URLs. Now, filter out pages from 11 to 20 positions. These are underperforming, though have the potential to grow in rankings and compete for SERP features.

You can also head over to Google Analytics and filter out your somewhat converting pages. Copy their URLs as well.

2. Analyze SERP feature potential with SEO tools.

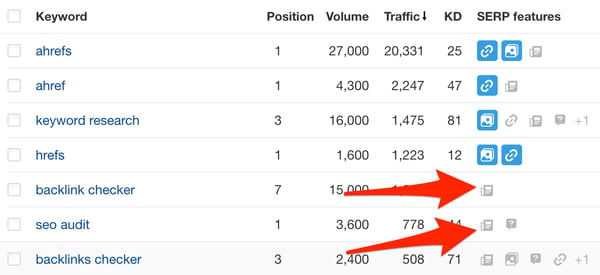
Put the saved URLs into a rank tracking tool like Semrush, Serpstat, SE Ranking, or Ranktracker and check the keywords these pages aren’t ranking for in SERP features. You’ll see those in gray. Blue indicates the URL wins a concrete SERP feature by a specific keyword.

Update your content following the suggestions above and monitor within a month if there are any changes.

Analyze SERP feature potential with SEO tools

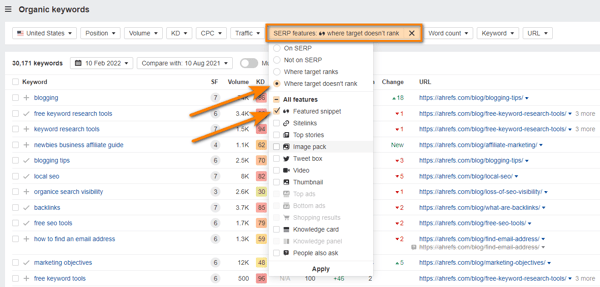
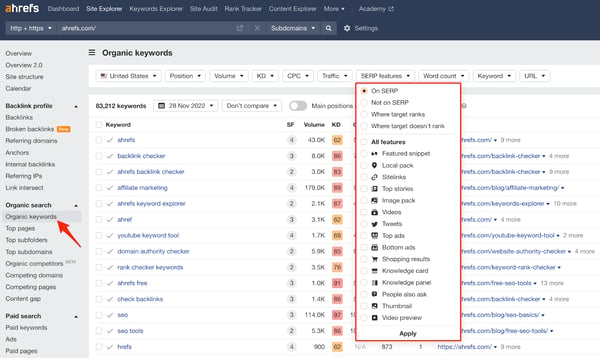
If you haven’t set up rank tracking for those URLs, here’s a simple workaround. Head over to Ahrefs’s Site Explorer and drop those URLs for a batch analysis or simply put your domain.

Apply the filter “SERP features – Where the target doesn’t rank – Choose the feature.” You’ll get the list of keywords that trigger SERP features for someone else but not for your site.

Try to adjust your content to get placed in SERP features.

Analyze SERP feature potential with SEO tools

Image Source

Pro tip: Find quick wins by checking keywords where your site ranks in the top 10 that have featured snippets, but another website owns them.

6 Tools to Help You Find SERP Opportunities

Whether you’re targeting SERP features for existing or new content, we’ve compiled the top 5 SEO tools to help you discover SERP opportunities. These tools are versatile and equipped with features for backlink analysis, rank tracking, keyword research, and more.

Choose the one that meets your budget and your current needs. The tools are listed in no particular order.

Semrush

 Semrush; SEO tools

Semrush is an all-in-one SEO platform that offers a suite of tools for keyword research, rank tracking, site audit, and more.

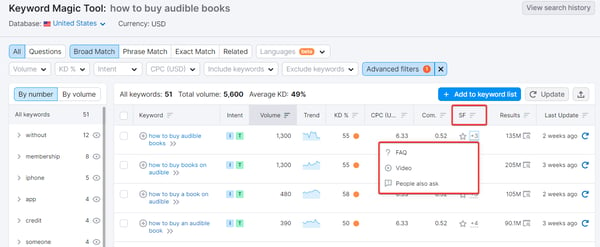
With its key feature, the Keyword Magic Tool, you can easily find the most relevant keywords for your content and see which SERP features are appearing for specific keywords and what type of content is ranking in those features.

Pricing: Plans start at $119.95 monthly. A freemium plan is available but is limited to 10 searches per day.

Best for: Finding SERP opportunities for new content through keyword research. Also ideal for medium to large businesses.

SE Ranking

SE Ranking is known for its rank tracking tool

Image Source

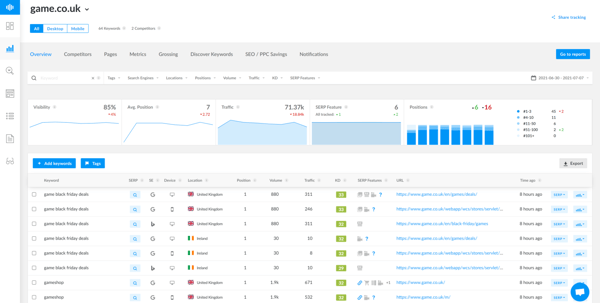
SE Ranking is known for its rank-tracking tool with tons of custom filters, SERP storms, and more. This tool allows you to monitor your website’s ranking for specific keywords over time, giving you a clear understanding of your website’s performance in search results.

SE Ranking’s rank tracker tells you which SERP features your website is appearing in and which ones it’s not. How should you act on that information?

For example, if you see that your website is ranking well for a specific keyword but is not appearing in the “People Also Ask” or “Related Questions” SERP features, you can focus your efforts on optimizing your content for these features, like adding the FAQ section, to increase your visibility in search results.

Pricing: The Essential plan starts at $39 monthly with daily rank-checking frequency.

Best for: Individuals, small and medium teams; enterprises looking for customizable plans.

Ahrefs

Ahrefs SEO tool

Known as the best tool for backlink analysis, Ahrefs offers plenty of professional features for competitor analysis and keyword research. For instance, the Site Explorer tool allows you to see what SERP features your competitors and you are appearing in and with what keywords.

You can also compare the number and quality of backlinks pointing to competing URLs. They might influence the occurrence of SERP features as well.

Pricing: Plans start at $99 monthly. A limited freemium version is available for users who verified the site’s ownership.

Best for: SMB and enterprise-level companies looking for a solid tool for backlink analysis and keyword research.

Serpstat

Serpstat is an all-in-one SEO platform

Serpstat is an all-in-one SEO platform for small and medium businesses that offers keyword research, rank tracking tool, site audit, and its own backlink database.

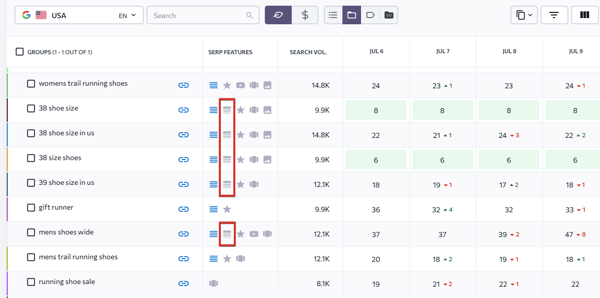
You can find SERP feature opportunities when exploring keyword research tools (as shown in the screenshot above) and within its rank tracking report.

Pricing: Plans start at $69 monthly. A freemium plan is available for 10 queries per day.

Best for: Competitor analysis and rank tracking.

AlsoAsked

AlsoAsked SEO tool

Image Source

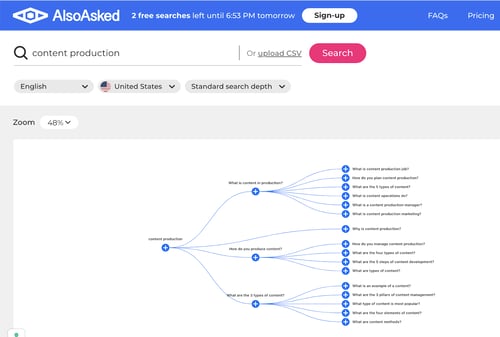
AlsoAsked is your goldmine for geo-specific “People Also Ask” questions. Type any query and get an abundance of suggestions for the FAQ section, H2s, and H3s.

Pricing: Plans start at $15 monthly. A freemium plan includes 3 searches per day.

Best for: Exploring search questions to optimize for featured snippets and PAA.

Ranktracker

Ranktracker SEO tool

Image Source

Ranktracker is your best choice for both keyword research and monitoring positions in the SERP. It offers 100 keywords for daily tracking and 100 keyword suggestions per search. Like with other tools, you can find keywords with SERP features potential.

Pricing: As low as $16.20 per month with a 7-day trial available.

Best for: Small SEO projects.

Free Ranking Tools

Starting out your SEO journey and are short on budget for paid SEO tools? We feel you. Take advantage of these tools to start tracking whether you’ve secured SERP features.

All the tools are absolutely free.

Keyword Rank Checker by Ahrefs

Keyword rank checker by Ahrefs

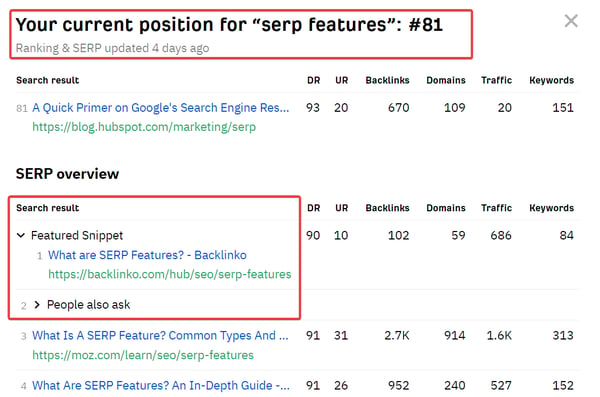
Open up this tool and enter your keyword and domain to check your position and see the SERP completely for free. Keyword Rank Checker takes a snapshot of the top 10 positions and highlights your current position for the keyword, even though it’s not in the top 10 yet.

You’ll also see what SERP features Google elevates for the keyword.

Google Search Console

Find SERP features opportunities with GSC.

Let’s not forget that Google also offers free tools for analyzing your site performance in the Google Search Console.

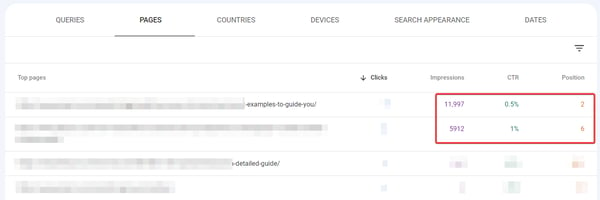
Head over to the Pages or Queries report and sort the data by low CTR and high position from 2 to 5. The likelihood is that several SERP features are showing up for that query and occupying the entire fold, decreasing your conversions.

Go to Ahrefs’s Keyword Rank Checker or do the research manually in the Incognito mode to prove or refute the theory.

Getting Started

SERP features are your surefire way to leapfrog even major players in the SERPs. Start using schema markup, try bolding your key message, create a solid page/content structure, and provide succinct answers to search questions.

SEO tools can help you find even more SERP opportunities. Soon, you’ll be outranking the competition.

marketing

Categories B2B

CV vs. Resume: What’s the difference?

CV vs. resume: Which should you use when applying for a job? If you spend enough time job searching, you’ll likely see a few postings asking for curriculum vitae (CV) rather than a resume.

You’ll probably wonder what the difference is between the two. Since resumes and CVs both serve as documents that help candidates land new jobs, it is easy to confuse them.

To help you distinguish between the two and choose the proper document for your job application, here’s everything you need to know about CVs vs. resumes.

→ Download Now: 12 Resume Templates [Free Download]

What is a CV vs. a Resume?

CV vs. Resume Difference

CV vs. Resume Format

CV vs. Resume Examples

What is a CV vs. a Resume?

A CV provides the complete history of your academic credentials, career, and qualifications. A resume is a more concise document that focuses on your career, skills, and capabilities as they relate to a specific position.

In regions like Europe and Asia, a CV is the same as a resume, so be mindful when applying for jobs abroad. Now that you know what a CV and resume are, let’s explore the differences between the two.

CV vs. Resume Difference

A CV is more in-depth and lengthy than a resume because it gives a more thorough summary of a candidate’s career. A resume is more of a “snapshot” of a candidate’s professional history and skills relevant to the potential employer.

As a result, CVs are often longer than resumes, which are usually only one or two pages.

CVs are commonly used in the UK, Australia, and New Zealand. They are far less common in the U.S. unless a candidate applies for medical, law, science, or academia jobs.

CV vs. Resume Format

Resumes have three basic formats that vary depending on the job seeker’s goals:

  • Functional – Ideal for applicants who are early into their career, are changing careers, or have gaps in their resume.
  • Chronological – Ideal for applicants with at least one year of steady work experience.
  • Combination – Works best for candidates with more than 10 years of experience who want to showcase their skills and job history.

A CV doesn’t have a standard format because the layout depends on the applicant’s industry and desired job. For example, a scientist’s CV will likely focus more on the candidate’s research and published work.

However, a legal CV may highlight a candidate’s work history and skills attained at past law firms.

Furthermore, resumes typically have five sections – contact information, professional summary statement or objective, education, skills, and job history.

A CV will also require that information, but some need more sections to adhere to industry norms.

Here’s a breakdown of what to include in a CV:

  • Your contact information
  • A summary of your professional profile
  • Detailed work history
  • Education
  • Professional skills

Depending on the industry, you’ll also want to include other information such as:

  • Publications
  • Awards
  • Certificates and licenses
  • Volunteer work
  • Languages
  • Grants, scholarships, and fellowships
  • Teaching and lecturing experience
  • Professional associations and memberships

CV vs. Resume Examples

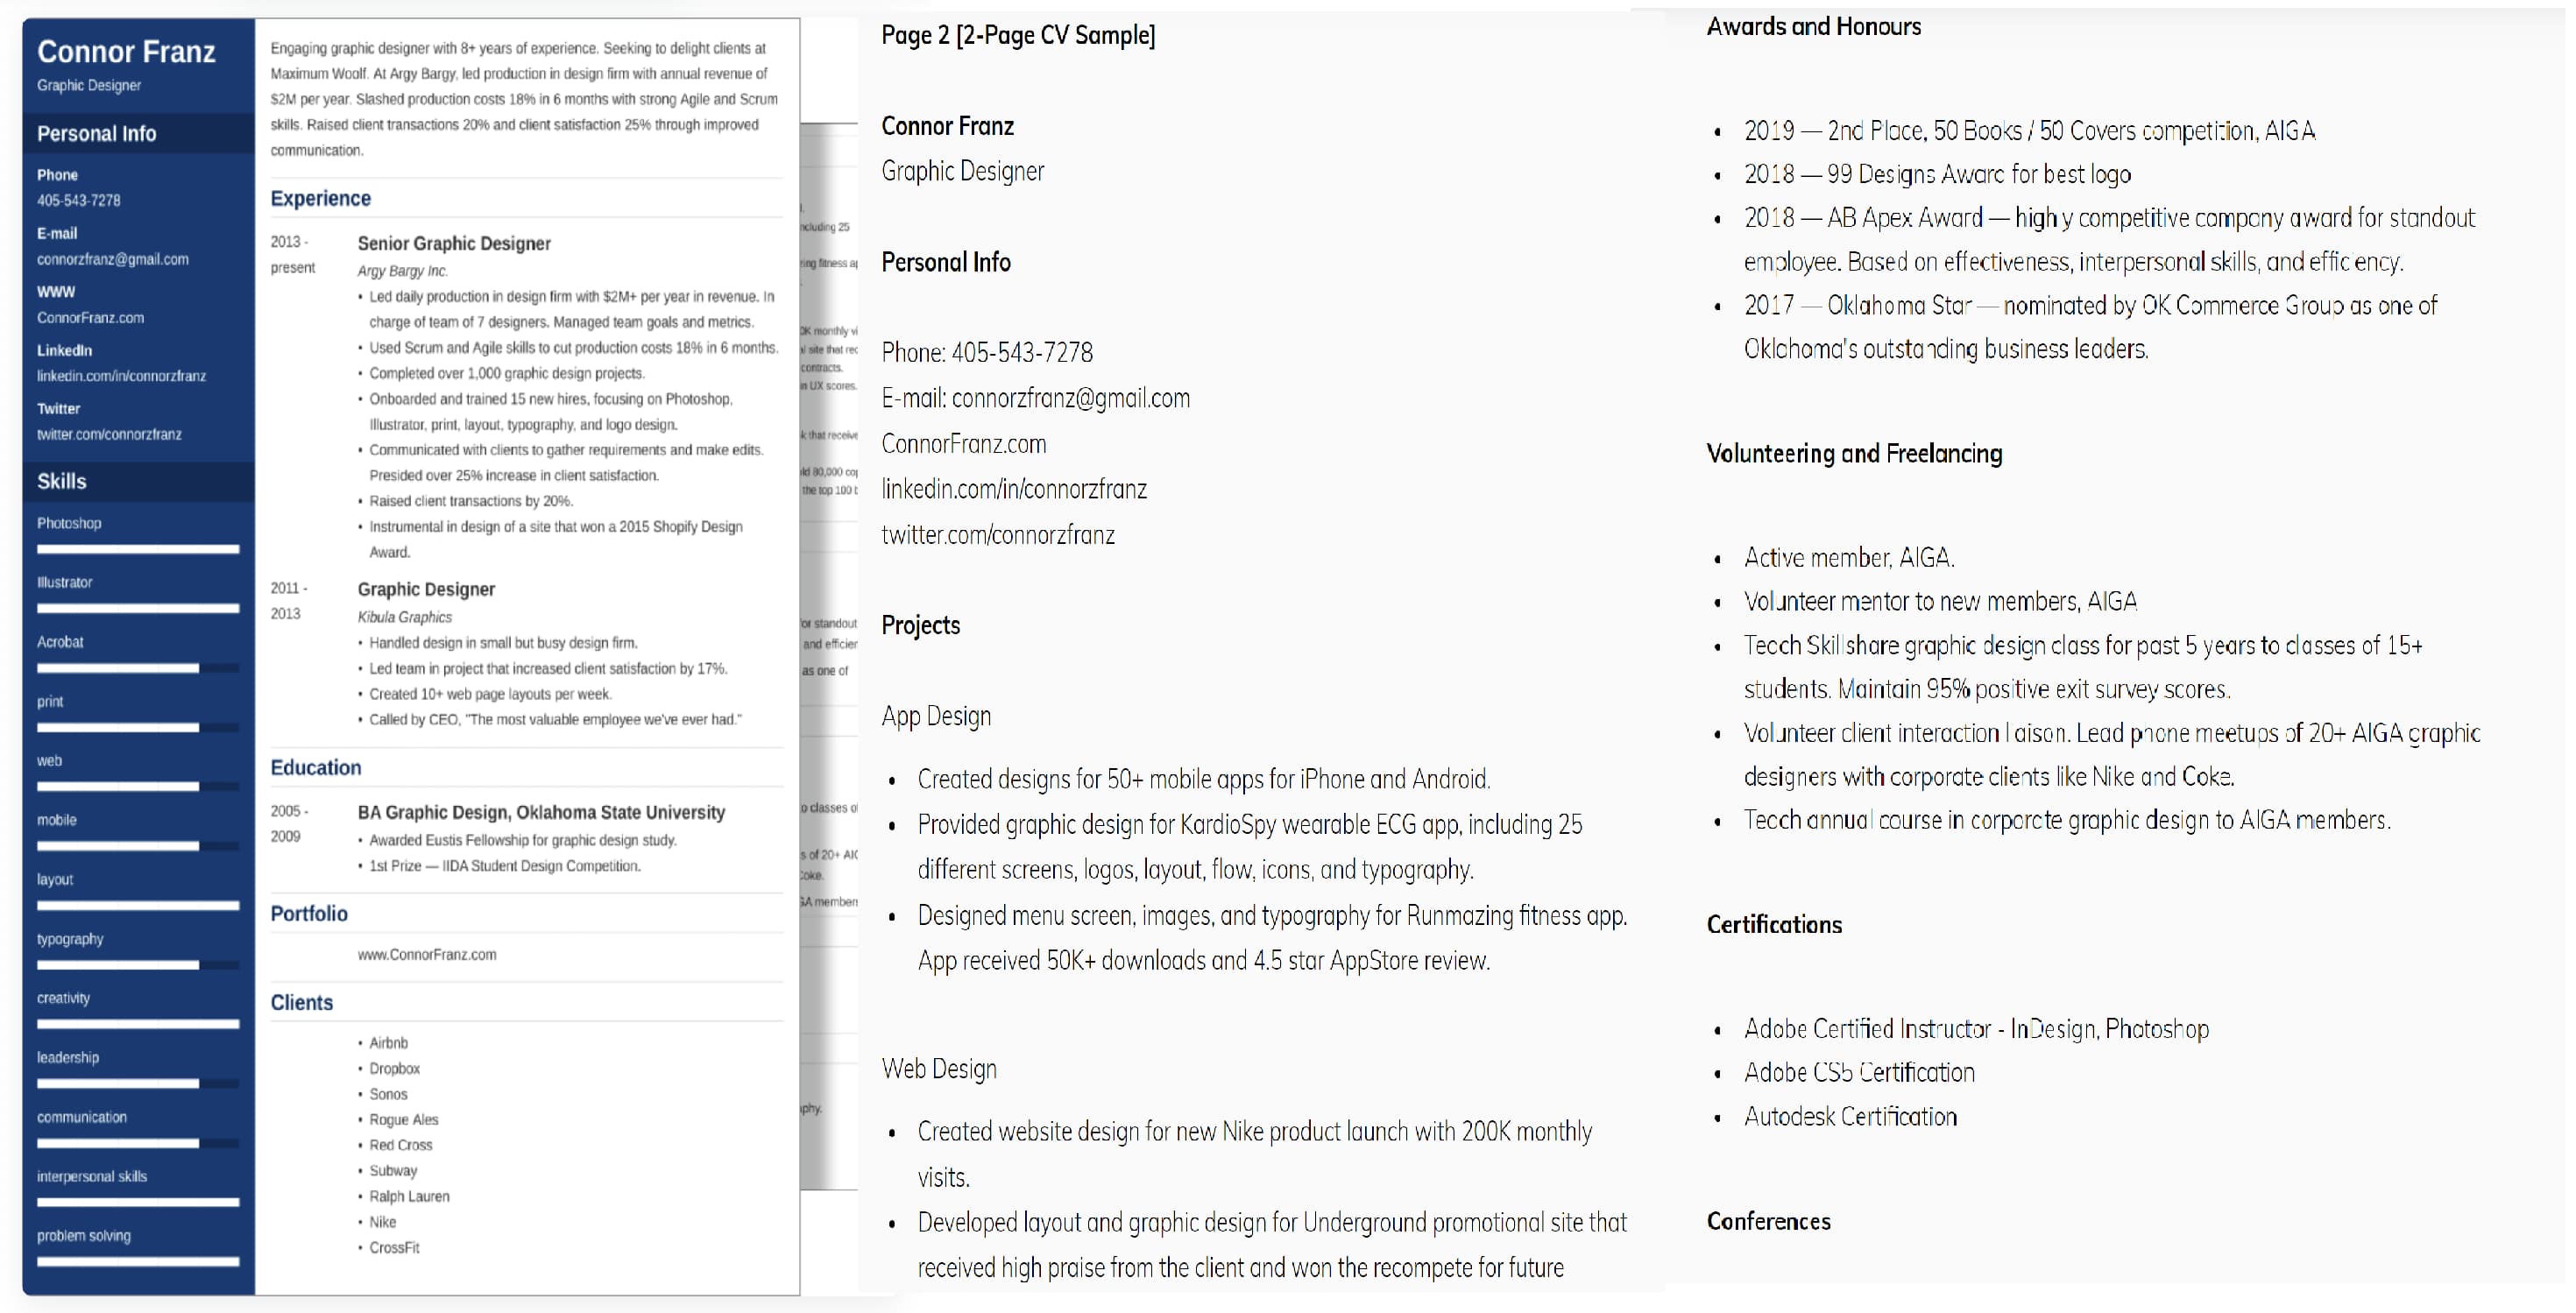
Below is an example of a graphic designer’s comprehensive CV.

The graphic designer’s CV is two pages long and features standard information expected in a typical resume. It also includes the applicant’s past clients, projects, awards, certifications, and volunteer experience.

CV Graphic DesignerImage source

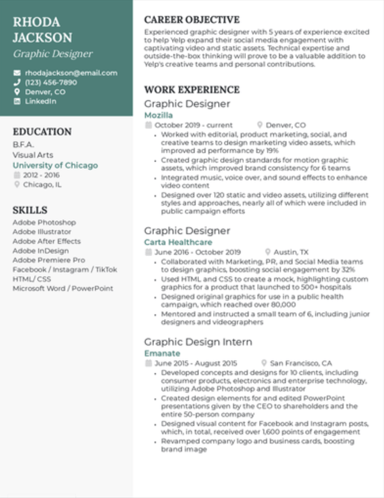
The graphic designer resume below is similar to the CV, but it’s kept to one page and only focuses on the applicant’s work experience, skills, and education.

Graphic Designer Resume

Image source

CVs don’t have to be two pages long. Like resumes, the length will vary depending on your years of work experience, industry, and what employers want to know. However, it’s common for CVs to go into deeper detail than resumes.

And regardless of length, including a cover letter with your resume or CV is strongly suggested.

A cover letter gives you the space to explain changes in your career, gaps in your work history, and a more thorough analysis of your awards and achievements.

Now that you know the differences between a resume and a CV, you can decide which to use for your next job application.

New Call-to-action

Categories B2B

Career Objective Tips To Get Your Resume Noticed [+ Examples]

Whether you call it a personal branding statement, experience overview, or resume objective, a career objective statement creates an important first impression.

→ Download Now: 12 Resume Templates [Free Download]

A well-crafted statement lets hiring managers learn about your skills and career highlights in a straightforward way. That’s if a hiring manager even makes it to your resume, of course.

With an increasingly competitive pool of candidates, we have compiled steps to help you craft a career objective that will enable your resume to stand out and get through that first read.

Let’s look at what a career objective is and how to make yours meet today’s resume standards.

Your career objective is some of the first information hiring managers will see when scanning your resume, so it needs to be unique to stand out. You can do this in several ways, including:

  • Tailoring the objective to the role you’re applying for.
  • Adding top keywords.
  • And highlighting relevant skills.

The result should be a concise summary that’s clear, actionable, and compelling. Bonus if you can hint at your personality.

But what does that look like? Here are the steps you can follow to create a great career objective for any role.

How to Write a Career Objective

1. Refer to the job description.

It’s easy to copy and paste information from a job description into your career objective. But to show originality and stand out, you have to understand what a hiring manager wants.

Do this by looking for the most in-demand skills or characteristics for the role. These are often listed within the job description under a section labeled “Required Skills” or “Core Responsibilities.”

You can find the right skills or traits to include by cross-referencing the list with any additional descriptions about the company or position. Using these words shows the recruiter that you have done your homework about the specific job, instead of mass sending out your resume.

Once you comb through the job description, create a list of the top 10 traits and skills you want to include in your statement. You may not use all of them, but it will help you draft your career objective statement.

2. Know your value.

If you’re knee-deep in the job hunt, you can probably recite your strengths in your sleep. Instead, write down the specific ways you add value to your list of skills and traits.

These can include your strengths, degrees, licenses, or certifications. It’s also worth mentioning any strong connections you have, such as working for top-tier clients or experience speaking at industry events. Just make sure the experience is relevant to the company, industry, and role.

Again, look to the job description to understand how you can highlight your value to the company.

3. Keep it concise.

A career objective should be no more than three sentences. Your resume will cover your specific work experience, core skills, education, volunteer experience, and certifications. Instead, provide a more general overview of your passions, skills, and values.

Write a draft of your career objective using the list you created in steps one and two. Your first few drafts may be more than three sentences. That’s okay.

Try to remove any excessive language, like “that,” “a,” and “the.” And don’t worry too much about using complete sentences (see this in action in the examples below).

Here’s what a career objective should and should not look like for a growth marketer role.

Career objectives, what they should and should not look like.

growth marketer with 5.5 years experience working for a mobile firm. Right: experience growth marketer with a background in sales and 5+ years experience growing conversation rates for a San Francisco mobile carrier. Seeking to leverage leadership excellence to raise KPIs for Symantec.

Image Source

If you get stuck, have a trusted friend, colleague, or mentor review the statement. They may be able to offer feedback and correct any errors.

You want your objective to be as polished as possible, so have one or more pairs of eyes review your work.

How to Write an Objective for a Career Change

You may be comfortable writing a career objective for a field you have experience in, but what if you’re changing careers?

The goal when writing this type of career objective is to tie your previous experience into your desired role as much as possible. This requires you to draw connections between your past work and your new career.

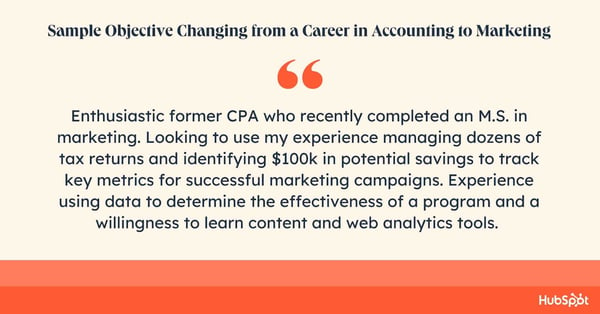
Let’s look at an example where the candidate is aiming to transition from an accounting career to one in marketing.

Career objective sample. Enthusiastic former CPA who recently completed an M.S. in marketing. Looking to use my experience managing dozens of tax returns and identifying $100k in potential savings to track key metrics for successful marketing campaigns. Experience using data to determine the effectiveness of a program and a willingness to learn content and web analytics tools.

The candidate uses the career objective to explain their career switch and draw attention to their analytical skills — a must-have in many marketing careers.

Now that you have an idea of how to compose your career objective, check out these examples below to get further inspiration.

Career Objective Examples

No matter what the role is, from software engineering to sales, there are specific phrases that will help you take your first step. These five catch-all phrases can help you get started:

  1. Seeking an entry-level position to begin my career in a high-level professional environment.
  2. To obtain a challenging and rewarding position in a dynamic organization where I can utilize my skills and experience to contribute to the growth and success of the company.
  3. To secure a challenging and responsible position in a reputable organization where I can apply my knowledge and skills to contribute to the success of the company.
  4. Organized and motivated employee able to apply time management and organizational skills in various environments.
  5. Seeking a position in a fast-paced, customer-oriented environment where I can use my strong communication and problem-solving skills to provide excellent service and support.

And as always, you should add your own flair to each of these, but hopefully, they can help you get the ball rolling.

However, each role will also have its distinct requirements, and your career objective needs to reflect those unique traits. Look to the following examples for inspiration when writing your statement.

Internship Application

Detail-oriented English major seeking to leverage excellent written and verbal communication skills to succeed as an intern at ABC company. Excels at working on teams with 3+ years of experience as captain of the lacrosse team at ABC University.

What we like: Even though they do not have explicit work experience, they highlight their leadership skills with a specific example.

Recent Graduate Application

Recent graduate with a B.A. in business administration looking to start my career in finance with an internship at ABC Inc.

Experienced in analyzing financial statements and annual reports for several university projects. Seeking to further develop my theoretical know-how with strong mentorship at ABC Inc.

Pro tip: Include what you hope to get out of the job experience as well. This makes your objective more personal.

Marketing Manager

Data-savvy lifecycle marketing manager with seven years of experience crafting omnichannel customer journeys.

Successfully built customer programs that increased loyalty by 25% using best practices for lifecycle frameworks and communication strategies. Strong analytical skills and familiarity with various ESP and CRM software.

What we like: The use of specific metrics makes the candidate’s added value clear and tangible.

Communications

Highly creative communications specialist who excels in collaborative, fast-paced environments. Over the past four years, I’ve coordinated and refined content for marketing industry leaders to ensure company narratives are compelling and accurate.

Experience managing content libraries, social media platforms, and internal newsletters.

Pro tip: Give examples of what you’ve worked on. This experience makes it clearer to the recruiter that you’ve worked diligently in your previous role.

Brand Strategist

Creative lead with a knack for developing strong client relationships and innovative branding strategies. Over 10 years of experience crafting strategic marketing plans that have led to 45% growth in clients’ brand awareness.

Excellent communicator and coordinator with the ability to foster long-term partnerships while ensuring teams stay on track.

What we like: Again, the success metrics help this applicant stand out.

HR Manager

Approachable, dedicated, and hardworking human resources coordinator with three years of experience.

Seeking a position as an HR manager with a company that values knowledge of the industry, the ability to implement improvements for employee satisfaction, exceptional work performance, and previous work experience.

What we like: All the adjectives are taken from the job description, making it clear that this career objective was written specifically with that role in mind.

Fullstack Software Engineer

A curious learner and excellent team player searching for a challenging position as a full-stack software engineer at ABC Inc.

Hoping to use my technical competencies and knowledge of modern frameworks and technologies, such as graph QL, React.js, Node.js, and Firebase.

Best for: Those with technical skills they want to highlight. Show a range of valued skills for the desired role.

Business Analyst

Recent business management graduate with highly proficient data analysis skills, seeking a position as a business analyst for ABC Software Solutions.

Motivated to apply skills in business technology, data analytics, and strategic planning and development to improve business performance, reduce costs, and increase profitability. Proficient in Python, Excel, and Looker.

Pro tip: If you have specific skills you want to ensure are seen, add them to the end of the career objective so they are clear and apparent.

Sales Manager

Seeking the position of regional sales manager at ABC Company. I can use my five years of sales experience to identify sales opportunities through sales activation, people management, relationship development, and networking to improve the bottom line and increase company revenue. Achieved 120% of quota in my previous role.

What we like: Sales is highly quantifiable, so make sure you show you’re a high performer with key metrics.

Financial Analyst

Finance student with 3.92 GPA from ABC University, seeking an entry-level financial analyst position at ABC Inc. Skilled in financial data analysis, reading financial sheets, with excellent knowledge of accounting and tax legislation.

Best for: Roles that require academic prestige. Ensure your accomplishments are highlighted from the get-go.

Web Designer

More than 10 years of experience in creating designs of any complexity, 2D and 3D graphics for games, applications, and websites.

Awareness of current graphic and design trends in the area of user interface, game development, and web design. Attention to detail and ability to drive concept development beyond initial implementation.

What we like: The specificity of the experience and tools needed for the desired role makes this a compelling career objective.

Sales Engineer

Highly motivated and experienced sales engineer with 5+ years of experience developing innovative products and providing excellent customer service.

Seeking to leverage knowledge of engineering principles and project management techniques to exceed expectations as a sales engineer at ABC Company.

What we like: Showing passion for the job and your success in the desired role allows the hiring manager to glimpse your personality.

Banking

An enthusiastic individual seeking a mid-level position in a banking firm where I can use my negotiation and communication skills to achieve sales targets. An MBA in finance from ABC University.

Best for: A role that requires a certain education level — be sure to highlight it in a sentence of its own.

Legal

Focused, confident, and committed associate lawyer. Interested in working with a major law firm committed to helping the aggrieved party (both individual and companies) by optimizing knowledge and rules of the Indian legal system.

Pro tip: Highlight why that exact firm is a fit for you and you are a fit for them, being as specific as possible.

Supply Chain Analyst

Deadline-driven warehouse manager with five years of experience. Proven track record in maintaining ideal inventory levels and managing capital and expense budgets at different distribution warehouses. Looking for a similar job role in a reputed logistics company.

Pro tip: If you have years of experience in your field, highlight this information in your objective.

Account Manager

Diligent graduate with a B.A. in business management from University ABC seeking to provide excellent client services at ABC Inc. as an account manager.

Strong communication skills from my job as a sales manager at Company ABC. Outstanding project management skills, having worked on over a dozen business projects in university.

What we like: Giving a quantifiable number of projects makes it more impactful.

Executive Assistant

Experienced personal assistant aiming to elevate my career to the position of executive assistant. Supported four entrepreneurs with organizing their work by setting up meetings, booking flights and hotels, and writing reports.

Hoping to leverage organizational skills to help ABC Corp introduce time-saving schemes for all executives.

What we like: The applicant is concrete and straightforward, matching the desired skills for the role.

Crafting the Perfect Career Objective

Now, you’re ready to write a career objective that showcases your skills.

If you follow the steps above, keep it original, and reference the job description, your objective statement is likely to wow hiring managers — and help you move on to the next stage in the hiring process.

New Call-to-Action

Categories B2B

7 Gantt Chart Examples You’ll Want to Copy [+ 5 Steps to Make One]

Gantt charts. Love ‘em, hate ‘em, or can’t live without ‘em, they’re a reality of a marketer’s life. But how do you make yours stand out from the rest?

→ Download Now: Free Gantt Chart Template

Below you’ll see some of the best examples around, along with some free templates to get you started. Dive in below and find your favorite.

Table of Contents

The elements within a Gantt chart can be grouped into four categories: resources, milestones, tasks, and dependencies.

  • Resources. Project managers must have insight into what resources are needed for tasks outlined in a Gantt chart for each to be completed on time.
  • Milestones. Along your timeline, there will likely be milestones, both small and large, that must be hit to keep your project on track. A milestone for a blog launch might be “blog post draft due on 5/30.
  • Tasks. There are specific things that need to be completed along the way of your project. In our blog post example, a task might be “edit blog post.
  • Dependencies. Tasks on your Gantt chart will be related to each other, for example, the editor won’t be able to complete her task of editing the blog post until the writer has met their milestone and submitted their draft on 5/30. These are dependencies and should be noted in your chart.

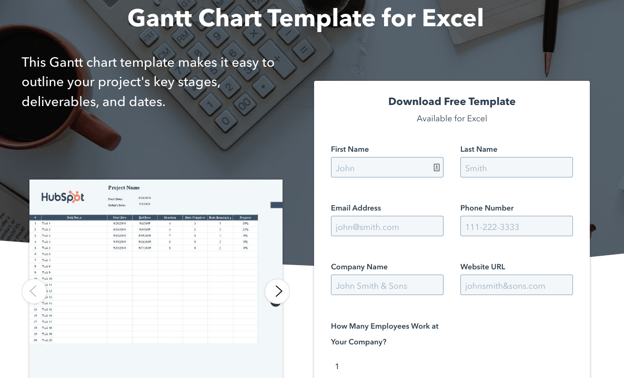
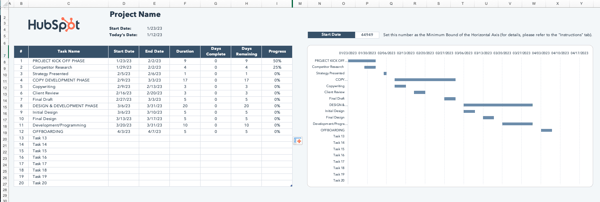
gantt chart example for excel from hubspot

Image Source

Getting started with your first Gantt chart is one of the best ways to create a visual roadmap for your project.

Here’s how to use our template for Excel to create a chart that helps you stay on deadline.

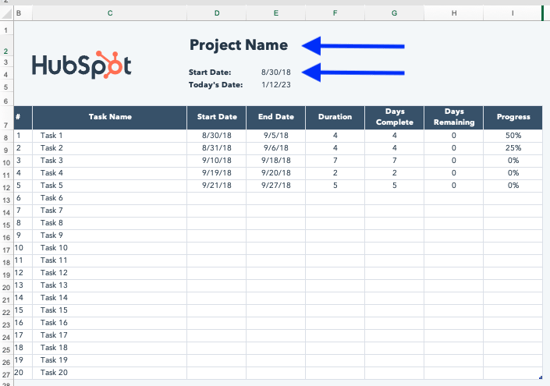
Step 1: Update the project name and start date.

After downloading the template, take a few minutes to configure it. We’ve included instructions in one of the tabs, and are walking you through it here.

how to make a gantt chart: step 1 - update project name and start date

Replace the “Project Name” placeholder with your project information. Today’s date automatically populates, however, you’ll need to choose a start date.

Step 2: Configure the Gantt chart with your start date.

how to make a gantt chart: step 2.1 - configure the gantt chart with your start date

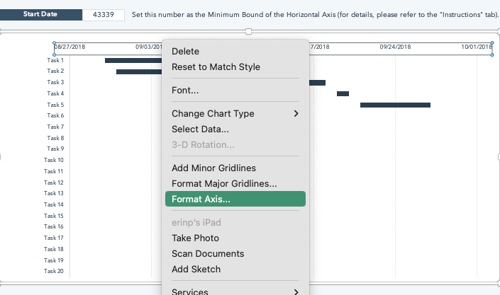
The start date you choose populates at the top of the Gantt chart as a 5-digit number.

Depending on your screen size, you may need to make note of this number (or you may still be able to see it in the next step).

how to make a gantt chart: step 2.2 - configure the gantt chart with your start date

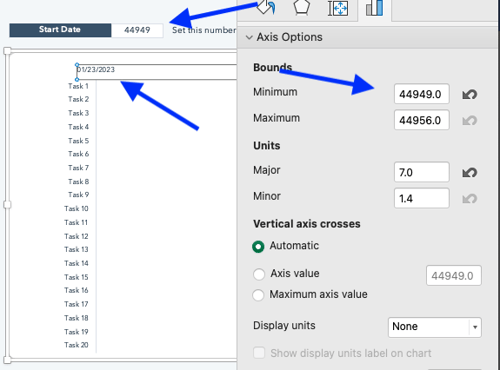
You’ll see that the dates in the Gantt chart example don’t yet reflect your project dates. To change that, right-click one of the dates in the top bar of the Gantt chart and choose “Format Axis” from the dropdown menu.

 how to make a gantt chart: step 2.3 - configure the gantt chart with your start date

Change the Minimum Bound to your start date. You’ll see that the Gantt chart now reflects your project start date.

Step 3: Review project scope.

When it comes to creating a Gantt chart, the most important aspect is understanding how your project flows. By inputting good data, your chart will be accurate and effective.

Review the proposal and any phases you’ve identified. If you haven’t defined what happens in each phase, take a few moments to do so. You may or may not need to track all of them.

However, it helps you identify which are most important to the stakeholders using the Gantt chart.

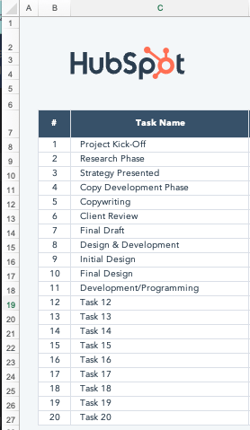
Step 4: Select key tasks and milestones.

 how to make a gantt chart: step 4 — identify key tasks and milestones

After identifying all project tasks, identify key tasks and milestones, and plug them into the Task list.

Step 5: Estimate dates for each task.

how to make a gantt chart: step 5 - estimate dates for each task

Enter approximate start and end dates next to each task. As you go, you’ll notice that your chart begins to populate.

If you want to track entire phases as well as individual tasks, enter them in. The above Gantt chart example uses all caps to track phases and title case for individual tasks. You can also see how phases overlap individual tasks.

Note: If you have more than 20 tasks, you can add rows by right-clicking any # between 2 and 20 and selecting “Insert Row” from the dropdown. However, it’s important to add them above #20 (Row 27) to keep formulas operational.

The columns automatically track allotted dates, and you can track actual time spent so you can better estimate future projects.

Now you know how to create a Gantt chart using our free template for Excel, it’s time to dive in and start tracking your projects.

Benefits of Using a Gantt Chart

The main goal of a Gantt chart is to track the timeline and completion of a project. It’s beneficial for project managers (PMs) who need to keep team momentum on campaigns with many moving parts, like product launches or marketing events.

Here are some additional benefits of using Gantt charts:

  • Visual tracking gives an overarching view of projects and their timelines, helping the directly responsible individuals (DRIs) understand progress and assign responsibility accordingly.
  • Clear project timelines aid with resource planning, as you’ll know which tasks require which tools and exactly when DRIs will need those tools. /span>
  • Visual understanding of which project elements rely on each other for completion so PMs can inform responsible individuals of high-priority tasks.
  • Increased transparency, as all involved parties are aware of expectations and how individual progress impacts team progress.

You can create Gantt charts in Excel, PowerPoint, Google Sheets, and more, and this tracking method can be used in a variety of industries, from marketing to construction, and even design.

So, what does that look like? Let’s dive in with some beautiful Gantt chart examples, below. Prepare to geek out.

Ways to Make Gantt Charts

1. Gantt Chart in Excel

Creating Gantt charts in Excel is a common practice and one you’ll likely come across in your work. Excel doesn’t have a predefined Gantt chart, but the “Stacked Bar” feature is your friend, allowing you to show project progression.

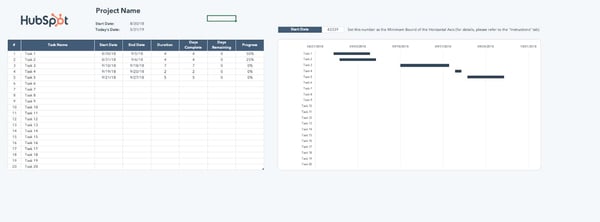
Here’s an example of an Excel Gantt chart. gantt chart example: excel

Download it free, here.

And here’s a helpful “how-to” video for the Excel-challenged among us.

2. Gantt Chart in PowerPoint

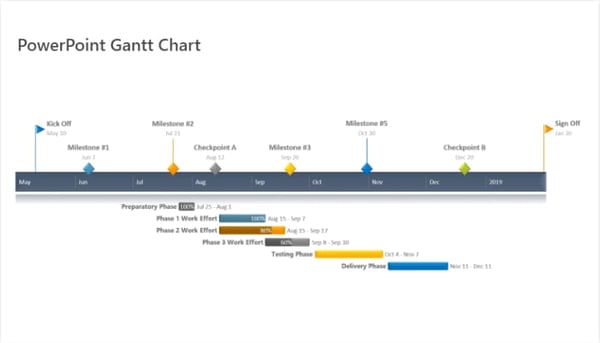
Want to include a Gantt chart in your next PowerPoint presentation? Use this PowerPoint example as your guide.

PowerPoint doesn’t have a built-in Gantt feature, but you can build and edit a chart inside of the platform using their “Stacked Bar” feature.

gantt chart example: PowerPoint

Image Source

How to Make a Gantt Chart in PowerPoint

When using the above template to make a Gantt chart in PowerPoint, consider these pro tips:

  • Leverage the task bars to your advantage and adjust their length in accordance with your plan. This template is also flexible, so you can shorten or increase the length of tasks if things come up during your project execution process.
  • Make unique color codes for each specific task so you can place a corresponding milestone image when completed so you can monitor your progress and immediately understand what each color means.

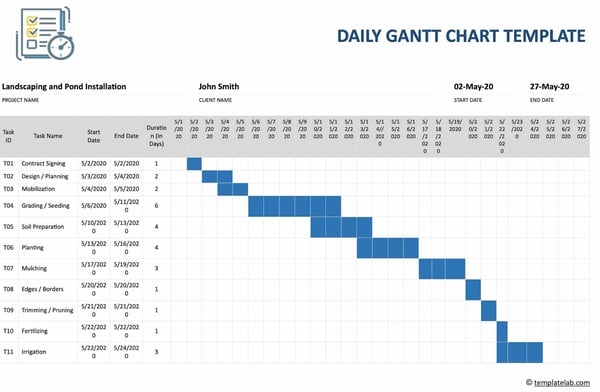
3. Gantt Chart in Word

What’s that? You’re not familiar with Microsoft’s “Stacked Bar” feature yet? Well, if you’re getting friendly with Gantt charts, you’ll be using this go-to feature quite a bit.

If you’re creating a Gantt chart in Microsoft Word, you’ll stack bars once more. But if you’ll be updating and tweaking your Gantt chart regularly, Excel or PowerPoint may give you better flexibility.

gantt chart example: Word

Image Source

How to Make a Gantt Chart in Word

When using the template above, leverage the stackable bars feature to create an interactive Gantt chart to clearly demonstrate task progress and monitor your accomplishments.

In addition, create a daily check-ins schedule on your chart so you can move the “Today” line forward as each day goes on, helping you stay on track and understand what’s to come.

4. Gantt Chart in Google Sheets

If Google Sheets is where you spend most of your time, this is the Gantt chart for you. G-Sheets makes it easy to build customizable Gantt charts you can edit as needed — all using a few simple formulas.

gantt chart example: Google sheets

Image Source

How to Make a Gantt Chart in Google Sheets

If you’re creating a Gantt chart in Google Sheets, use the above template and circulation table for automated chart creation. Simply input the information specific to your business, and the chart will be created automatically.

You have less creative freedom with this chart, but it’s great for those hesitant to create a chart from scratch.

5. Gantt Chart in Google Docs

Want a Gantt chart you can share and collaborate on with colleagues? Consider creating your chart in a Google Document. Save it to your Google Drive and share as normal.

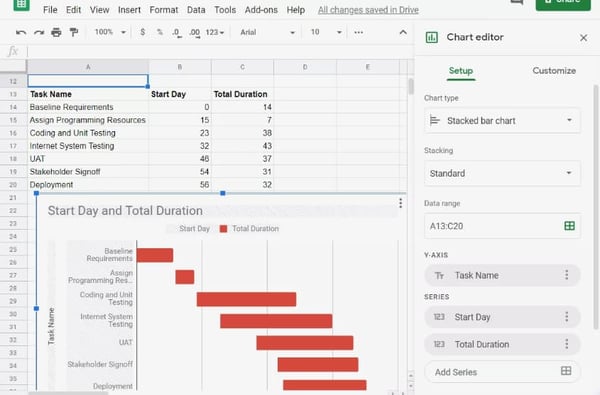
Google offers “Stacked Chart” options in their “Chart Editor,” so getting started is a breeze.

 gantt chart example: Google Docs

Image Source

How to Make a Gantt Chart in Google Docs

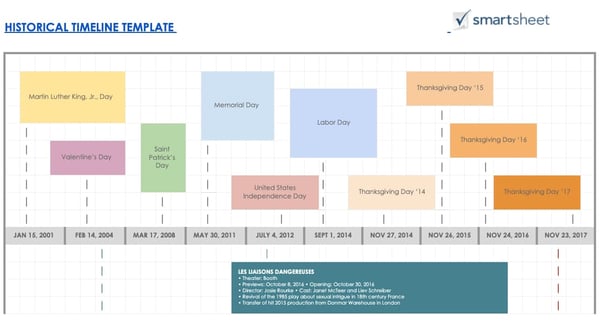
In Google Docs, use the timeline template documents to your advantage and give yourself an overview of your project progress.

It’ll help with visualization, staying on track, and allowing you to see how you’re progressing over time. You can then share information with relevant stakeholders.

Examples of Gantt Charts

1. Gantt Chart for Editorial Calendar

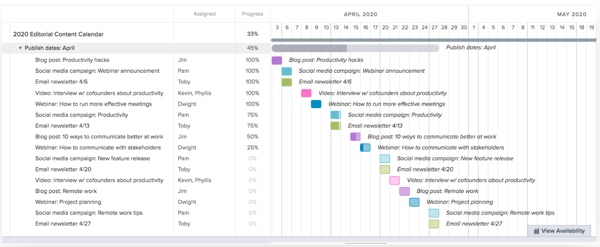
Take your editorial calendar up a notch with a Gantt chart. Include publication dates as your milestones, add subgroups for each phase of content creation, and add tasks to your chart.

gantt chart example: editorial calendar example

Image Source

What we like: The color coding on this chart allows you to easily identify the distinct tasks at a glance. The colored squares also reflect the percentage of the project that has been completed, going from a light shade to a darker one as your team makes progress.

2. Gantt Chart for Project Management

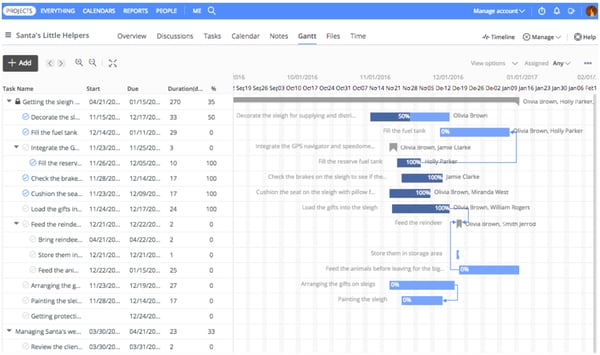
Project management is one of the most common verticals relying on Gantt charts.

These charts help project managers identify the tasks involved in each project, create a timeline for each task, and assign dates, tools, and progress updates for each of the tasks within the project.

gantt chart example: project management example

Image Source

What we like: This chart uses bars whose lengths correspond to the dates assigned to each task. You can visualize the length of time for each task and how they relate to each other chronologically and whether there’s any overlap.

3. Gantt Chart for Marketing Campaign

There are many tools available that help marketers create Gantt charts, especially for marketing campaigns. This example from GanttPro offers ready-made campaign templates with predefined tasks, subtasks, and milestones.

gantt chart example: marketing campaign

Image Source

What we like: This template allows you to clearly group subtasks together to coordinate all the components of your campaign with one Gantt chart.

4. Gantt Chart for Design Projects

Designers, you can use Gantt charts, too. Plan design launches, track brainstorming, and share draft progress with a carefully organized chart, like the example below. gantt chart example: design projects

Image Source

What we like: This chart allows you to break down each step of your design project and to visualize how long the total project will take. It’s easy to take some of the steps for granted, but it’s important to name and designate a timeframe for each one.

5. Gantt Chart for Product Launch

Product launches have many moving parts. Keep track of research, budgets, team roles, and even risk assessment in a customizable Gantt chart like this one. You can even set dependencies and assign tasks to certain people.

gantt chart example: product launch

Image Source

What we like: This chart displays both the total timeframe for the project, the overlap of tasks, and which tasks depend on which, giving you a visual for the big picture while keeping track of your progress.

6. Gantt Chart for Social Media Campaign

When you’re mapping a social media marketing campaign using a Gantt chart, make sure to include the tools you’ll need, the content you’ll be sharing, and the assets used on each channel. We love this example from Fabrik. gantt chart example: social media campaign.

Image Source

What we like: This chart includes all the major categories necessary for a social media campaign — web assets, content, and tools/technology — along with the specific tasks belonging to each category.

This gives you a comprehensive view of the campaign and its progress.

7. Gantt Chart for Event Marketing

From outreach before the event to “thank you” emails once it’s over, planning an event requires high levels of organization.

Use a Gantt chart like this one to keep track of your strategy, team progress, and key actions before, during, and after your event.

gantt chart example: event marketing

Image Source

What we like: The color coding helps make the complexities of event planning and marketing more manageable. While this example doesn’t provide many details, it gives you a good idea of how a Gantt chart can help you organize your event.

Getting Started With Gantt Charts

Gantt charts can help keep your projects organized, so you never miss a beat.

When you’re ready to begin creating your own Gantt chart, refer to the examples on this list and download our free Excel template to get started.

New Call-to-action

Categories B2B

What Is Marketing Attribution & How Do You Report on It?

Marketers engage with customers on more channels than ever before. Whether you’re working with influencers or posting short-form videos, it makes marketing attribution essential for continued results.

This is because the buyer’s journey is far from linear. Consumers engage with brands through multiple touchpoints before they make a purchase.

→ Free Download: Free Marketing Reporting Templates [Access Now]

For a lot of marketers, getting visibility into the most effective touchpoints can be tough. They have to wade through cobbled data from different sources, spend hours crunching numbers in spreadsheets, or wait for a marketing ops resource to help them. Unless they’re using marketing attribution reporting.

But what is marketing attribution? And how can you use it to improve your marketing strategy? Keep reading, or jump to the section you’re looking for:

For example, if marketers want to see how a blog post or social media strategy impacted sales, they might use marketing attribution techniques.

Here’s how our product team at HubSpot describes it:

“Attribution surfaces which interactions a person or group of people took along their journey toward a desired outcome or ‘conversion’ point.”

Lead Attribution

Lead attribution is a type of marketing attribution. It shows how marketers impact the number of leads that come from a given channel, touchpoint, or campaign.

Lead attribution data helps teams understand which marketing efforts are most effective for generating qualified leads.

Leads aren’t sales, but they are important because they show how marketing content or strategies are gaining prospects or new audiences. In turn, these prospects can lead to increased sales or revenue.

B2B Marketing Attribution

B2B Marketing attribution is a type of marketing attribution for the business-to-business field.

B2B companies sell products or services to other businesses or professionals in their industry. While B2C attribution could relate to smaller purchases, B2B attribution covers purchases from companies, memberships, or leads.

B2B marketing attribution data helps B2B companies connect marketing efforts to ROI and CLV. It’s also essential for data-driven decision-making.

Why is marketing attribution important?

This approach to analysis helps marketers understand the most valuable marketing channels. It helps you connect marketing tactics to ROI and CLV. Marketing attribution is also useful for making a business case for new initiatives and changes in strategy.

The purpose of attribution reporting is to help you understand how marketing efforts inspire users to convert and build relationships with your brand. Marketing attribution helps you see patterns and actions that your team can use to improve strategies in the future.

Types of Attribution Models

Now that you know what marketing attribution is and why it’s important, you may be wondering how it works. After all, not all marketing channels have the same impact on conversions.

Pulling together all the interactions of your buyer journey into a report is only half the magic. The other half is using various types of attribution models.

Attribution models let you apply a different amount of credit to each interaction according to the model’s rules.

For example, say you’re measuring the effectiveness of lead generation for a high-traffic blog post. That blog post draws a lot of first-time visitors, so a first interaction attribution model would probably give that post credit for generating leads.

But what if that post also has a landing page link that most users click before signing up? In this case, a last interaction attribution model might give credit to the landing page, not the blog post.

These are some of the most common attribution models:

First-Touch Attribution

This model gives all credit to the first click or interaction a visitor makes in the buyer journey.
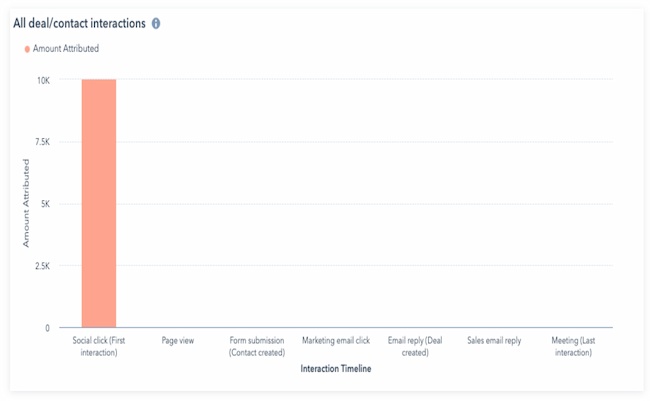
Marketing attribution types: First-Touch Attribution

For example, say the first place a buyer lands before making a purchase is an ad on Facebook. That first click will get the credit for that sale in a first-touch marketing attribution report.

Last-Touch Attribution

This model gives all credit to the last click or interaction a visitor makes in the buyer journey.
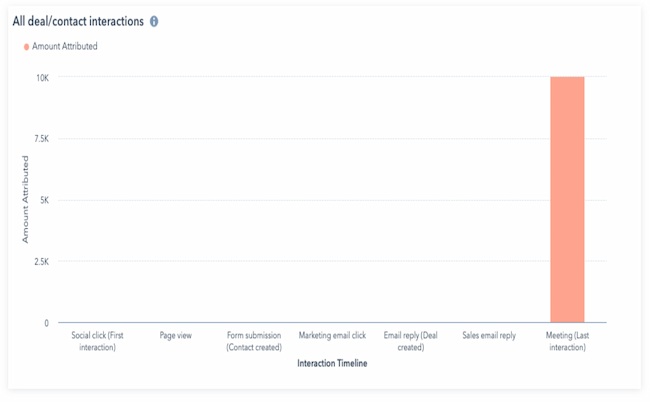
Marketing attribution types: Last-Touch Attribution

Using the example above, say the last place a buyer clicks before making a purchase is a product landing page on your website. That last click will get the credit for that sale.

If you are thinking about using last-page attribution, think carefully about the user experience in your funnel.

For example, say you are generating leads with a free content offer, and your leads download that offer from a thank you page. If you’re using last-click attribution reporting, your report could give 100% of the credit for generating that lead to the thank you page.

That information won’t be especially helpful if you’re trying to understand lead attribution for content offers.

Multi-Touch Attribution Explained

Multi-touch attribution can help you understand how all your marketing touchpoints work together. It measures and assigns value to all the interactions a contact had up to a key moment in their journey.

These reports are valuable because they allow you to pinpoint the exact marketing and sales effort that led to a conversion in your flywheel. This information can help you make better decisions about where to invest your time and resources.

For example, say you want to see how a blog post or social media strategy impacted sales. You can use this reporting strategy to assign real financial value to these efforts.

HubSpot customers: HubSpot supports three types of multi-touch attribution reports:

  • Contact create attribution reports help you see which marketing activities produce the most new contacts
  • Deal create attribution reports help you understand which marketing efforts bring in the most new deals
  • Revenue attribution reports show which marketing efforts result in the most revenue

There are two common models for multi-touch attribution:

U-Shaped Multi-Touch Attribution

This model gives the first and last touchpoints in the buyer’s journey most of the credit for a conversion. But it also gives some credit to actions that happen between the first and last touchpoints.
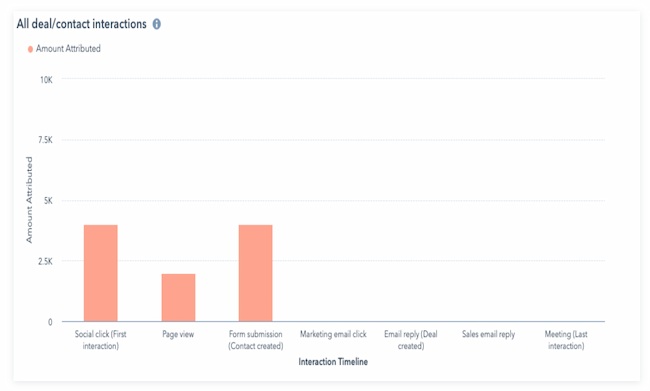
Marketing attribution types: U-Shaped Multi-Touch Attribution

W-Shaped Multi-Touch Attribution

This model gives equal credit to the first interaction and last interaction, as well as a mid-funnel touchpoint. It splits the rest of the credit evenly to touchpoints that happen between these three interactions.
Marketing attribution types: W-Shaped Multi-Touch Attribution

Other multi-touch attribution models include full path, J-shaped, inverse J-shape, and more.

Multi-Channel Attribution

Multi-channel attribution is similar to multi-touch attribution. But while multi-touch attribution can describe any type of engagement, multi-channel compares marketing channels.

For example, a multi-touch attribution report could track form submissions, clicks, or page views on a single channel. But a multi-channel report will compare the value of channels like social media, organic search, and email.

Linear Attribution

This model gives equal credit to each interaction in the buyer journey. It’s helpful for getting a comprehensive view of marketing performance.
Marketing attribution types: Linear Attribution

Time Decay Attribution

This model gives more credit to the most recent interactions. The credit for interactions decays the longer it takes for a prospect to convert.
Marketing attribution types: Time Decay

In the example above, a meeting was the last contact over seven different touchpoints. In this model, it gets the most credit for the conversion. A social click was the first interaction, and it gets the lowest amount of credit.

Which attribution report is right for my team?

The best way to begin marketing attribution reporting is to think about what goal you are trying to measure. Are you trying to:

  • Understand how your marketing and sales effort generated leads?
  • Understand how much revenue your marketing efforts brought in?
  • Solve a problem in your marketing funnel?
  • Rethink your marketing or conversion strategy?

Marketing attribution makes it easier to understand which marketing strategies help grow the business.

Keep in mind, attribution reporting also helps stakeholders in your organization see how marketing efforts impact business goals. Marketing analytics and tactics can be complex, and this strategy can simplify this information. You can use this report to show the importance of under-valued channels, focus investment on important strategies, or change strategy.

Keep reading to learn how to create and use attribution reports to track the success of your marketing efforts.

1. Decide what time period to analyze.

Some businesses do weekly or monthly attribution reporting. Others use marketing attribution as a strategic tool — analyzing this data before making updates.

As you choose the right time period for your business, think about seasonality and how the dates you choose can impact your data.

For example, if your business runs on an annual sales cycle, you may want to look at multiple years of data. But if your sales cycle happens over a few months, too much data could skew your results.

But what if you’re not sure what your average sales cycle timeline is? In that case, a visual analytics dashboard can help you notice patterns that can help focus your research.

2. Review customer habits and the buyer journey.

When you first start looking at marketing attribution, you’ll see it can help you figure out your top marketing channels.

Let’s go over a few questions that you might want to answer with attribution reports.

How many leads does my blog generate? And what other content generates the most leads?

Content lives at the heart of inbound marketing. Every marketer wants to know how their content contributes to the number of leads they are generating — especially on their blog.

Attribution reports pull that information together to show the number of views a blog post gets before conversion. For bloggers who have not been able to attribute lead generation directly to their blog content, this is a huge win.

The information gathered in these reports helps marketers dissect which types of content perform better. That could include popular topics, content formats, or even time of promotion. With a better understanding of which content generates more leads, marketers can make more informed decisions about their marketing.

What marketing channels generate the most leads? Where is the best place to invest my marketing resources?

After you find out which type of content generates the most leads, it’s important to understand which channels are the most successful in lead generation. This will give you deeper insight into why your content performs the way it does.

For example, your email marketing could be the best place to get content to your customers, but your social media could be tanking. Or vice versa.

Understanding the health of these marketing channels is key to deciding where your team should invest their marketing resources.

For example, say you’re doubling down on social media without getting many leads in return. At the same time, say you’re generating a ton of leads from email marketing with little effort. With this in mind, you may want to take a second look at your approach.

Which pages get the most views before a conversion?

There is a range of content that can contribute to conversions. Blog posts, landing pages, and content offers are often top lead generators. But your homepage, pricing page, About Us page, and other informational pages may be helping too.

Running an attribution report for viewed pages on your website can help you figure out which pages get the most visits. This will help you understand which pages to promote, which pages to optimize, and which pages help push prospects through the funnel quickly.

Advanced marketers also use these reports for problem-solving. You can use attribution reports to:

  • Find points in the buyer journey where customers are churning
  • Remove content that isn’t making an impact
  • Identify blockers or gaps in the customer experience
  • Save time and resources for your team and your prospects
  • Notice trends and changes in audience behavior

If you don’t have a customer journey map to work from, this template can help streamline the process.

Featured Resource: Customer Journey Map Template
customer-journey-map-Mar-16-2023-12-12-08-2781-AM

3. Find the right tools for data collection.

Before you can begin marketing attribution reporting, you need to collect the right data. It’s likely that your business uses many different tools to track customer behavior, both before and after they make a purchase.

Your business may track your buyer journey with surveys, interviews, and focus groups. But quantitative data is most useful for attribution reporting. This guide to data tracking tools can help you find the right data collection tools.

As you research tools, think about top business goals and the question you want your attribution reports to answer. For example, Google Analytics has over 100 reports for website analytics. But what if you want your attribution model to include user interactions after they sign up? GA is a great data tracking tool, but you may need something else to answer your most urgent attribution questions.

Some tools also include data-driven or algorithm-based attribution in their data collection. This can be useful for businesses with long or complex customer journeys.

If you’re not sure which tool is right for you, check out this list of top marketing attribution software.

4. Choose the best marketing attribution model.

One of the most common questions marketers ask when getting started on attribution reporting is which model they should use.

The answer depends on the goals of your team and the supporting analysis that’s expected of you. The important thing to remember is that there isn’t a one-size-fits-all for attribution reporting. Instead, it’s best to use multiple models.

Some tools include algorithmic models that track the full user journey. But many marketers prefer to track their data through multiple models and see which model best answers their questions.

For example, say your goal is to widen the funnel and increase brand awareness. In this case, first-touch attribution will quickly help you see which channels and touchpoints draw the most traffic.

But what if customer retention is an issue that you want to address in your marketing strategy? In this situation, a multi-touch attribution model may be more effective.

5. Analyze the attribution data.

Once you choose a model, analyze the data to see if the inputs and attribution model are helping you answer your top questions.

For example, take a look at the Dimensions dropdown in HubSpot’s revenue attribution report. This feature lets you choose what lens you want to view your attribution report through. This helps you understand which types of interactions, content, interaction sources, and other dimensions are having the most impact on your goal.
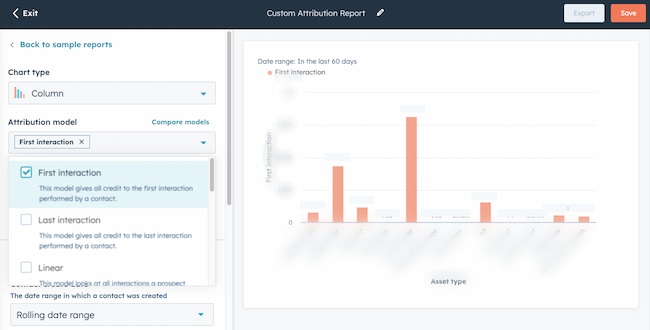
Marketing attribution data example, HubSpot

HubSpot’s reporting also makes it simple to toggle between different attribution models.

Adding and removing different models in real time makes it easier to analyze the buyer journey. This can help you understand the value of each of these interactions and create the right attribution reports for your goals.

Learn more:

6. Make your marketing attribution analysis easy to review.

Attribution can be daunting for even the most tenured marketers. Once you’ve created your report, you’ll want to make your data easy for stakeholders to quickly understand.

The best marketing attribution software includes graphics to visualize your attribution data. If you want to create something more specific, these resources can help you make your data presentation clear and useful:

7. Act on new insights.

Once you have a clear picture of any disconnect between business goals and your attribution reporting results, take a look at your strategy.

You may want to do some market research or get training to fill any gaps in your knowledge. Then, make some clear recommendations, run marketing experiments, and put your new strategies into place.

GDPR Considerations With Marketing Attribution

The General Data Privacy Regulation (GDPR) means that you need explicit consent from your customers to use their personal data.

If you don’t have consent, then you won’t be able to use personal data as part of your digital marketing strategy. Personal, demographic, and financial details are just some of the information this can include.

These details help marketers create more personalized experiences. At the same time, more consumers want to know how companies are using their data.

According to 2022 Cisco research, 90% of those surveyed won’t buy from a company that doesn’t properly protect its data. At the same time, 62% of surveyed consumers say they won’t stay loyal to a brand that doesn’t deliver a personalized experience.

This GDPR checklist can help you understand your businesses’ readiness to address customer privacy concerns.

Guidelines like these can help your business continue to adapt to ever-changing data collection and storage guidelines. This can help you get the data you need to ensure accurate attribution AND keep meeting customer expectations.

1. Choose KPIs for attribution tracking early.

Collecting marketing interaction data is the first step to creating trustworthy attribution reports. So, before you begin attribution reporting, be sure to:

This step may sound obvious, but if you’ve ever tried to pull together a report only to find that you’re missing essential data, you’re not alone. Tracking data is a complicated process, and it’s easy to skip a crucial data point during setup.

If you’re using HubSpot for reporting, this isn’t an issue, because HubSpot analytics updates every 20 minutes. So, if you find that you’re missing a touchpoint, you’ll still be able to quickly use that data in your attribution reporting.

But some touchpoints on other tools, like Google Analytics, don’t begin pulling data until you create an event. That can cause problems down the line for your reporting, so choose and set up your KPIs early.

2. Move to backend tracking.

Another way to collect accurate data is backend tracking. This alternative to client-side tracking is typically done with Javascript.

You can track almost the same amount of data, and it’s more reliable and less susceptible to ad blockers. Backend tracking is also a great long-term solution to dealing with the phasing out of cookies.

To track data from the backend, consider a third-party service. For example, Google Analytics supports backend tracking through what they call the Measurement Protocol. You can use this API to track page views, events, ecommerce data, and more.

This setup takes more work than simply slapping the Javascript snippet on your website. But it’s also a way to future-proof your site for privacy changes.

3. Connect marketing and sales channels.

Align sales and marketing channels for more useful attribution insights. First, this strategy connects marketing and sales outreach into a single customer journey. Next, it helps your team pinpoint disconnects in personas, KPIs, and customer data.

This can not only help your team understand which marketing initiatives drive the most traffic, but it can also improve lead quality and ROI. These smarketing tips can help you connect these channels.

HubSpot customers: These tools can help you connect your sales and marketing channels.

4. Use automation whenever possible.

Marketing automation uses software to complete repetitive marketing tasks like email workflows or scheduled social media posts. This automation can increase the volume of outreach without expanding your team. It can also help you create more targeted personalized campaigns.

This increased volume can increase the data your team has on hand to inform your attribution models and your strategy.

5. Link every marketing action to business goals.

Use business goals like revenue to inform your marketing strategy. This will make your marketing attribution results more useful to your business and help you get support for new initiatives.

When marketing tactics tie to business goals, it creates metrics that are more meaningful to other parts of the business. Then, with attribution, you can track which of your marketing efforts is most effective for reaching the desired results.

Marketing attribution often uncovers fascinating data. But it’s important that this reporting is more than interesting. Instead, it should offer evidence to support process changes or other strategies that support business goals.

6. Talk to stakeholders about marketing attribution.

Attribution is an effective resource for communicating with other departments. This is because these reports make it quick and easy to see how marketing directly impacts conversions.

To make the most of these conversations, here are a few ways to manage expectations.

First, identify the right stakeholders to share marketing attribution results. Then, figure out what kind of data is most useful to their needs and goals.

You may need to manage their expectations of data accuracy. For example, many analytics tools offer sampled numbers, so they’re not usually exact.

But this data can still help your team make the right decisions. Attribution reporting can improve your campaigns and respond to your customers’ needs.

For example, say you notice most of your blog traffic enjoys content about augmented reality. Even if you’re missing traffic from those viewers who’ve opted out of tracking, you can still assume that most of your audience is following this trend.

In this case, you may want to propose creating more AR content or updating your older AR content for increased conversions.

Once you have a clear process in place, be sure to support the relationships. Share updated reports and data that offer value to each stakeholder consistently. This can help you use marketing attribution to support your marketing goals.

Marketing Attribution Tools

HubSpot

HubSpot Dashboard and Reporting software is excellent for attribution reporting. This is because it makes it simple to pull marketing, sales, and service data into a single report.
Marketing attribution software: HubSpot

Instead of collecting unique data from a range of tools you can quickly and accurately create custom attribution reports. It sounds simple, but it helps your team save time and avoid critical errors.

Besides the extensive data available in the HubSpot platform, you can pull in data from 1000+ app integrations. This tool also keeps data secure and lets teams create reports with different levels of user access — a critical feature for privacy.

Each attribution report includes a ‘Learn about Attribution Models’ modal. These show you how to toggle the different models and see firsthand how they apply credit to each interaction.

You can add or remove different models in real time, apply different rules to the journey, and understand the value of each interaction. There are also convenient pre-built sample reports for reporting beginners.

Then, you can add attribution reports to custom dashboards. This makes it easy for you to track changes at a glance or quickly share updates with stakeholders.

Keep reading to learn more about attribution reporting and how to create attribution reports with HubSpot.

Google Analytics

Google Analytics also offers attribution models for reporting. This is a popular analytics tool, and it will be most helpful for marketing attribution at the top of your marketing funnel.
Marketing attribution software: Google Analytics

To get attribution reports in Google Analytics, you need to create an attribution project and you may need to create extra views. This step may also mean setting up goals and conversions for specific channels. You can see the full instructions on how to set up your site for attribution here.

If you plan to use data-driven attribution models, it could take a few weeks before you can begin reporting on attribution. If you’re new to data reporting, this comprehensive guide to Google Analytics can help you get started.

Keep in mind, as your website visitors and prospects convert to leads, it may be more difficult to track their buyer journey with this tool.

For example, GA’s attribution models exclude direct website visits from attribution. You can read more about the different types of Google Analytics models and how to use them here.

Another aspect of Google Analytics reports is that you cannot connect the report back to specific contacts unless you use a tool like HubSpot. This makes it challenging to apply attribution trends to:

  • Personas
  • Contact groups
  • Lifecycle stages
  • Other business-relevant categories

Windsor.ai Analytics

Windsor.ai is a machine-learning-powered tool that collects and organizes attribution data from a range of other tools. It offers multi-touch attribution reporting to help users understand the customer journey and optimize for performance.
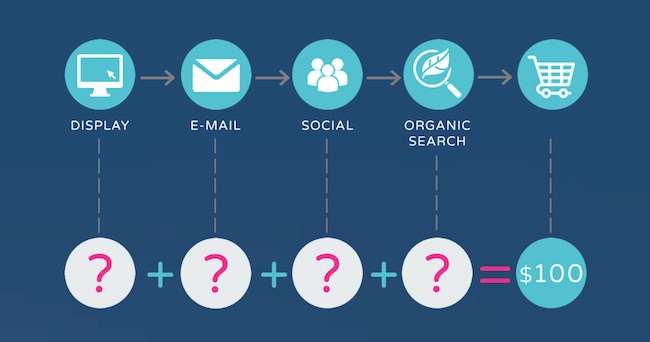
Marketing attribution software: Windsor.ai

You can learn more about the data-driven attribution models they favor in this article.

This tool also collects and compares both offline and online marketing data. It has 50+ native integrations, including integration with Zapier, which enables additional connections. Then, this attribution software pulls together those different data streams for marketing analysis.

Its YouTube channel is full of useful videos to show users how to make the most of this platform.

HubSpot customers: Check out the Windsor.ai integration for extra insights.

Check out this list if you’re looking for more great attribution software choices.

Use Marketing Attribution to Improve Every Channel and Campaign

Marketing attribution can help your team figure out which channels and messages impact buyer decisions. It helps you focus your strategy and tactics on what drives ROI for your business. Attribution makes it easier to see the results of every decision you make so you can make the best decisions for your business.

So, what are you waiting for? Pick a marketing attribution tool. Start tracking your results with attribution in mind. Then, watch your marketing efforts increase exponentially in value.

Editor’s note: This post was originally published in August 2014 and has been updated for comprehensiveness.

 marketing reporting templates

Categories B2B

What Is Demand Generation? [FAQs]

If you ask 10 different B2B marketers what “demand generation” means, you’ll get 10 different answers.

Unfortunately, there are a lot of misconceptions about demand generation in B2B marketing.

In this guide, we’ll clear up the confusion. You’ll get an updated definition of demand generation, along with the components of a successful demand generation strategy.

And finally, you’ll learn why demand generation is not the same as lead generation.

Download Now: Lead Generation Best Practices Guide

What is demand generation?

Demand generation captures the umbrella of marketing programs that get customers excited about your company’s product and services without trying to explicitly sell to them.

Demand generation programs can help your organization reach new markets, promote new product features, build consumer buzz, generate PR, and re-engage existing customers.

Essentially, demand generation is a long-term, education-focused marketing strategy that prioritizes reaching and engaging “out of market” buyers.

 The ultimate goal of B2B demand generation is remaining top of mind while your potential customers are not in a buying cycle — so that whenever the need arises, your product or service is immediately considered for purchase.

What makes demand generation a distinct concept from other customer acquisition tactics is a commitment to long-term customer relationships and a strategic mindset.

Why is demand generation different than lead generation?

Demand generation marketing is about educating your audience with no expectation in return. Meanwhile, lead generation is optimized for capturing contact information – but prematurely pushes non-solution seeking people to sales automation workflows, which is highly ineffective.

Image Source

Why are most lead generation strategies unsuccessful?

Let’s explore six reasons most lead generation strategies can be unsuccessful.

  • Misaligned to the modern day buyer’s journey. Gartner research reveals that B2B buyers only spend 17% of their time talking to sales — yet most lead generation efforts are geared toward ushering prospects into a sales conversation.
  • Destroys the morale of sales teams. Since most MQLs by definition are not in a buying cycle, you are exposing SDRs to mental harm by generating large volumes of uninterested leads.
  • Creates a hostile environment between sales & marketing. Where the classic conflict of “marketing is sending us garbage leads” and sales can’t close deals results in tremendous inefficiency.
  • Damages brand perception among research-stage buyers. These are buyers that may eventually request a demo when they are motivated and ready to speak to sales.
  • Gating content generates top of the funnel leads. Types of content like white papers, webinars, case studies and free tools primarily collects the contact information of uninterested buyers (MQL).
  • Over-reliance on lead scoring and lead nurturing. With this method, marketing teams are placing a bet on their ability to use behavioral data and intent signals to predict the right sales triggers.

Gated Content: Bad Practices versus Good Practices

Is gated content an acceptable lead generation tool for demand generation?

Let’s start by looking at the biggest drawbacks of gated content:

  • Lack of page views and traffic.
  • No SEO benefit or boost
  • The form deters people from downloading content
  • No brand visibility

But if you’re going to march-on with gated content, it should be done for ABM warm-up, and not direct response sales follow up.

The Role of Inbound Marketing in B2B Demand Generation

Inbound marketing is a key component of any high-performing demand generation campaign. However, this is no longer about content calendars or the AIDA framework.

Instead, it’s about alignment with sales to properly respond to a buyer’s intent to purchase (declared intent), while orchestrating and facilitating the desired purchasing experience.

Today, with inbound marketing, you are either capturing demand or creating demand.

Let’s explore what that means.

Demand Capturing: Intent Channels and Content Examples

Demand Creation: Education Channels and Content Types

  • Social Media Platforms: LinkedIn, Twitter, Facebook, TikTok.
  • Influencer Marketing: Brand awareness or product launch campaigns with relevant influencers in your niche.
  • Email Marketing: Newsletters, content promo, nurture sequences and event invites.
  • Online Communities: The Hustle, Sales Hacker, Demand Curve, etc.
  • Offline Media: Direct mail, NYC subway ads, etc.
  • Offsite Channels: Guest posts, press and thought leadership.
  • Audio Channels: Podcasts, interviews, radio advertising.
  • Video: YouTube, LinkedIn, Vimeo, Wistia, Loom, etc.
  • Events: Webinars, live hangouts, virtual conferences.
  • Conferences: INBOUND, SaaStr, Dreamforce, etc.
  • Forums: Reddit, Quora, Slack, Discord.
  • Brand search volume
  • Your brand vs. competitor brand search volume
  • Organic traffic to high intent website pages
  • Direct traffic (people type your website URL into the browser)
  • Entrances and engagement on your feature / solutions pages
  • Referral traffic from other relevant websites and social platforms
  • Assisted conversions: pages consumed “on the path” to becoming a conversion.
  • Website traffic to conversion rate (declared intent)
  • Qualified demo to sales opportunity rate
  • Proposal sent to closed/won rate
  • Average deal size
  • Sales pipeline velocity
  • Cost per acquisition (CPA)
  • Customer lifetime value (CLV)

The Role of Sales in B2B Demand Generation

Rewind to five years ago and ask anyone about demand generation — they’d tell you it was marketers disguised as salespeople running lead generation tactics via marketing automation.

And that’s because marketing used to be a service organization to sales, until B2B executives realized that marketing should be a strategic partner — not an order-taker.

Today, outbound-focused demand generation is not about high-volume cold outreach with automated follow-up sequences. Instead, it’s about ABM (account-based marketing), the inverted marketing funnel.

Image Source

Instead of a top-down inbound marketing approach, ABM is a bottom-up marketing strategy that collaborates with sales to engage with high-quality leads and target accounts during complex B2B sales cycles.

Revenue teams have learned that full-funnel marketing with a hybrid mix of inbound, outbound, and lifecycle marketing is the right balance for a high-performing demand generation program.

Metrics and KPIs for Measuring Success

Your demand generation marketing efforts should be guided by a north star: lead quality.

In addition to understanding key SaaS metrics, these are important questions to ask:

  • Which channels are driving highly qualified leads? 
  • Which lead types most often convert into qualified sales pipeline? 
  • What percentage of our opportunities convert into paying customers?
  • What percentage of our paying customers stick around long enough to become profitable?
  • Which marketing channels are driving opportunities with the best LTV? 
  • How do we generate more qualified opportunities from the best channels?
  • How do we champion full-funnel pipeline visibility?
  • How do we hold sales accountable for working the leads properly? 
  • How can we develop an effective feedback loop between marketing & sales?

Leading indicators: example metrics

  • Brand search volume
  • Your brand vs. competitor brand search volume
  • Organic traffic to high intent website pages
  • Direct traffic (people type your website URL into the browser)
  • Entrances and engagement on your feature / solutions pages
  • Referral traffic from other relevant websites and social platforms

Lagging indicators: example metrics

  • Assisted conversions: pages consumed “on the path” to becoming a conversion.
  • Website traffic to conversion rate (declared intent)
  • Qualified demo to sales opportunity rate
  • Proposal sent to closed/won rate
  • Average deal size
  • Sales pipeline velocity
  • Cost per acquisition (CPA)
  • Customer lifetime value (CLV)

Declared Intent vs. Assumed Intent

Digital marketing has evolved away from direct response, lead generation focused marketing campaigns to a more holistic approach that covers brand awareness, demand nurturing, and demand capturing across the entire sales funnel.

With this in mind, it’s worthwhile to think about the CTA buttons on your website — and what constitutes declared intent vs. assumed intent.

Run a “declared intent audit” to check if assumed intent leads are being treated as declared intent. If yes, that’s a clear misalignment of sales experience and buyer expectations..

This is the decisive test which confirms if your marketing team truly understands the customer journey — a critical component of any demand generation program.

Once you’re acquainted with your buyers’ needs and can anticipate marketing trends, you can fuel your marketing programs with enhanced levels of personalization.

Marketing automation software will help you run A/B tests, choose the right content, and customize timing for each of your marketing campaigns and customer segments.

To begin with your demand gen strategy, get to know your customers and conduct qualitative research through user feedback and conversations. If you’re struggling to understand your prospects’ needs, pick up the phone and ask.

The success of demand generation stems from your ability to connect with target customers. All you need to get started is a point of reference.

Introduction to Lead Nurturing